Automobile Control System using Controller
Area Network
Bibhash Ranjan
Department of electronics and communication Lovely Professional University
Punjab, INDIA
Mayank Gupta
Department of electronics and communication Lovely Professional University
Punjab, INDIA
ABSTRACT
The rapid development in electronics industries is making the automobile industries smarter day by day. More number of electronics subsystems are being integrated in the modern automobile which increases the wiring among the overall system, cost and reduces the system reliability. To overcome this problem of complex wiring, cost, system reliability and data interchange among different electronics subsystem, an automobile control system is designed using controller area network protocol. This paper describes the control system design using three nodes in the simulation tool. The simulation setup of CAN bus control system contains the software flowchart, the database and the experimental graphs which is obtained during data transfer between nodes. The system comprises of the engine ignition, speed, headlight and the hazard-light. The software part of the automobile control system is designed and sharing of data is fully realized among the node.
General Terms
CAN bus, nodes, panel, frame.
Keywords
CAN bus, simulation setup, node, panel designer, database, and system variables.
1.
INTRODUCTION
With the development of automotive industries the need of real-time communication between the different electronics units were demanded. In the 1980’s the Robert Bosch Gmbh started to develop the CAN (Controller Area Network) communication protocol for real time control in vehicle to overcome the problem of complex wiring, cost, system reliability and data interchange among different electronics subsystem [1]. Controller Area Network (CAN) is a broadcast, serial bus system for real-time control applications which operates at data rates of up to 1 Megabits per second, and has a very high level of security and error detection mechanisms. The bit – wise arbitration scheme allows a non destructive arbitration when more than one stations try to start sending a message at the same time. The non-destructive arbitration makes it possible to fulfill response times in a real - time control system with a rather low bus transfer rate [2]. This paper include implementation of control system of a car using CAN. The control system compromises of three node for engine ignition, speed and light control. The design has been implemented on CANoe/CANalyzer software which
include database, panel designer and the graphical results obtained during testing. The paper is organized as follow:
Section II include technical and basic of CAN standard. Section III contains the flowchart and the system design in the software. Section IV includes the simulation results obtained during simulation in terms of graphs and traces and Section V concludes the paper.
2. BASICS AND FEATURES OF CAN
Controller Area Network (CAN) is a network protocol that allows multiple processors in a system to communicate efficiently with each other. The CAN communication protocol is a carrier-sense multiple-access protocol with collision detection and arbitration on message priority (CSMA/CD+AMP).
Some important features of CAN bus are [3]:-
This protocol support maximum signaling rate of 1M bit per second (bps).
Based on the priority as set by the unique identifier important information frames are set with higher priority, which increases the accuracy of data transmission.
It not only supports to add new nodes to the CAN bus, it also reserved space for the future expansion in the application protocol layer.
An unpowered node or brown-out event will not disturb the CAN bus or we can say if a node is removed from the system the bus will remain unaffected.
CAN provides sophisticated error-detection and error handling mechanisms such as CRC check, and high immunity against electromagnetic interference. Erroneous messages are automatically retransmitted [3].
Basically CAN protocol defines serial transmission and reception of data through CAN bus and data is transmitted in terms of frame, which is mainly of four types [4]:
Data frame: The data frame is the most common message type, and is made up by the arbitration field, the data field, the CRC field, and the acknowledgement field.
Remote frame: It is a remote request for transmission of a certain frame, a node receives a remote frame X simply receive a “send me back data frame X”. Error frame: is used by CAN nodes to signal the
occurrence of an error on the bus.
In CAN protocol data is broadcasted to all the nodes available in the CAN system, so the message frame does not contain the sender address or the receiver address. It contain unique identifier (ID) for every frame.
Start Identifier Control Data Checksum ACK End IS
Figure1: CAN frame format.
Since CAN protocol is a CSMA protocol so only one node send message frame at a time and all the other wait until the transfer by the sender is completed. Each CAN node has filtering mechanism which help them to decide whether the received frame is of their use or not, if the node is interested in the received frame then it will keep the frame otherwise it will discard it.
Now it may happen that two or more than two nodes tries to transmit data at the same time which may result in collision so to overcome this it uses CSMA/CD (carrier sense multiple access with collision detection )protocol. A CAN protocol defines two state of bus; dominant state and recessive state. Dominate state is defined for logic 0’s and recessive state is defined for logic 1’s. For the two nodes transmitting data at the same time then bus arbitration takes place. The unique identifier decides the bus priority of the frame indicating which node should transmit the data first. The example shown in figure 2 explains the bus arbitration. The first two bit of the ID field goes on the bus and no collision occurs then the third bit is transmitted, now here node A is in recessive state but will read a dominant state since node B is in dominant state. Hence node A will realize that the bus is busy with highest priority frame so its transmission will be stopped and it will wait till the bus is free. Node B will continue to transmission since it is in dominant state [5].
Figure2: Bus arbitration in CAN
So in this technique every controller need to read back every bit before sending its successor due to which total bus length is limited to 40 meters at 1 Mbps data transfer speed. Relationship between data transfer rate and bus length for twisted pair is shown below in figure3.
Figure3: Data transfer rate and length.
3. SYSTEM DESIGN
The control system for automobile using three CAN node is designed on a software tool. The three node include engine ignition, headlight and the hazard light. CANoe/CANalyzer is the software tool which used for the system design.
The flowchart for the system design is shown in figure 4.
Figure4: Flowchart of system design.
3.1 Database
Database of the system defines the overall functionality of the system among different network nodes which include the input as well as output variables of the system. It include defining messages and configuring the baud rate of the bus. Database of the system define two important aspects of the system:
1. Exchange of the information or message frame between two network nodes via communication bus i.e. CAN bus
Each peripheral element is "wired" to an environment variable or system variable i.e. it is connected to the CAPL program for the network node. Simulation tool evaluate this information first to provide initial estimates of bus load and the latency times to be expected at the prescribed baud rate. Afterwards, this specification can also be utilized for testing in subsequent phases [6]. Here the network node is also configured for the further processing of the data by the
receiver node such that the result of the simulation validate the system design.
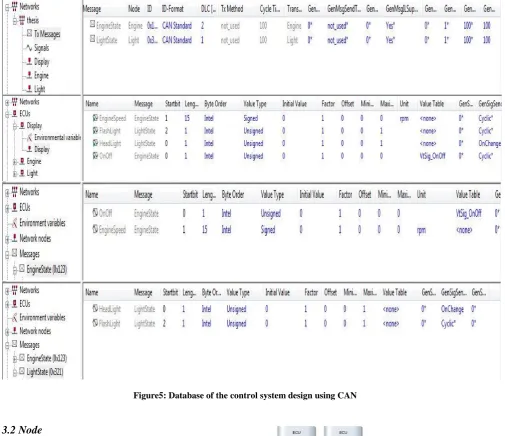
[image:3.595.52.558.179.615.2]The database of the control system design is shown below in figure 5.
Figure5: Database of the control system design using CAN
3.2 Node
Network node is created in the simulation setup. In this system design three node has been created. After creating the network node, these node are configured. Each node has its own editor, compiler and panel so each node can be configured independently. This adds to the advantage in the system design because if a node new node is added to the system then the system remains unaffected.
3.3 Associate the database
The database created at the initial stage of the system design is now associated with the network node so that the network node can interact with the periphery and respond to the input of periphery and perform the desired operation in real time.
3.4 Panel design
[image:4.595.55.282.283.423.2]The software provides an option of creating a user friendly interface to the environment or the system variables and integrating them to the program. Here external events of the system design are described with the help of symbols, whose name and type are defined in the database. The panel is created using panel designer [6]. During simulation values of environment or system variables are displayed and modified through panel. Values of the symbols can be configured whenever needed. The change in the value can be can be visualized on the panel using display element.
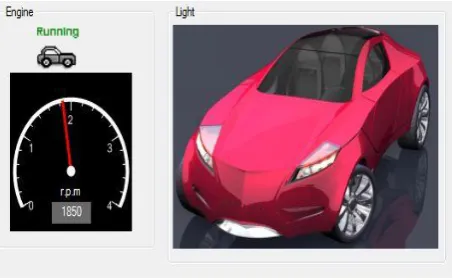
Figure 7 and figure 8 shows the panel created for the system design of the control system of the automobile.
Figure7: Display panel of the automobile control system
As show in the panel the car is in running mode where its speedometer shows the running status displaying number of RPM and the hazard light which is ON state.
Figure8: Control panel of the control system usin CAN
The above panel shows the control panel for the control system desgined for automobile. This panel comprises of engine ignition control, speed control and light control of the system.
After panel is dsigned, the panel configuration is then added to the node. These panel act as an interface between peripherals and the system.
3.5 Node Behaviour
The node behavior is created through programming. We use CAPL (Communication Application Programming Language) programming language feature of CANoe to give behavior to
own editor such if any of the node is removed the system remain unaffected and work efficiently. CAPL programs enables user to interface with wide variety of input, outputs and other functions.Start-stop events, keyboard entry events, the ability to transmit and receive CAN messages, interaction with the serial port and parallel port, the use of timers, and the ability to interconnect to customer specific DLLs are some of the interface choices available inside the CAPL programming Environment [6].
4. SIMULATION RESULT
The above section describes the control system design using CAN standard. The system is then successfully simulated and this section describes the result obtained. The result is obtained in terms of graphs, trace and data analysis.
Figure9: Graphical analysis of engine speed, hazard light and headlight.
The graph of engine speed represent variation of engine speed in terms of revolution per minute (RPM) with respect to time. At the start of the ignition the engine speed is at zero state but with the gradual variation in the speed we can see the proportional variation in the plot with respect to time. At the maximum speed i.e. at 3500 rpm the plot attains its maximum and when brake is applied we can see the gradual decrease in the curve.
The graph of headlight indicate the duration for which the headlight is operated and the duration for which it is in OFF mode.
Figure10 : Data analysis
Data analysis represents the state of all the node in terms of data.
CANoe immediately begins cyclically transmit the message that has been configured in the generator block. In the first line show the message that is sent by the generator block, whereby the first column shows the transmit time relative to the measurement start. The next column shows you which of the two CAN channels was used to transmit. This value (1) agrees with the default value assigned in the generator block's transmit list of messages to be transmitted [6].
Figure11: Trace analysis of the system representing the frame and data that are transmitted by the node.
Comparative study of High speed CAN with respect to other existing technology is show in table1 below:
Table1: Comparison of High speed CAN with other technologies.
5. CONCLUSION
CAN bus has advantage over the complex wiring system since it is more reliable network with efficient error handling mechanism, automatic recovery, cost reduction and provide an efficient data interchange mechanism among different nodes. CAN standard has been adopted by many of the automotive industries such as Mercedes, BMW, Volkswagen, etc. CAN bus is still under development stage and with the continuous development of CAN bus, it will be more widely applied in the field of the automotive industries.
6. ACKNOWLEDGMENTS
I am very thankful to Mr. Mayank Gupta and Sajithlal Kamalan for his kind help and support in completion of this paper. And also to my friend for their support and motivation.
7.
REFERENCES
[1] Kiencke U, Kytola T. 1997.“CAN, a Ten Years’ Anniversarial Review”, Institute of Industrial Information Systems, University of Karlsruhe.
[2] L. Vhzquez , L. Rojas , E. Uribazo. 2000. “Intelligent CAN - ISA Gateway Development to Industrial Networks and Internet Coupling”, IEEE.
[3] Qiangsheng Ye. 2010. “Research and Application of CAN and LIN Bus in Automobile Network System”,IEEE.
[4] Zhou Yongqin, Wang Xudong, Zhou Meilan. 2006 “The Research and Realization for Passenger Car CAN Bus” IEEE.
[5] H. Shokry, M. Shedeed, S. Hammad, M. Shalan and A. Wahdan. 2009.“Hardware EDF Scheduler Implementation on Controller Area Network Controller”,IEEE.
[6] CANoe 75 manual “Vector Informatik GmbH” .
Common
Name Baud Rate
Max Nodes
Maximum Length
High
speed-CAN max. 1 MBit/s 110 6500m
J1939 250 KBit/s 30 40m
Single Wire
CAN 33,3 KBit/s 32 -