Robust Regulation of the Photovoltaic Voltage using
Sliding Mode Control as Part of a MPPT Algorithm
Omar Boukli-Hacene
Tlemcen University, FT/GEE/Laboratory of automatic
B.P. 230, Chetouane, Algeria
Ali Chermitti
URMER Research unit, Tlemcen University, B.P. 119, Tlemcen, Algeria
ABSTRACT
The cost of the solar photovoltaic energy production is quite high and its efficiency is very low, hence the need to optimize the conversion process. This paper presents the synthesis of a robust control law for regulation of the photovoltaic voltage which is added to a MPPT algorithm to maximize power generated. The simulation results under Simulink confirm the efficiency and robustness of the proposed control.
General Terms
Photovoltaic systems, Maximum Power Point Tracking, Nonlinear control, Robust control.
Keywords
Photovoltaic systems, Robust control, Sliding mode control, Photovoltaic power, Perturb and observe MPPT algorithm.
1.
INTRODUCTION
Photovoltaic solar energy is one of the most dynamic markets of the renewable energy sector. It represents an alternative to traditional methods of producing electrical energy, which emit combustion wastes and pollutants harmful to the ecosystem.
Solar energy can be converted into electricity using solar panels which are made of photovoltaic (PV) cells. However, the conversion efficiency is low and the panels manufacturing cost is relatively high. For this reason, the photovoltaic energy conversion must be optimized to the maximum.
The power characteristic of a panel or PV generator (PVG) is nonlinear. It is characterized by a particular point at which the power supplied by the PVG is maximum. This point is usually noted MPP for Maximum Power Point. The MPPT (Maximum Power Point Tracker) is an electronic device which aims to maintain the system operating point as close to the MPP. In the literature, there are several MPPT control algorithms, the most used is the Perturb and Observe algorithm (P&O).
The purpose of this article is the synthesis of a robust and optimal control law for the photovoltaic voltage regulation. It comes to the sliding mode control. This control law is added to the MPPT algorithm to optimize energy conversion minimizing power loss.
This paper is organized as follows: the photovoltaic generator is described in Part 2. The matching stage between PVG and a load is presented in Part 3. The MPPT converter together with the P&O MPPT algorithm is outlined in part 4. The synthesis of a robust control for regulating the PV voltage and the simulation results are detailed in Section 5, followed by a conclusion in the last section.
2.
PHOTOVOLTAIC GENERATOR
The PV cell is the basic element of a PV system. A plurality of electrically interconnected cells forms a PV module,
several modules form a panel and several panels form a PV array. The term PV generator (PVG) is used in this article to designate a module or a PV panel.
[image:1.595.356.501.282.369.2]2.1
Modeling of the PVG
Figure 1. PV module (PVG)
A PV panel is formed by properly connecting several PV cells. The mathematical model of the PVG is given by : [1,2,3,4,5,6,7,12,17] :
Cth s
s oc sc
V
N
IR
V
V
I
I
=
1
exp
(1)2.2
Current/Voltage (I/V) Characteristic of
the PVG
Figure 2. I/V Characteristics of the PVG and a resistive load
In practice, in the case of a direct coupling of a PVG and a load, the OP rarely coincides with the MPP. For this reason, a matching stage, to transfer maximum power from the source to the load is necessary.
3.
MATCHING STAGE BETWEEN A
PVG AND A LOAD
The commonly used adapter in PV systems is a static DC/DC power converter. It ensures, through a control action, the transfer of the maximum of electrical power to the load. The structure of the converter is determined according to the nature of the supplied load. In this article we focus on the step-down DC/DC converter (Buck converter).
3.1
DC/DC Buck converter
[image:2.595.329.524.229.333.2]Figure 3 shows the representation of a DC / DC converter, which can be used as an interface between PVG and the load [1,8,9,10,11].
Figure 3. DC/DC converter between PVG and a load
A Buck converter (figure 4) is a switching power supply which converts a DC voltage into another DC voltage of lower value. This type of converter is used as an adapter between the source and the load, when the OP is to the left of the MPP in direct coupling.
Figure 4. Electrical circuit of a Buck converter
In this case, the voltage across the load in continuous conduction mode is given by:
(2)
Where : is the duty cycle
: is the switching period
4.
THE MPPT CONVERTER
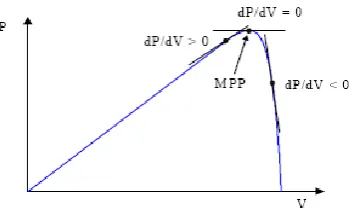
The power delivered by a PVG depends greatly on the level of sunshine, temperature and also the nature of the load supplied. It is therefore highly unpredictable. The power characteristic (figure 5) presents a maximum at the point PMAX
[image:2.595.79.257.446.544.2]corresponding to the MPP.
Figure 5. Power Characteristic of the GPV
The MPP position, depending on the various factors is never constant over time. The role of the DC/DC converter is to maintain the OP as close to the MPP for any operating conditions. An appropriate command will achieve this goal. Then we obtain a MPPT converter (Maximum Power Point Tracker). The MPPT converter is a power conversion system with a control algorithm for extracting the maximum power from the PVG [1,8,9,10,11]. It regulates the input voltage Vpv. The reference voltage is then imposed by the control algorithm.
4.1
The Perturb and Observe MPPT
algorithm (P&O)
The P&O method is generally the most used because of its simplicity and ease of implementation [2,4,14,15,16]. As its name indicates, this method works by perturbing the system and observing the impact on output power of PVG. In figure 6, one sees that if the operating voltage is perturbed in a given direction and that the power increases , then it is clear that the perturbation has moved the operating point toward the MPP. The P&O algorithm will continue to perturb the tension in the same direction. By cons, if the power drops
[image:2.595.72.262.631.723.2] [image:2.595.342.517.651.755.2]Figure 6. Sign of dP/dV at different positions of the power characteristic curve
The process is periodically repeated until the MPP is reached. The system oscillates then around the MPP, which causes power loss. The oscillation can be minimized by decreasing the size of the perturbation. However, a too small perturbation slows considerably tracking the MPP. Then there is a compromise between accuracy and speed [16].
5.
SYNTHESIS
OF
A
ROBUST
CONTROL
FOR
PHOTOVOLTAIC
VOLTAGE REGULATION
The switching power converters represent a particular class of variable structure systems (VSS). The latter are by definition nonlinear discrete systems that change structure or appear as various continuous nonlinear systems according to the state of the system [18]. Therefore, these converters can take advantage of nonlinear control techniques developed for this class of systems. Indeed, the power converters being endowed with a switching device, it is easy to design a discontinuous control law. The Sliding Mode Control (SMC) appeared in the Soviet Union in the 60s, which comes from the theory of VSS, allows accomplishing this task. This command leads to stability even in the presence of large variations in the supply or load, to good dynamic response and a simple implementation [19,20,21].
The system used for our study consists of the Sharp SH-80 PV panel whose characteristics are given in Table 1, of a buck converter as an interface of adaptation and a lead acid battery with a voltage of 12 V as a load.
5.1
Modelling of DC/DC buck converter
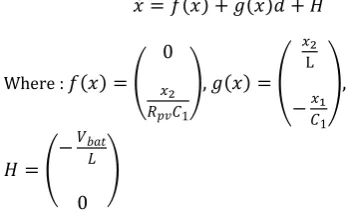
The average model of the buck converter is given by the expression (3), with [9,11].
(3)
with : equivalent load connected to PVG.
: battery voltage.
The expression (3) can be written in the form of a nonlinear time varying system.
Where :
, ,
5.2
System Simulation
To perform the system simulation, one used the component library for standalone photovoltaic systems (Photovoltaic
Systems Toolbox) that have been developed in Matlab/Simulink of Mathworks [17].
The PVG chosen for the simulation is a 36 polycrystalline silicon cells module with a maximum power of 80W. Its parameters are given in Table 1.
TABLE I.
Number of cells 36 in series Open circuit voltage (Voc) 21.6V
Short circuit current (Isc) 5.16A
MPP voltage (VMPP)
17.3V
MPP Current (IMPP)
4.63A
Maximum Power (PMPP) 80W
Regarding the parameters of Buck converter, their values are: L=120μH, C₁=660μF, C₂=100μF.
Figure 7. Piecewise linear approximation of the PVG I/V characteristic
To simplify the analysis, one used a piecewise linear approximation of the PVG I/V characteristic (Figure 7). The I/V curve is divided into four regions: current source region, power region I, power region II and voltage source region. In general, the normal operation of the MPPT converter starts from the voltage source region before moving to power regions I and II and remain there in steady state.
The simulation results using the linearized model are shown below. The figures illustrate the transient step response (open-loop) in the power regions for a 2% change in the duty cycle.
0 0.2 0.4 0.6 0.8 1 1.2
0 0.2 0.4 0.6 0.8 1
Normalized voltage (V/V)
Normalized current
I/V curve MPP
Current source region
Power region II
Power region I
[image:3.595.52.226.611.718.2]Figure 8. System response in the power region II
Figure 9. System response in the power region I
One sees that in the power region II, the answer is averagely damped, while in power region I, it is slightly damped. The settling time is thereby affected. However, the settling time is an important parameter for the MPPT algorithm. In addition, the observed oscillations generate a loss of the power generated by the PVG, which is not desirable.
The time response of the system can be improved by using an appropriate control law.
5.3
Synthesis of sliding mode control
[image:4.595.59.272.302.455.2]The figure below illustrates the overall control loop which includes the MPPT algorithm and the control law which will be synthetized in this section. The algorithm provides the reference voltage which is a tracking of the MPP. The control merely ensures voltage regulation according to specifications.
Figure 10. Overall control loop
The switching function that we have chosen is the following:
(4)
In our case, the reference voltage is provided by the P&O MPPT algorithm.
The control law used in this case is described by:
(5)
Indeed, if then the OP is on the right of the voltage , the command must move it to the left. This is only possible if . By cons, if then the OP is on the left of the voltage , the control must move it to the right. This is possible only if .
5.3.1
Existence of sliding mode
Let us use the following quadratic Lyapunov function candidate:
(positive definite)
The condition of attractiveness is given by:
(6)
(7)
For : In this case, the OP is to the right of the voltage and the control . This leads the OP towards the left implying decrease in the voltage :
(8)
Whence: (9)
For : In this case, the OP is to the left of the voltage and the control . This leads the OP towards the right implying increase in the voltage :
(10)
Whence:
One concludes that the system is asymptotically stable.
0.02 0.022 0.024 0.026 0.028 0.03 0.032 0.034 15
15.1 15.2 15.3 15.4 15.5 15.6
Temps (s) Tension Vpv (V)
0.015 0.016 0.017 0.018 0.019 0.02 0.021 0.022 0.023 16.5
16.6 16.7 16.8 16.9 17 17.1 17.2
The expression of the equivalent control proposed by Filippov is obtained from the condition:
(11)
5.3.2
Simulation Results
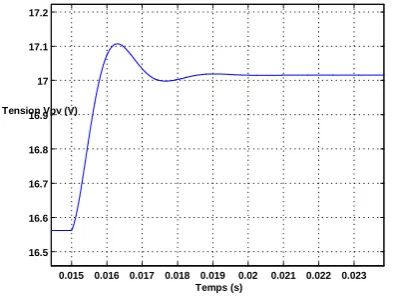
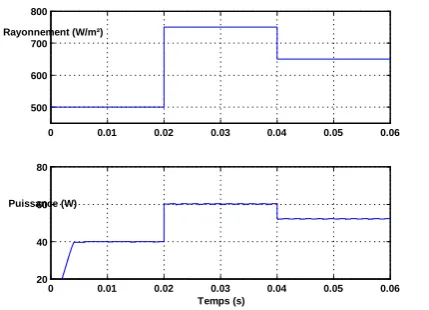
Figure 11 shows the simulation results for a sudden change in the radiation from 500 W/m² to 750 W/m² and then to 650 W/m². In this case, one used the improved P&O algorithm that we have established in [22] with a MPPT frequency of 1 kHz and a perturbation step of 0.4V. The controller regulates the photovoltaic voltage efficiently and optimally thereby avoiding the loss of power caused by the oscillation due to the MPPT algorithm. This indicates the robustness of the synthesized control.
Figure 11. Simulation result of the SMC using a MPPT algorithm for a sudden change in the radiation
The simulation result for a progressive change in radiation is shown above. One sees that the control succeeds to a better regulation of the PV voltage. One also distinguishes the oscillation around the MPP which characterize the MPPT algorithm used.
Figure 12. Simulation result of the SMC using a MPPT algorithm for a progressif change in the radiation
6.
CONCLUSION
In this article, a robust regulation of the photovoltaic voltage using the sliding mode control in the context of a MPPT algorithm has been presented. The component library "Photovoltaic Systems Toolbox" was used to perform the simulation. The simulation results in Simulink showed the effectiveness of the proposed control law.
7.
REFERENCES
[1] A. Luque and S. Hegedus, “Handbook of Photovoltaic Science and Engineering”, John Wiley & Sons Ltd, 2003.
[2] A. Oi, “Design and Simulation of Photovoltaic Water Pumping System", Faculty of California Polytechnic State University, 2005.
[3] T.DenHerder, "Design and Simulation of Photovoltaic Super System Using Simulink", California Polytechnic State University, 2006.
[4] Nattorn Pongratananukul, "Analysis and Simulation Tools for Solar Array Power Systems", University of Central Florida, 2005.
[5] Lionel Vechiu, "Modélisation et Analyse de l'Intégration des Énergies Renouvelables dans un Réseau Autonome", Université du Havre, 2005.
[6] A.D. Halmsen et al, "Models for a Stand-Alone PV System", University of Denmark, 2000.
[7] Dezso Sera, Remus Teodorescu, "PV panel model based on datasheet values", Aalborg University, 2006.
[8] Amel Zenati, "Modélisation et simulation de microsystèmes multi domaines à signaux mixtes : vers le prototypage virtuel d'un microsystème autonome", Université Joseph Fourier Grenoble I, 2007.
[9] Robert W. Erickson, "Fundamentals of Power Electronics", Chapman & Hall, 115 Fifth Avenue, New York, NY 10003, 1997.
[10]Robert Bausière, Francis Labrique, Guy Seguier, "Les Convertisseurs de l'Electronique de Puissance Volume 3 : La Conversion Continue -- Continue (2ème édition)", Paris : Lavoisier-Tec & doc, 1997.
[11]Ned Mohan, Tore M. Undeland, William P. Robbins , "Power Electronics Converters, Applications And Design", John Wiley & Sons, INC, 2003.
[12]W.Xiao, "A Modified Adaptative Hill Climbing Maximum Power Point Tracking (MPPT) Control Method For Photovoltaic Power Systems", The University of British Columbia, 2003.
[13]M.Angel Cid Pastor, "Conception et Réalisation de Modules Photovoltaïques Electroniques", Institut National des Sciences Appliquées de Toulouse, 2006.
[14]Todd Edward Persen, "FPGA-Based Design of a Maximum-Power-Point-Tracking System for Space Applications", University of Florida, 2004.
[15]V. Salas, E. Olias, A. Barrado, A. Lazaro, "Review of the maximum power point tracking algorithms for stand-alone photovoltaic systems", Solar Energy Materials & Solar Cells 90 (2006) 1555—1578.
[16]Trishan Esram, Student Member, IEEE, and Patrick L. Chapman, Senior Member, IEEE, "Comparison of Photovoltaic Array Maximum Power Point Tracking
0 0.01 0.02 0.03 0.04 0.05 0.06 0.07
450 500 550 600
Rayonnement (W/m²)
0 0.01 0.02 0.03 0.04 0.05 0.06 0.07
30 35 40 45 50
Puissance (W)
Temps (s)
0 0.01 0.02 0.03 0.04 0.05 0.06
500 600 700 800
Rayonnement (W/m²)
0 0.01 0.02 0.03 0.04 0.05 0.06
20 40 60 80
Puissance (W)
[image:5.595.60.275.275.430.2] [image:5.595.61.275.552.703.2]Techniques", IEEE TRANSACTIONS ON ENERGY CONVERSION, 2006.
[17]O. Boukli-Hacene, A. Chermitti, "Design of a Library of Components for Autonomous Photovoltaic System Under Matlab/Simulink", International Journal of Computer Applications, Volume 53– No.14, September 2012
[18]F. Allgöwer, P. Fleming, P. Kokotovic, A.B. Kurzhanski, H. Kwakernaak, A. Rantzer, J.N. Tsitsiklis, "Discrete-time Sliding Mode Control : A Multirate Output Feedback Approach", Springer, 2006
[19]G. Spiazzi, P. Mattavelli, L. Rossetto, "Sliding Mode Control of DC-DC Converters", University of Padova, Italy, 2000
[20]G. Spiazzi and P. Mattavelli, L. Rosseto, L. Malesani, "Application of Sliding Mode Control to Switch-Mode Power Supplies", University of Padova, Italy, 2000
[21]G. Spiazzi, P. Mattavelli, "Sliding-Mode Control of Switched-Mode Power Supplies", University of Padova, Italy, 2002