Edited by:
Zhaoping Li, Ronald Reagan UCLA Medical Center, United States
Reviewed by:
Andrew Patterson, Pennsylvania State University, United States Benjamin Moeller, University of California, Davis, United States
*Correspondence:
Kun Lu [email protected]
Specialty section:
This article was submitted to Gastrointestinal Sciences, a section of the journal Frontiers in Physiology
Received:09 April 2017
Accepted:26 June 2017
Published:24 July 2017
Citation:
Bian X, Chi L, Gao B, Tu P, Ru H and Lu K (2017) Gut Microbiome Response to Sucralose and Its Potential Role in Inducing Liver Inflammation in Mice. Front. Physiol. 8:487. doi: 10.3389/fphys.2017.00487
Gut Microbiome Response to
Sucralose and Its Potential Role in
Inducing Liver Inflammation in Mice
Xiaoming Bian1, Liang Chi2, Bei Gao1, Pengcheng Tu2, Hongyu Ru3and Kun Lu2*
1Department of Environmental Health Science, University of Georgia, Athens, GA, United States,2Department of
Environmental Sciences and Engineering, University of North Carolina at Chapel Hill, Chapel Hill, NC, United States, 3Department of Population Health and Pathobiology, North Carolina State University, Raleigh, NC, United States
Sucralose is the most widely used artificial sweetener, and its health effects have been highly debated over the years. In particular, previous studies have shown that sucralose consumption can alter the gut microbiota. The gut microbiome plays a key role in processes related to host health, such as food digestion and fermentation, immune cell development, and enteric nervous system regulation. Inflammation is one of the most common effects associated with gut microbiome dysbiosis, which has been linked to a series of human diseases, such as diabetes and obesity. The aim of this study was to investigate the structural and functional effects of sucralose on the gut microbiota and associated inflammation in the host. In this study, C57BL/6 male mice received sucralose in their drinking water for 6 months. The difference in gut microbiota composition and metabolites between control and sucralose-treated mice was determined using 16S rRNA gene sequencing, functional gene enrichment analysis and metabolomics. Inflammatory gene expression in tissues was analyzed by RT-PCR. Alterations in bacterial genera showed that sucralose affects the gut microbiota and its developmental dynamics. Enrichment of bacterial pro-inflammatory genes and disruption in fecal metabolites suggest that 6-month sucralose consumption at the human acceptable daily intake (ADI) may increase the risk of developing tissue inflammation by disrupting the gut microbiota, which is supported by elevated pro-inflammatory gene expression in the liver of sucralose-treated mice. Our results highlight the role of sucralose-gut microbiome interaction in regulating host health-related processes, particularly chronic inflammation.
Keywords: artificial sweetener, sucralose, gut microbiota, metabolomics, inflammation
INTRODUCTION
sweetener and that the body acquires no calories from sucralose (Grotz and Munro, 2009; Sylvetsky et al., 2012). Most ingested sucralose is not absorbed or metabolized and moves through the gastrointestinal tract unchanged (Roberts et al., 2000). However, this does not prove that sucralose has no effect on the gut microbiota. One study showed that a product containing sucralose altered the rat gut microbiota and induce inflammatory lymphocyte infiltration (Abou-Donia et al., 2008), but the study was considered to be deficient in several aspects (Brusick et al., 2009), including the use of high doses and a sucralose mixture instead of pure sucralose. Another study that focused on the metabolic effects of sucralose on environmental bacteria showed that sucralose can inhibit the growth of certain bacterial species (Omran et al., 2013). Therefore, sucralose may inhibit intestinal bacteria and alter the gut microbiota, and these alterations could affect host health.
The mucosal surfaces of the human intestines are host to more than 100 trillion microbes (including bacteria, fungi, viruses, and parasites) from more than 1,000 species (Ley et al., 2006; Qin et al., 2010). Gut microbes interact with the host mucosa directly via the recognition of pathogen-associated molecular patterns (PAMPs), such as lipopolysaccharide, flagellin, and bacterial DNA and RNA, by mucosal pattern recognition receptors (PRRs;
Maloy and Powrie, 2011). Alternatively, the interaction can occur indirectly through secreted metabolites (Nicholson et al., 2012). These interactions are involved in maintaining symbiotic homeostasis. Increasing evidence indicates that this homeostasis is vital for human health (Holmes et al., 2011; Tremaroli and Backhed, 2012). Gut microbes can help maintain good host health by participating in digestion and fermentation of food, development of immune cells, regulation of the enteric nervous system, and prevention of colonization by pathogens (Holmes et al., 2011). The host, in turn, provides a habitat and nutrients and secretes antibodies to inhibit the aggressive expansion of microbes (Kamada et al., 2013). Being highly diverse, the gut microbiota can be shaped by various factors, including aging, diet, drugs, antibiotics, diseases, stress, exercise, and environmental pollutants (Ley et al., 2006; Nicholson et al., 2012), and if homeostasis is disrupted as a result of this shaping, many adverse outcomes may occur, such as cardiovascular disease, obesity, diabetes, allergies, and cancer (Ley et al., 2006). For example, an increased ratio of Firmicutes to Bacteroidetes was found in obese mice compared with their lean littermates (Turnbaugh et al., 2006), and obesity-related phenotypes were found to be transmissible in a study in which fecal microbes from obese and lean human twins were transferred to germ-free mice (Ridaura et al., 2013). Likewise, a remarkable increase in taurocholic acid andBilophila wadsworthiainduced by dietary fat promotes colitis in IL10-deficient mice (Devkota et al., 2012). Metabolites produced from dietary choline by gut microbes have been shown to be modulated in obesity, diabetes, and cardiovascular diseases (Kim et al., 2010; Wang et al., 2011).
Abbreviations:PAMPs, pathogen-associated molecular patterns; PRRs, pattern recognition receptors; IBD, inflammatory bowel disease; LPS, lipopolysaccharide; iNOS, inducible nitric-oxide synthase; MMP-2, matrix metalloproteinase 2; ROS, reactive oxygen species; GI, gastrointestinal.
Inflammation is one of the most common physical conditions associated with gut microbiota dysbiosis. For example, acute or chronic inflammation is the primary characteristic of inflammatory bowel diseases (IBDs;Xavier and Podolsky, 2007), of which a disrupted gut microbiota is one of the major triggers in addition to genetic factors and the host immune system, although the precise etiology remains unclear (Hill and Artis, 2010). Moreover, increasing evidence demonstrates that low-grade chronic inflammation induced by gut microbiota disruption is associated with metabolic diseases (Holmes et al., 2011). Obesity and diabetes are associated with low-grade inflammation not only in adipose tissues but also systemically. A study of bariatric surgery, a method of reducing body weight for obese individuals, showed that one gut microbe species, Faecalibacterium prausnitzii, is directly related to the reduction of low-grade inflammation in obesity and diabetes (Furet et al., 2010). Dyslipidemia induced by a high-fat diet results in increased levels of lipopolysaccharide (LPS), which is a pro-inflammatory mediator (Holmes et al., 2011). Moreover, chronic inflammation induced by gut microbes can drive the progression of colorectal cancer from adenoma to invasive carcinoma (Uronis et al., 2009). Thus, inflammation can be triggered and modulated by an altered gut microbiota, and exposure to compounds that can alter the gut microbiota may induce inflammation in the host. In this study, we first used 16S rRNA gene sequencing to examine the effects of sucralose on the gut microbiome of C57BL6/J mice over a 6-month administration period. Next, we used metabolomics to profile fecal metabolome changes associated with a perturbed gut microbiome. Finally, we assessed several markers of inflammation to define the effects of sucralose consumption on host tissues. Our results show that sucralose altered the gut microbiome and associated metabolic profiles, which may contribute to inflammatory response in the mouse liver.
MATERIALS AND METHODS
Animals and Sucralose Exposure
Committee. The animals were treated humanely and with regard for alleviation of suffering.
16S rRNA Gene Sequencing of the Gut
Microbiota
The gut microbiota was investigated using 16S rRNA gene sequencing in fecal samples at different time points. DNA was isolated from the feces of individual mice using a PowerSoil DNA Isolation Kit (MO BIO Laboratories) according to the manufacturer’s instructions, and the resultant DNA was quantified and stored at−80◦C until further analysis. The V4 region in the 16S rRNA gene was targeted using the universal primers 515 (5′-GTGCCAGCMGCCGCGGTAA) and 806 (5′
-GGACTACHVGGGTWTCTAAT). For each sample, 1 ng of the purified fecal DNA was used as a template for amplification and then barcoded with specific indexes. The amplified products were then normalized, pooled and sequenced by an Illumina MiSeq at the Georgia Genomics Facility. Paired-end 250×250 (PE250, v2 kit) reads were generated at a depth of at least 25,000 reads per sample. Geneious 8.1.5 (Biomatters, Auckland, New Zealand) was used to process the raw fastq files, and the mate-paired files were trimmed to dispose of bases with an error probability higher than 0.01 and then merged. The data were then analyzed using quantitative insights into microbial ecology (QIIME, version 1.9.1) (Caporaso et al., 2010), and UCLUST was used to match operational taxonomic units (OTUs) with 97% sequence similarity against Greengenes database 13.8. The matched sequences were assigned at five different levels: phylum, class, order, family and genus. The raw data of controls and treated-mice have been uploaded into the MG-RAST server (http://metagenomics.anl.gov/) with the following job IDs: 317595, 317584, 317588, 317586, 317583, 317589, 317596, 317592, 317585, 317598, 317590, 317599, 317582, 317594, 317591, 317581, 317597, 317580, 317593, and 317587.
Functional Gene Enrichment Analysis
An open-source R package, Tax4Fun, was first used to analyze the enrichment of functional genes of the microbiome of each group (Asshauer et al., 2015). The output from QIIME with a SILVA database extension (SILVA 119) was used for this analysis. Tax4Fun can survey the functional genes of bacterial communities based on the 16S rRNA sequencing data and provide a good approximation to the gene profiles obtained from metagenomic shotgun sequencing methods. The results from Tax4Fun were further analyzed using Statistical Analysis of Metagenomic Profiles (STAMP) (version 2.1.3) (Parks et al., 2014).
Fecal Metabolomics Analysis
Metabolites in fecal samples collected at 6 months were extracted using methanol and water as previously described (Lu et al., 2014). In brief, 20 mg of feces was disrupted in 1 ml of a methanol/water solution (1:1) with a TissueLyser at 50 Hz for 5 min, followed by centrifugation at 12,000 rpm for 10 min. The resultant upper phase was collected and dried using a SpeedVac, and the dried samples were re-suspended in 20% acetonitrile for MS analysis. Metabolomic profiling was conducted using
a quadrupole-time-of-flight (Q-TOF) 6520 mass spectrometer (Agilent Technologies, Santa Clara, CA) with an electrospray ionization source interfaced with an Agilent 1200 HPLC system. The detailed method for metabolomics was published previously (Lu et al., 2012). The Q-TOF was calibrated with standard tuning solution (Agilent Technologies) daily to ensure a mass accuracy within 5 ppm. A YMC Hydrosphere C18 column was used to separate the metabolites, and all detectable molecular features in a mass range of 30–2,000 m/z were captured in the positive mode.
Metabolomic Data Processing and
Metabolite Identification
The data obtained from the HPLC-Q-TOF system were processed and analyzed as previously described (Lu et al., 2012). Briefly, the raw.d data were converted to .mzdata format using MassHunter Workstation software (Agilent), and only signals with an intensity higher than 1,000 counts were included in the subsequent analysis. Peak alignment, intensity calculations, and comparisons between the control and treatment group were performed using the XCMS Online tools. Significantly changed molecular features were profiled and searched against the Human Metabolome Database (HMDB) (http://www.hmdb. ca) and METLIN (http://metlin.scripps.edu) with a 10-ppm mass accuracy threshold. The matched exact masses were stored and used for the generation of MS/MS data to tentatively identify the metabolites. The matched molecular features were fragmented using MS/MS in the Q-TOF 6520 mass spectrometer to obtain the product ions, and the spectra were compared with the HMDB and METLIN MS/MS database to identify significantly altered metabolites, with at least two matched fragments within a 200 ppm mass accuracy as the matching threshold.
Quantitative Real-Time Polymerase Chain
Reaction (qPCR)
Liver was first segmented into left lobe, media lobe, right lobe, and caudate lobe during necropsy. Each liver segment was put into a 2 ml tube, followed by immediate addition of 1 ml of RNAlaterR solution (Thermo Fisher Scientific). The tubes were
stored at+4◦C overnight to allow the RNAlaterR solution to
inhibit the RNase before they were transferred to the−80◦C
freezer for storage. Liver samples (right lobe) treated with RNAlaterR were used to isolate RNA with an RNeasy Mini
Kit (Qiagen, Valencia, CA) according to the manufacturer’s instructions, and the resultant RNA was digested with a DNA-freeTM DNA Removal Kit (Thermo Fisher Scientific) to remove
genomic DNA contamination. RNA integrity number (RIN) for each RNA sample was measured with an Agilent Bioanalyzer. The RIN typically was >9.0, indicating no RNA degradation in the samples and processing. Then, cDNA was synthesized from 1µg of total RNA using iScriptTM Reverse Transcription
Supermix for RT-qPCR (Bio-Rad Laboratories, CA), and the products were diluted to 1:5 before use in subsequent reactions. Quantitative real-time PCR was performed on a Bio-Rad CFX96 TouchTM Real-Time PCR Detection System using
SsoAdvancedTM Universal SYBRR Green Supermix (Bio-Rad).
as follows: TNF-α, 5-CCCTCACACTCAGATCATCTTCT and 5-GCTACGACGTGGGCTACAG; IL-6, 5-TAGTCCTTCCTA CCCCAATTTCC and 5-TTGGTCCTTAGCCACTCCTTC; IL-1β, 5-GCAACTGTTCCTGAACTCAACT and 5-ATCTTT TGGGGTCCGTCAACT; iNOS, 5-GTTCTCAGCCCAACAATA CAAGA and 5-GTGGACGGGTCGATGTCAC; MMP-2, 5-CAG GGAATGAGTACTGGGTCTATT and 5-ACTCCAGTTAAA GGCAGCATCTAC; MMP-9, 5-ATCTCTTCTAGAGACTGG GAAGGAG and 5-AGCTGATTGACTAAAGTAGCTGGA; MMP-13, 5-GTGTGGAGTTATGATGATGT and 5-TGCGAT TACTCCAGATACTG; and β-actin, 5-CGTGCGTGACATCAA AGAGAA and 5-TGGATGCCACAGGATTCCAT. All results were normalized to the β-actin or GAPDH gene (endogenous control). The fold change in expression over control samples was calculated using the11CT method by CFX manager software (Bio-Rad). The qPCR conditions were 95◦C for 10 min, 40 cycles
of 15 s at 95◦C, 30 s at 60◦C, and 30 s at 72◦C, and a final melting
curve analysis performed by raising the temperature from 65 to 95◦C in 0.5◦C increments for 0.05 s each. Potential genomic DNA contamination was controlled for by DNase digestion and the inclusion of a No-RT control, and technical contamination was controlled for by the inclusion of a No-template control.
Data Analysis
The difference in individual gut bacterial components between control and sucralose-treated mice at different time points was assessed with the Mothur software. A two-tailed Welch’s t-test (p <0.05) was used to compare the difference in metabolites between the control and sucralose-treated mice. Additionally, principle component analysis (PCA) was used to examine the intrinsic clusters and outliers. Partial least squares discriminant analysis (PLS-DA) and a hierarchical clustering heat map was used to visualize metabolomic difference in different groups. A two-tailed Student’st-test was used to determine the statistical significance of pro-inflammatory gene expression between the controls and treated mice.
RESULTS
Sucralose Altered the Developmental
Dynamics of the Gut Microbiome
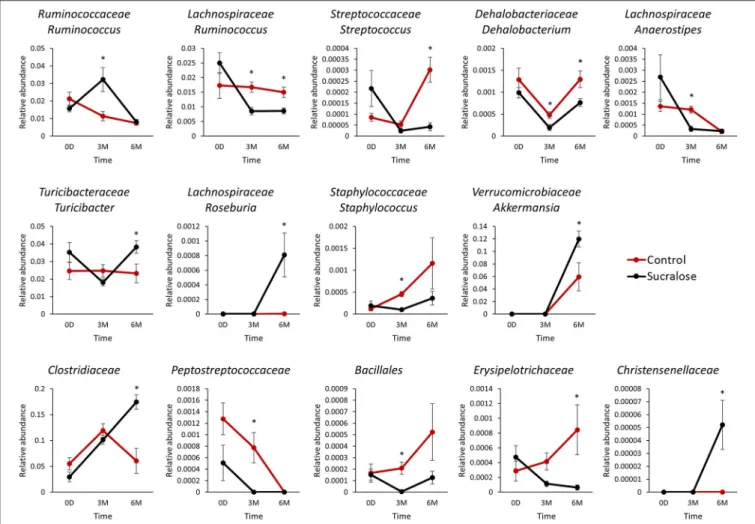
The gut microbiome is a dynamic system, and its bacterial composition shifts over time. Maintaining normal developmental trajectories of the gut microbiome is critical for its functions. Feces collected from both groups of mice at baseline and after three and 6 months of administration were employed to investigate the effects of sucralose on the gut microbiome. Using 16S rRNA gene sequencing, we found that 14 genera exhibited different patterns over time in sucralose-treated mice compared with control mice, as shown in Figure 1. These bacterial genera exhibited no significant difference in abundance at baseline but were significantly different after three and/or 6 months of treatment, indicating that sucralose disrupts the developmental dynamics of gut bacteria. The genera included Turicibacteraceae Turicibacter, Lachnospiraceae Ruminococcus, Ruminococcaceae Ruminococcus, Verrucomicrobiaceae Akkermansia,Staphylococcaceae Staphylococcus,Streptococcaceae
Streptococcus, Dehalobacteriaceae Dehalobacterium, Lachnospiraceae Anaerostipes, Lachnospiraceae Roseburia, and unclassified members in Family Clostridiaceae, Christensenellaceae, Peptostreptococcaceae, Erysipelotrichaceae and OrderBacillales..
Sucralose Increased the Abundance of
Bacterial Genes Related to
Pro-inflammatory Mediators
We next examined whether the changes in gut microbiome composition were associated with functional perturbations of the gut bacteria. Indeed, a number of bacterial functional genes were enriched in sucralose-treated mice. For example, functional gene enrichment analysis of the gut microbiome showed that genes related to bacterial pro-inflammatory mediators were highly elevated in sucralose-treated mice, as shown inFigure 2. Specifically, genes related to LPS synthesis were significantly increased after 6 months of treatment. In addition, multiple genes related to flagella protein synthesis were increased in sucralose-treated mice. Likewise, genes involved in fimbriae synthesis increased in sucralose-treated mice. Numerous bacterial toxin genes, such as toxic shock syndrome toxin-1 and shiga toxin subunits, were also elevated in sucralose-treated mice.
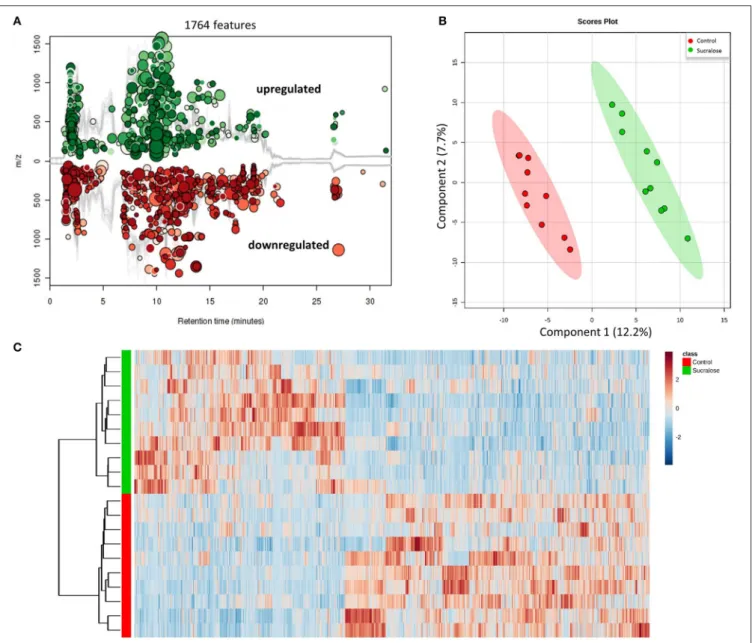
Sucralose Changed the Fecal Metabolome
We next conducted metabolomic profiling to examine the functional impact of sucralose on the fecal metabolome. The combination in feces of a large quantity of gut bacteria and their metabolic products creates an ideal biological sample to assess functional changes in the gut microbiome. A total of 13,611 molecular features were detected in fecal samples, 1,764 of which were significantly different (p<0.05 and fold change>1.5) between the sucralose-treated and control mice (Figure 3A), clearly indicating that sucralose perturbed the fecal metabolome. A PLS-DA plot (Figure 3B) showed a separation in the molecular patterns of the two groups, and the hierarchical clustering heat map (Figure 3C) was consistent with this result. Molecular features matched with the HMDB and METLIN database were used for metabolite identification via MS/MS. We tentatively identified 66 metabolites, including quorum sensing compounds, amino acids and derivatives, lipids, fatty acids, bile acids, and nucleic acids, among others (Supplementary Table 1).
Sucralose Altered Quorum Sensing Signals
FIGURE 1 |Sucralose altered the dynamics of gut microbiome development in C57BL6/J mice. Bacterial genera exhibited different patterns over time between the control and sucralose-treated mice. *p<0.05.
Sucralose Altered Amino Acids and Derivatives
The gut microbiome is highly involved in the synthesis and regulation of amino acids. Amino acids, such as L-tryptophan, L-tyrosine, L-leucine, and L-isoleucine, as well as their derivatives (Table S1) were affected by sucralose treatment. Four compounds involved in tryptophan metabolism were identified, including L-tryptophan (Trp), quinolinic acid, kynurenic acid, and 2-aminomuconic acid, as shown in
Figure 5A. Compared with control mice, Trp, quinolinic acid, and 2-aminomuconic acid were increased by 1.71-, 5.45-, and 2.09-fold in sucralose-treated mice, while kynurenic acid was reduced by 2.45-fold in sucralose-treated mice. For tyrosine metabolism, though L-tyrosine increased (1.62-fold), two of its metabolites, p-hydroxyphenylacetic acid and cinnamic acid, decreased by 4.63- and 1.53-fold, respectively (Figure 5B).
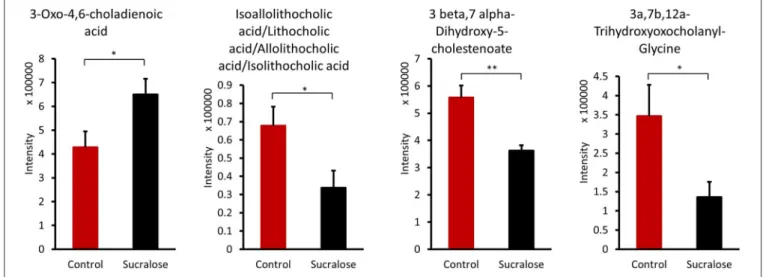
Sucralose Altered Bile Acids
The gut microbiome can transform primary hydrophilic bile acids into secondary hydrophilic bile acids in the large intestine through deconjugation, dehydroxylation, and dehydrogenation.
Bile acids not only facilitate fat and fat-soluble vitamin absorption and maintain cholesterol homeostasis but are also viewed as signaling molecules that bind to the nuclear receptor FXR and the G-protein-coupled receptor TGR5. Several bile acids were significantly different between the control and sucralose-treated animals (Figure 6). 3-Oxo-4,6-choladienoic acid was increased in sucralose-treated mice compared with control mice, while other bile acids were reduced, including 3β,7α -dihydroxy-5-cholestenoate, 3α,7β,12α-trihydroxyoxocholanyl-glycine and lithocholic acid/isoallolithocholic acid/allolithocholic acid/isolithocholic acid.
Sucralose Induced Elevated
Pro-inflammatory Gene Expression in Liver
FIGURE 2 |Enrichment of bacterial pro-inflammatory genes after 6 months of sucralose treatment (*p<0.05, **p<0.01), including genes involved in LPS(A), flagella(B), and fimbriae synthesis(C)as well as toxins(D)and multidrug resistance genes(E).
DISCUSSION
The gut microbiota is a dynamic system, and maintaining a healthy balance is vital for the host (Nicholson et al., 2012). Previous studies have demonstrated that changes to the gut microbiota affect numerous host processes, such as immune system development and energy metabolism and absorption, and can also impact diseases in and beyond the GI tract (Holmes et al., 2011). Xenobiotics in the food or environment can affect the gut microbiome and host health (Lu et al., 2014; Suez et al., 2014; Gao et al., 2017). One common argument used to support sucralose safety is that the majority of sucralose is not absorbed or metabolized in the body (Grice
and Goldsmith, 2000). However, we demonstrate here that sucralose can affect the gut microbiome, its metabolic functions and the host even though it passes through the GI tract unchanged.
FIGURE 3 |Sucralose changed the fecal metabolome, as illustrated by the Cloud plot(A), PLS-DA plot(B), and heat map(C). A total of 1,764 molecular features were significantly different (p<0.05 and fold change>1.5) between sucralose-treated mice and controls.
body. This study provides a new understanding of the effect of artificial sweeteners on the gut microbiota and host health.
Sucralose has been shown to be safe using different endpoints in previous studies, but very few studies have reported its effects on the gut microbiome and, particularly, its functions (Grotz and Munro, 2009). In this study, we examined sucralose-induced gut microbiome functional perturbation, which may contribute to the development of systemic inflammation in the host. Altering the gut bacterial composition may confer an increased risk of developing inflammation in sucralose-treated mice. For example, among the 14 changed genera, several were found to be associated with host inflammation. Ruminococcaceae Ruminococcus,
FIGURE 4 |Quorum sensing signals were altered by sucralose consumption. *p<0.05, ***p<0.001.
FIGURE 6 |Sucralose altered bile acids in the fecal samples of mice treated with sucralose for 6 months. *p<0.05, **p<0.01.
Previous studies have demonstrated that functional genes of the bacterial community are related to 16S rRNA marker genes, allowing the functional capacities of the gut microbiome to be surveyed using 16S rRNA gene sequencing (Asshauer et al., 2015). Using functional gene enrichment analysis, a number of genes related to bacterial pro-inflammatory mediators were shown to be significantly increased in the sucralose-treated gut microbiome, including genes involved in LPS synthesis, flagella protein synthesis, and fimbriae synthesis as well as bacterial toxins and drug resistance genes. LPS, flagella, and fimbriae are known PAMPs that can trigger pathological inflammation in the host, and various toxins produced by bacteria can induce toxicity in the host. LPS, a known endotoxin from the outer membrane of gram-negative bacteria, can initiate inflammatory events, such as the secretion of pro-inflammatory cytokines like interleukin-6 or tumor necrosis factor (TNF)-α(de La Serre et al., 2010). Flagella protein levels are low in a healthy gut, and high levels of flagella proteins have been shown to be associated with gut mucosal barrier breakdown and inflammation in previous studies (Cullender et al., 2013). Fimbriae play an important role in bacterial adhesion to and invasion of epithelial cells and are known virulence factors (Nakagawa, 2002). Additionally, multidrug resistance genes were increased in the sucralose-treated gut microbiome, and the increase in multidrug resistance genes and/or multidrug-resistant bacteria may lead to a more hostile gut environment (Marshall et al., 2009). These data indicate that 6 months of sucralose consumption increased the pro-inflammatory products of the gut microbiome and its ability to potentially induce systemic inflammation.
Likewise, the metabolites identified in fecal samples may be involved in regulating inflammation. For example, several amino
acids were perturbed in sucralose-treated fecal metabolites in this study. In particular, we found that tryptophan metabolism was disrupted by sucralose, and this disruption was related to changes in the expression of functional genes of the gut microbiome. As shown in Supplementary Figure 1, several genes related to tryptophan metabolism were elevated, while the abundance of tryptophan and its metabolites were altered in the fecal samples. The four metabolites identified are involved in the kynurenine pathway, which is the most important tryptophan metabolism pathway, consuming 95% of the tryptophan in the body (Keszthelyi et al., 2009). The balance between two metabolites in this pathway, quinolinic acid, and kynurenic acid, plays an important role in mediating inflammation and the excitability of cells such as enteric neurons. Quinolinic acid is pro-inflammatory and excitotoxic, whereas kynurenic acid is anti-inflammatory and neuroprotective (Keszthelyi et al., 2009). Here, we found an elevated level of quinolinic acid and a decreased level of kynurenic acid. This indicates that sucralose may shift cells to a pro-inflammatory state. Likewise, tyrosine and two of its metabolites, p-hydroxyphenylacetic acid and cinnamic acid, have previously been shown to decrease the production of reactive oxygen species (ROS) in neutrophils (Beloborodova et al., 2012), and the reduced level of these compounds in our study indicated that ROS levels may be increased in sucralose-treated mice. Bacterial antioxidative enzyme genes, such as catalase and catalase-peroxidase, which respond to ROS, were also significantly enriched in sucralose-treated mice (Supplementary Figure 2). ROS can stimulate the release of pro-inflammatory cytokines (Chapple, 1997); therefore, the decrease in the two tyrosine metabolites may contribute to the development of a pro-inflammatory state. Additionally, secondary bile acids that have
antimicrobial effects were decreased, which may allow the growth of pathogens (Begley et al., 2005).
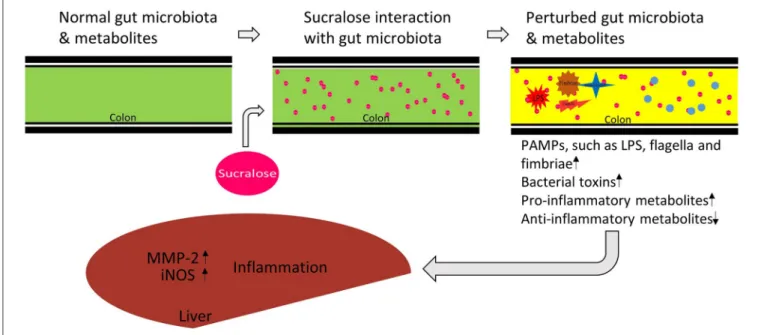
Pro-inflammatory mediators, such as LPS, and metabolites can translocate into host circulation and tissues, leading to systemic inflammatory response (de La Serre et al., 2010). In accordance with this expectation, real-time PCR results showed that MMP-2 and iNOS expression was elevated in the liver of sucralose-treated mice. MMP-2 is strongly associated with inflammatory responses, because it can cleave and activate TNF-α and IL-1β, which are both pro-inflammatory cytokines that contribute to the induction of inflammation (Medina and Radomski, 2006; Wang et al., 2006). Likewise, iNOS-derived NO regulates pro-inflammatory genes and significantly contributes to inflammatory liver injury. iNOS exerts numerous effects associated with the progression of inflammatory conditions in multiple liver diseases, such as increasing the liver inflammatory response, promoting the induction of liver tumors and contributing to liver fibrosis caused by a chronic viral infection (Sass et al., 2001; La Mura et al., 2014). The expression of both MMP-2 and iNOS was found to be increased in the liver of sucralose-treated mice compared with control mice, indicating that sucralose exposure increases the risk of developing inflammation in the liver. Notably, most of the sucralose consumed passes through the GI tract unabsorbed and unchanged (Roberts et al., 2000); therefore, the inflammatory response observed in the liver was unlikely to be stimulated by sucralose directly.
Taken together, as illustrated in Figure 8, our data show that 6-month sucralose consumption at human ADI alters the gut microbiome and its functions in mice. In particular, the enrichment of gut microbial pro-inflammatory genes and fecal metabolites suggests that sucralose alters the gut environment to release more pro-inflammatory mediators and alter functional metabolites, which may contribute to the increased expression of pro-inflammatory markers in the liver, such as iNOS and MMP-2. Notably, while the majority of ingested sucralose passes through the GI tract unabsorbed, it does disrupt the gut microbiota and its functions; therefore, our results highlight the role of sucralose-gut microbiome interaction in regulating host health-related processes, such as chronic inflammation.
There are a few limitations associated with this study. First, we only assessed inflammatory response in the liver of sucralose-treated mice by RT-PCR. Examination of host response using other endpoints and methods, such as circulating LPS and histological assessment, in related samples and tissues would be needed to better characterize the effects of sucralose in the body. Second, we conducted experiments using a single dose of sucralose at the human ADI, while human intake of sucralose is typically lower than this concentration. Our ongoing study using multiple human-relevant doses aims at better understanding time- and dose-dependent effects of sucralose on the gut microbiome and host. Third, the enrichment analysis of functional bacterial genes was performed based on the 16S rRNA sequencing data. Metagenomic shotgun sequencing and/or metatranscriptomics will further shed light on sucralose-induced functional perturbation of the gut microbiome. Finally, the identification of altered metabolites was based on the matching with the metabolite database. Future validation of key metabolites of interest with authentic compounds is warranted. Likewise, a more accurate quantitative analysis of altered metabolites using stable isotope labeled standards should be conducted.
AUTHOR CONTRIBUTIONS
XB, HR, and KL designed the study. XB, BG, LC, and PT acquired, analyzed and interpreted the data. XB, PT, HR, and KL drafted and critically revised the manuscript, approved the version to be published, and are accountable for all aspects of the work.
FUNDING
This research was partially supported by the University of Georgia, University of North Carolina at Chapel Hill and NIH/NIEHS (R01ES024950).
SUPPLEMENTARY MATERIAL
The Supplementary Material for this article can be found online at: http://journal.frontiersin.org/article/10.3389/fphys. 2017.00487/full#supplementary-material
REFERENCES
Abou-Donia, M. B., El-Masry, E. M., Abdel-Rahman, A. A., McLendon, R. E., and Schiffman, S. S. (2008). Splenda alters gut microflora and increases intestinal p-glycoprotein and cytochrome p-450 in male rats.J. Toxicol. Environ. Health A71, 1415–1429. doi: 10.1080/15287390802328630
Asshauer, K. P., Wemheuer, B., Daniel, R., and Meinicke, P. (2015). Tax4Fun: predicting functional profiles from metagenomic 16S rRNA data.Bioinformatics31, 2882–2884. doi: 10.1093/bioinformatics/btv287 Bainton, N. J., Stead, P., Chhabra, S. R., Bycroft, B. W., Salmond, G. P.,
Stewart, G. S., et al. (1992). N-(3-oxohexanoyl)-L-homoserine lactone regulates carbapenem antibiotic production in Erwinia carotovora. Biochem. J. 288, 997–1004. doi: 10.1042/bj2880997
Begley, M., Gahan, C. G., and Hill, C. (2005). The interaction between bacteria and bile.FEMS Microbiol. Rev.29, 625–651. doi: 10.1016/j.femsre.2004.09.003 Beloborodova, N., Bairamov, I., Olenin, A., Shubina, V., Teplova, V., and
Fedotcheva, N. (2012). Effect of phenolic acids of microbial origin on production of reactive oxygen species in mitochondria and neutrophils.J. Biomed. Sci.19:89. doi: 10.1186/1423-0127-19-89
Brusick, D., Borzelleca, J. F., Gallo, M., Williams, G., Kille, J., Wallace Hayes, A., et al. (2009). Expert panel report on a study of splenda in male rats.Regul. Toxicol. Pharmacol.55, 6–12. doi: 10.1016/j.yrtph.2009.06.013
Chapple, I. L. C. (1997). Reactive oxygen species and antioxidants in inflammatory diseases.J. Clin. Periodontol.24, 287–296.
Collins, J. W., Chervaux, C., Raymond, B., Derrien, M., Brazeilles, R., Kosta, A., et al. (2014). Fermented dairy products modulate citrobacter rodentium-induced colonic hyperplasia. J. Infect. Dis. 210, 1029–1041. doi: 10.1093/infdis/jiu205
Cullender, T. C., Chassaing, B., Janzon, A., Kumar, K., Muller, C. E., Werner, J. J., et al. (2013). Innate and adaptive immunity interact to quench microbiome flagellar motility in the gut. Cell Host Microbe14, 571–581. doi: 10.1016/j.chom.2013.10.009
de La Serre, C. B., Ellis, C. L., Lee, J., Hartman, A. L., Rutledge, J. C., and Raybould, H. E. (2010). Propensity to high-fat diet-induced obesity in rats is associated with changes in the gut microbiota and gut inflammation.Am. J. Physiol. Gastrointest. Liver Physiol.299, G440–G448. doi: 10.1152/ajpgi.00098.2010 Devkota, S., Wang, Y., Musch, M. W., Leone, V., Fehlner-Peach, H.,
Nadimpalli, A., et al. (2012). Dietary-fat-induced taurocholic acid promotes pathobiont expansion and colitis in II10−/− mice. Nature 487, 104–108.
doi: 10.1038/nature11225
Fernández, J., Redondo-Blanco, S., Gutiérrez-del-Río, I., Miguélez, E. M., Villar, C. J., and Lombó, F. (2016). Colon microbiota fermentation of dietary prebiotics towards short-chain fatty acids and their roles as anti-inflammatory and antitumour agents: a review.J. Funct. Foods25, 511–522. doi: 10.1016/j.jff.2016.06.032
Furet, J. P., Kong, L. C., Tap, J., Poitou, C., Basdevant, A., Bouillot, J. L., et al. (2010). Differential adaptation of human gut microbiota to bariatric surgery-induced weight loss: links with metabolic and low-grade inflammation markers.
Diabetes59, 3049–3057. doi: 10.2337/db10-0253
Gao, B., Bian, X., Mahbub, R., and Lu, K. (2017). Sex-specific effects of organophosphate diazinon on the gut microbiome and its metabolic functions.
Environ. Health Perspect.125, 198–206. doi: 10.1289/EHP202
Gardner, C., Wylie-Rosett, J., Gidding, S. S., Steffen, L. M., Johnson, R. K., Reader, D., et al. (2012). Nonnutritive sweeteners: current use and health perspectives: a scientific statement from the American heart association and the american diabetes association.Diabetes Care35, 1798–1808. doi: 10.2337/dc12-9002 Grice, H. C., and Goldsmith, L. A. (2000). Sucralose—an overview of the toxicity
data.Food Chem. Toxicol.38, S1–S6. doi: 10.1016/S0278-6915(00)00023-5 Grotz, V. L., and Munro, I. C. (2009). An overview of the safety of sucralose.Regul.
Toxicol. Pharmacol.55, 1–5. doi: 10.1016/j.yrtph.2009.05.011
Hill, D. A., and Artis, D. (2010). Intestinal bacteria and the regulation of immune cell homeostasis. Annu. Rev. Immunol. 28, 623–667. doi: 10.1146/annurev-immunol-030409-101330
Holmes, E., Li, J. V., Athanasiou, T., Ashrafian, H., and Nicholson, J. K. (2011). Understanding the role of gut microbiome-host metabolic signal disruption in health and disease. Trends Microbiol. 19, 349–359. doi: 10.1016/j.tim.2011.05.006
Kamada, N., Seo, S. U., Chen, G. Y., and Nunez, G. (2013). Role of the gut microbiota in immunity and inflammatory disease.Nat. Rev. Immunol.13, 321–335. doi: 10.1038/nri3430
Keszthelyi, D., Troost, F. J., and Masclee, A. A. (2009). Understanding the role of tryptophan and serotonin metabolism in gastrointestinal function. Neurogastroenterol. Motil. 2, 1239–1249. doi: 10.1111/j.1365-2982.2009.01370.x
Kim, I. Y., Jung, J., Jang, M., Ahn, Y. G., Shin, J. H., Choi, J. W., et al. (2010). 1H NMR-based metabolomic study on resistance to diet-induced obesity in AHNAK knock-out mice. Biochem. Biophys. Res. Commun.403, 428–434. doi: 10.1016/j.bbrc.2010.11.048
Lade, H., Paul, D., and Kweon, J. H. (2014). N-acyl homoserine lactone-mediated quorum sensing with special reference to use of quorum quenching bacteria in membrane biofouling control. Biomed. Res. Int. 2014:162584. doi: 10.1155/2014/162584
La Mura, V., Pasarin, M., Rodriguez-Vilarrupla, A., Garcia-Pagan, J. C., Bosch, J., and Abraldes, J. G. (2014). Liver sinusoidal endothelial dysfunction after LPS administration: a role for inducible-nitric oxide synthase.J. Hepatol.61, 1321–1327. doi: 10.1016/j.jhep.2014.07.014
Ley, R. E., Peterson, D. A., and Gordon, J. I. (2006). Ecological and evolutionary forces shaping microbial diversity in the human intestine.Cell124, 837–848. doi: 10.1016/j.cell.2006.02.017
Lu, K., Abo, R. P., Schlieper, K. A., Graffam, M. E., Levine, S., Wishnok, J. S., et al. (2014). Arsenic exposure perturbs the gut microbiome and its metabolic profile in mice: an integrated metagenomics and metabolomics analysis.Environ. Health Perspect.122, 284–291. doi: 10.1289/ehp.1307429
Lu, K., Knutson, C. G., Wishnok, J. S., Fox, J. G., and Tannenbaum, S. R. (2012). Serum metabolomics in a Helicobacter hepaticus mouse model of inflammatory bowel disease reveal important changes in the microbiome, serum peptides, and intermediary metabolism.J. Proteome Res.11, 4916–4926. doi: 10.1021/pr300429x
Maloy, K. J., and Powrie, F. (2011). Intestinal homeostasis and its breakdown in inflammatory bowel disease.Nature474, 298–306. doi: 10.1038/nature10208 Marshall, B. M., and Ochieng, D. J., Levy, S. B. (2009). Commensals:
underappreciated reservoir of antibiotic resistance. Microbe 4, 231–238. doi: 10.1128/microbe.4.231.1
Medina, C., and Radomski, M. W. (2006). Role of matrix metalloproteinases in intestinal inflammation. J. Pharmacol. Exp. Ther. 318, 933–938. doi: 10.1124/jpet.106.103465
Munyaka, P. M., Rabbi, M. F., Khafipour, E., and Ghia, J. E. (2016). Acute dextran sulfate sodium (DSS)-induced colitis promotes gut microbial dysbiosis in mice.
J. Basic Microbiol.56, 986–998. doi: 10.1002/jobm.201500726
Nakagawa, I. (2002). Functional differences among fima variants of porphyromonas gingivalis and their effects on adhesion to and invasion of human epithelial cells. Infect. Immun. 70, 277–285. doi: 10.1128/IAI.70.1.277-285.2002
Nicholson, J. K., Holmes, E., Kinross, J., Burcelin, R., Gibson, G., Jia, W., et al. (2012). Host-gut microbiota metabolic interactions.Science3366, 1262–1267. doi: 10.1126/science.1223813
Omran, A., Ahearn, G., Bowers, D., Swenson, J., and Coughlin, C. (2013). Metabolic effects of sucralose on environmental bacteria. J. Toxicol.
2013:372986. doi: 10.1155/2013/372986
Parks, D. H., Tyson, G. W., Hugenholtz, P., and Beiko, R. G. (2014). STAMP: statistical analysis of taxonomic and functional profiles.Bioinformatics30, 3123–3124. doi: 10.1093/bioinformatics/btu494
Passador, L., Tucker, K. D., Guertin, K. R., Journet, M. P., Kende, A. S., and Iglewski, B. H. (1996). Functional analysis of the Pseudomonas aeruginosa autoinducer PAI. J. Bacteriol. 178, 5995–6000. doi: 10.1128/jb.178.20.5995-6000.1996
Qin, J., Li, R., Raes, J., Arumugam, M., Burgdorf, K. S., Manichanh, C., et al. (2010). A human gut microbial gene catalogue established by metagenomic sequencing.Nature464, 59–65. doi: 10.1038/nature08821
Ridaura, V. K., Faith, J. J., Rey, F. E., Cheng, J., Duncan, A. E., Kau, A. L., et al. (2013). Gut microbiota from twins discordant for obesity modulate metabolism in mice.Science341:1241214. doi: 10.1126/science.1241214
Roberts, A., Renwick, A. G., Sims, J., and Snodin, D. J. (2000). Sucralose metabolism and pharmacokinetics in man.Food Chem. Toxicol.38, 31–41. doi: 10.1016/S0278-6915(00)00026-0
Sass, G., Koerber, K., Bang, R., Guehring, H., and Tiegs, G. (2001). Inducible nitric oxide synthase is critical for immune-mediated liver injury in mice.J. Clin. Invest.107, 439–447. doi: 10.1172/JCI10613
Stankowska, D., Kwinkowski, M., and Kaca, W. (2008). Quantification of proteus mirabilis virulence factors and modulation by acylated homoserine lactones.
J. Microbiol. Immunol. Infect.41, 243–253. Avilable online at: http://www.ejmii. com/issue_abstract.php?code=PDT4b0d2267aca1b
Suez, J., Korem, T., Zeevi, D., Zilberman-Schapira, G., Thaiss, C. A., Maza, O., et al. (2014). Artificial sweeteners induce glucose intolerance by altering the gut microbiota.Nature514, 181–186. doi: 10.1038/nature13793
Sylvetsky, A. C., Welsh, J. A., Brown, R. J., and Vos, M. B. (2012). Low-calorie sweetener consumption is increasing in the United States.Am. J. Clin. Nutr.96, 640–646. doi: 10.3945/ajcn.112.034751
Tremaroli, V., and Backhed, F. (2012). Functional interactions between the gut microbiota and host metabolism. Nature 489, 242–249. doi: 10.1038/nature11552
Turnbaugh, P. J., Ley, R. E., Mahowald, M. A., Magrini, V., Mardis, E. R., and Gordon, J. I. (2006). An obesity-associated gut microbiome with increased capacity for energy harvest.Nature444, 1027–1031. doi: 10.1038/nature05414 Uronis, J. M., Muhlbauer, M., Herfarth, H. H., Rubinas, T. C., Jones,
alters colitis-associated colorectal cancer susceptibility.PLoS ONE4:e6026. doi: 10.1371/journal.pone.0006026
Wang, L., Zhang, Z. G., Zhang, R. L., Gregg, S. R., Hozeska-Solgot, A., LeTourneau, Y., et al. (2006). Matrix metalloproteinase 2 (MMP2) and MMP9 secreted by erythropoietin-activated endothelial cells promote neural progenitor cell migration.J. Neurosci.26, 5996–6003. doi: 10.1523/JNEUROSCI.5380-05.2006 Wang, Z., Klipfell, E., Bennett, B. J., Koeth, R., Levison, B. S., Dugar, B., et al. (2011). Gut flora metabolism of phosphatidylcholine promotes cardiovascular disease.
Nature472, 57–63. doi: 10.1038/nature09922
Willing, B. P., Dicksved, J., Halfvarson, J., Andersson, A. F., Lucio, M., Zheng, Z., et al. (2010). A pyrosequencing study in twins shows that gastrointestinal microbial profiles vary with inflammatory bowel disease phenotypes.
Gastroenterology139, 1844–1854. doi: 10.1053/j.gastro.2010.08.049
Winson, M. K., Camara, M., Latifi, A., Foglino, M., Chhabra, S. R., Daykin, M., et al. (1995). Multiple N-acyl-L-homoserine lactone signal molecules regulate production of virulence determinants and secondary metabolites
in Pseudomonas aeruginosa.Proc. Natl. Acad. Sci. U.S.A. 92, 9427–9431. doi: 10.1073/pnas.92.20.9427
Xavier, R. J., and Podolsky, D. K. (2007). Unravelling the pathogenesis of inflammatory bowel disease.Nature 448, 427–434. doi: 10.1038/nature 06005
Conflict of Interest Statement: The authors declare that the research was conducted in the absence of any commercial or financial relationships that could be construed as a potential conflict of interest.