EXAMINATION OF THE ADVERSE EFFECTS OF GASEOUS AND PARTICULATE OXIDANT AIR POLLUTANTS IN HUMAN AIRWAY EPITHELIAL CELLS
Eugene A. Gibbs II - Flournoy
A dissertation submitted to the faculty of the University of North Carolina at Chapel Hill in partial fulfillment of the requirements for the degree of Doctor of Philosophy in
the Curriculum in Toxicology.
Chapel Hill 2012
Approved By:
James M. Samet, PhD Lee M. Graves, PhD
ii
Abstract
EUGENE A. GIBBS-FLOURNOY: Examination of the Adverse Effects of Exposure to Gaseous and Particulate Oxidant Air Pollutants in Human Airway Epithelial Cells
(Under the direction of Dr. James M. Samet)
iii
iv
Acknowledgments
First and foremost, all that I do in life is only achievable through the grace of GOD , and the completion of this dissertation is merely one example of many, for which I am truly thankful. Additionally, the support of my family throughout my personal and professional endeavors has been vital to all of the successes that I have achieved. I would like to thank my wonderful wife, Katoria Gibbs, for her encouragement and companionship as both my friend and my colleague. Similarly, I must thank my parents, Carolyn P. Flournoy and Eugene A. Gibbs, for providing me with the fundamental tools needed to overcome life’s challenges as well as instilling the importance of education.
v
appreciative of my clinical co-mentor, Dr. Philip Bromberg, for his participation in my graduate project as well as our personal interactions .
vi
Table of Contents
Abstract ...ii
Acknowledgments ...iv
List of Figures...x
List of Abbreviations ...xii
Chapter 1. Introduction ...1
1.1 Air Pollution and Human Health...1
1.2 Particulate Matter (PM) ...4
1.3 Ozone...7
1.4 Air Pollution and the Lung...9
1.5 Air Pollutants, Oxidative Stress, and Inflammation...13
1.6 The Importance of Glutathione ...19
1.7 Assessing Oxidative Stress and Associated Challenges ...22
1.8 Live-Cell Imaging With Genetically-Encoded Fluorescent Reporters of Cellular Redox ...25
1.8.1 roGFP ...27
1.8.2 HyPer ...30
vii
Chapter 2. Darkfield-Confocal Microscopy detection of nanoscale particle
internalization by human lung cells ...34
2.1 Introduction...34
2.2 Methods ...38
2.2.1 Materials and Reagents ...38
2.2.2 Specimen Preparation...38
2.2.3 Cell Culture and Exposure ...39
2.2.4 Cell Fixation, Staining, and Mounting ...40
2.2.5 Confocal Microscopy Quality Assurance (QA) ...41
2.2.6 Simultaneous DF and CLSM ...41
2.2.7 Statistical Analyses...46
2.3 Results ...47
2.3.1 DF-CLSM detection of nanoscale particles ...47
2.3.2 Examination of in vitro particle internalization using DF-CLSM ....52
2.4 Discussion ...58
2.5 Conclusions...62
Chapter 3. Monitoring Intracellular Redox Changes in Airway Epithelial Cells Exposed to Ozone...63
3.1 Introduction...63
3.2 Methods ...68
3.2.1 Materials and Reagents ...68
3.2.2 Cell Culture ...68
3.2.3 Genetically Encoded Redox Sensors ...69
3.2.4 Plasmid Transfection and Lentiviral Transduction...69
viii
3.2.6 Imaging Analysis ...72
3.2.7 Measurement of Intracellular NADPH ...73
3.2.8 Statistical Analysis ...73
3.3 Results ...74
3.3.1 Ozone exposure induces an increase in the cytosolic glutathione redox potential ...74
3.3.2 Glucose deprivation potentiates the elevation of EGSH induced by ozone exposure ...76
3.3.3 Validation of glutathione-dependent roGFP2 responses to ozone exposure...79
3.3.4 Investigating the role of secondary products in ozone-induced redox changes ...85
3.4 Discussion ...88
3.5 Conclusion...93
Chapter 4. Examination of Factors Affecting Ozone-Induced Oxidative Stress ...94
4.1 Introduction...94
4.2 Methods ...97
4.2.1 Materials and Reagents ...97
4.2.2 Cell Culture ...97
4.2.3 Genetically Encoded Redox Sensors ...98
4.2.4 Lentiviral Transduction ...98
4.2.5 Fluorescent Detection of Ozone ...98
4.2.6 Exposure Conditions ...99
4.2.7 Imaging Analysis ...100
4.2.8 Statistical Analysis ...101
ix
4.3.1 PG-1 fluorescence increases during O3 exposure despite the
presence of catalase ...102
4.3.2 VSL1 detects intracellular ozone...104
4.3.3 Extracellular antioxidants impair VSL1 responses to O3 ...106
4.3.4 Extracellular antioxidants decrease O3-induced changes in the cytosolic glutathione redox potential ...109
4.4 Discussion ...111
4.5 Conclusion...115
Chapter 5. Overall Conclusions and Significance ...116
x
List of Figures
Figure 1.5.1 Oxidative Stress and outcomes related. ... 16 Figure 1.8.1.1 roGFP structure and function. ... 28 Figure 2.2.6.1 Schematic diagram of an inverted confocal system equipped for
simultaneous fluorescence and darkfield imaging. ... 43 Figure 2.3.1.1 Detection of fluorescent polystyrene spheres by co-localized
confocal and darkfield microscopy. ... 48 Figure 2.3.1.2 Darkfield(DF)/Confocal(CLSM) imaging of TiO2 nano particles
internalized by human bronchial epithelial cells. ... 51 Figure 2.3.2.1 Image galleries of BEAS cells exposed to nanoparticles for 5 and
120 min. ... 53 Figure 2.3.2.2 Determination of nanoparticle location using the maximum intensity
technique. ... 55 Figure 2.3.2.3 Statistical analysis of mean particle location in cells exposed to
27 nm TiO2 for varying lengths of time. ... 57 Figure 3.1.1 roGFP2 interactions with the glutathione system. ... 66 Figure 3.2.5 Stage-top ozone exposure system. ... 71 Figure 3.3.1 Exposure to O3 induces a dose- and time-dependent increase in the
cytosolic glutathione redox potential in airway epithelial cells. ... 75 Figure 3.3.2.1 Glucose deprivation sensitizes cells to O3-induced roGFP2
oxidation. ... 77 Figure 3.3.2.2 Determination of NADPH levels. ... 78 Figure 3.3.3.1 Determination of intracellular glutathione. ... 80 Figure 3.3.3.2 Manipulation of the glutathione system modulates roGFP2
responses to ozone... 83 Figure 3.3.3.3 Selenium-induced GPx1 overexpression. ... 84 Figure 3.3.4.1 Comparison between roGFP2 and HyPer responses to O3. ... 86 Figure 3.3.4.2. O3-induced EGSH changes affects the cytosol more rapidly than
xi
Figure 4.3.2 VSL1 detection of intracellular O3. ... 105 Figure 4.3.3 Extracellular antioxidants impair the intracellular and extracellular
detection of O3 by VSL1. ... 108 Figure 4.3.4 Extracellular antioxidants blunt O3-induced increases in cytosolic
glutathione redox potential... 110 Figure 5.1 Mechanisms of particle-mediated ROS production. ... 120 Figure 5.2 Time course of acute human responses to environmentally-relevant
xii
List of Abbreviations
2-AAPA 2-acetylamino-3-[4-(2-acetylamino-2- carboxyethyl sulfanylthiocarbonylamino)phenylthiocarbamoylsulfanyl] propionic acid
AH2 Ascorbic Acid
ALI Air-Liquid Interface AP-1 Activator Protein-1 AQI Air Quality Index
ARE Antioxidant Response Element BSO Buthionine Sulfoximine
CAA Clean Air Act
CLSM Confocal Laser Scanning Microscopy
CMB Cell Mask Blue
CO Carbon Monoxide
COPD Chronic Obstructive Pulmonary Disease
cpYFP circularly permuted Yellow Fluorescence Protein DAPI 4',6-diamidino-2-phenylindole
DEP Diesel Exhaust Particles
DF Darkfield
dH2O Deioninzed Water DTT Dithiothreitol
xiii
EGFR Epidermal Growth Factor Receptor EGSH Glutathione Redox Potential
ELF Epithelial Lining Fluid EM Electron Microscopy
EPA Environmental Protection Agency EpRE Electrophile Response Element
FEV1 Forced Expiratory Volume in 1 second FVC Forced Vital Capacity
G6PD Glucose-6-Phosphate Dehydrogenase γ-GCL gamma-Glutamyl Cysteine Ligase γ-GCS gamma-Glutamyl Cysteine Synthetase GFP Green Fluorescence Protein
GPx Glutathione Peroxidase GR Glutathione Reductase
Grx Glutaredoxin
GSH Reduced Glutathione GSSG Oxidized Glutathione GST Glutathione-S-Transferase HAEC Human Airway Epithelial Cells
HO-1 Hemeoxygenase-1
Hr Hour
xiv
Keap-1 Kelch-like ECH Associating Protein-1 KGM Keratinocyte Growth Medium
LOOH Lipid Peroxides
LOPs Lipid Ozonation Products LS+G Locke Solution with Glucose LS-G Locke Solution without Glucose MAPK Mitogen-Activate Protein Kinases MOI Multiplicity of Infection
NAAQS National Ambient Air Quality Standards NADH Nicotinamide Adenine Dinucleotide
NADPH Nicotinamide Adenine Dinucleotide Phosphate NF-kB Nuclear Factor-kappa B
NHBE Normal Human Bronchial Epithelial Cells NO2 Nitrogen dioxide
NOX Nitrogen oxides
NP Nanoparticles
NQO1 Nicotinamide Adenine Dinucleotide Phosphate:Quinone Oxidoreductase-1
Nrf2 Nuclear Factor Erythroid 2-Related Factor 2
O3 Ozone
pCat pegylated Catalase
PF Paraformaldehyde
xv PM Particulate Matter PMT Photomultiplier Tube
PPP Pentose Phosphate Pathway PSSG Protein mixed disulfides
QA Quality Assurance
RD Regulatory Domain
RNS Reactive Nitrogen Species
roGFP redox-sensitive Green Fluorescence Protein roGFP-cyto Cytosolically-targeted Redox Sensitive Green
Fluorescence Protein
roGFP-mito Mitochondrially-targeted Redox Sensitive Green Fluorescence Protein
ROI Region of Interest
ROS Reactive Oxygen Species
Sec Seconds
SO2 Sulfur dioxide
α-T alpha-Tocopherol
TD Transmission Detector
TNF-α Tumor Necrosis Factor-alpha
TRPA1 Transient Receptor Potential Ankyrin 1
UA Uric Acid
UFP Ultrafine Particles
xvi VOC Volatile Organic Compound
Chapter 1
Introduction
1.1 Air Pollution and Human Health
Ambient air pollution is a common problem that afflicts human populations in the industrialized world, which persists despite active local, regional, national, and global regulatory efforts. In the United States, as of 2010, it has been estimated that approximately 124 million Americans live in areas that exceed current standards both established and regulated by the Environmental Protection Agency (EPA) (EPA 2012). While this statistic has decreased by ~22% since the previous 2007 estimate of 158.5 million, these values indicate that a large portion of the population remains exposed to unhealthy levels of air pollution. Moreover, towards the end of the 20th century, air pollution became recognized as a global public health problem with other countries reporting similar estimations of exposure (Ciencewicki et al. 2008; Maynard and Howard, 1999; WHO, 2006).
2
Fog in Belgium, the 1948 Smog of Donora Pennsylvania, and the 1952 “Great Fog” of London (Stanek et al., 2011; Simkhovich et al., 2008; Nemery et al., 2001; Helfand et al. 2001; and Scott, 1953). In each situation, stagnant atmospheric conditions made it favorable for combustion emissions to become trapped, causing marked increases in the localized concentration of air pollutants in and around these urban environments (Stanek et al., 2011). Furthermore, several statistical analyses have revealed direct temporal correlations between the incidence of such acute elevations in air pollution and the number of local hospitalizations and deaths (Simkhovich et al., 2008; Yang and Omaye, 2009; and Stanek et al., 2011). All these findings, combined with ongoing research, have prompted efforts to increase public awareness of the harmful effects of air pollutant exposure.
3
to the effects of air pollution; these include age (children and older adults), underlying disease burden of the pulmonary and cardiovascular systems, diabetes, pregnancy, and genetic polymorphism (American Lung Association, 2012; Bolton et al., 2012; Ciencewicki et al., 2008; Kampa and Castana, 2007; Shannahan et al., 2010; Curtis et al., 2006; Laumbach 2010). These factors, combined with the known health implications resultant from exposure to air pollution, have emphasized the need for environmental quality standards used to limit the amount of common air pollutants released to the environment.
4
1.2 Particulate Matter (PM)
By definition, PM is the suspension of solid particles or liquid droplets in the ambient air (Ciencewicki et al., 2008). PM varies broadly in its size and composition with organic and inorganic materials contributing to its overall make-up. Examples of PM range from natural dusts to mold spores to combustion and industrially-derived particulates of anthropogenic origin. Currently, PM is separated into 3 categories by size based on the aerodynamic diameter of its particles: 1) “coarse” particles, PM10, 2.5 – 10 µm in diameter; 2) “fine” particles, PM2.5, ≤ 2.5 µm in diameter; and 3) “ultrafine” particles (UFP), PM0.1, particles with diameters ≤ 0.1 µm. Of these 3 categories, the EPA regulates ambient PM2.5 and PM10 at 35 µg/m3 and 150 µg/m3, respectively, not to be exceeded within a 24 hr averaged basis (EPA 2012).
5
and heavy metals, combustion-derived elemental and organic carbon, nitrates, and sulfates. The resulting particles expand in size by: 1) coagulating with other nuclei to form a larger aggregated particle, and/or 2) having gas or vapors of organic molecules condensed onto their surface, which increases their overall diameter (WHO, 2003). It is important to note that combinations of these components and events often drive the creation of particles, thus contributing to the broad array of ambient PM in relation to size, number, and composition. This process generates particles capable of absorbing and transferring many materials that are toxicologically relevant, such as metals, organic hydrocarbons, reactive gases, and ions, which are all often packaged around a stable carbon core (Mossman et al., 2007; Kampa and Castana, 2007). Ultimately, the overall composition, size, number, and surface reactivity of these particles play a role in the adverse health effects caused by PM.
6
2005; Stanek et al., 2011). The latter is of particular concern since particles reaching vascular alveolar regions may be capable of releasing soluble components which can easily access blood vessels for systemic circulation (Yang and Omaye, 2009). Furthermore, depending on the particle size, as well as other physiochemical properties, it is believed that nano-scaled particles are capable of transcending cellular membranes, gaining access to intracellular compartments and even continuing on to extrapulmonary cells, tissues, and organs (Geiser et al., 2005; Oberdorster et al., 2005; Oberdorster and Utell; 2002; Terzano et al., 2010; Nakane, 2012). While most air pollution research regarding the health effects of PM exposure has focused on the larger PM10 and PM2.5 size fractions, a less exhaustive portfolio of studies has actually examined the toxicological implications of ultrafine PM exposure.
7
direct and indirect routes of human exposure in ambient and occupational settings. Recent estimates of ambient mineral PM place the global burden at greater than 14 megatons, with nano-scaled particles accounting for more than 90% of the PM abundance while contributing minimally to the overall mass (Murr and Garza, 2009; Stanek et al., 2011). Additionally, the global proliferation of nanotechnology has produced more than 600 products that annually require metric tons of raw nanomaterials, which likely get released into the environment via pre- and post-consumer utilization (Jones and Grainger, 2009; Xia et al., 2009). As a matter of practice, ambient PM in the “nano” range is classified as UFP while nanomaterials that are intentionally engineered and synthesized by industry are more commonly known as nanoparticles. In either situation, the term “nano” is applied to particles with at least one dimension at or below 100 nm. For the purpose of this dissertation, the term nanoparticle (NP) will be used to describe all nano-scaled materials regardless of origin.
1.3 Ozone
8
tropospherically produced via an intricate series of photochemical reactions involving volatile organic compounds (VOCs) and nitrogen oxides (NOx) that are catalytically activated by sunlight at wavelengths between 295 - 430 nm (Mudway and Kelly, 2000; and Ciencewicki et al., 2008). Interestingly, O3 is not directly produced in significant quantities by any anthropogenic source (Mudway and Kelly, 2000). Although created in insignificant amounts by electrostatic means including lightning strikes and the inadvertent emissions of electronic devices, ground-level ozone is largely derived from precursor products, namely VOCs and NOx, of mobile and stationary combustion sources (Katsouyanni, 2003; Curtis et al., 2006; and Kampa and Castanas 2007).
Currently, the EPA limits ambient O3 concentrations to 75 ppb, averaged over an 8 hr exposure period. This was recently lowered from the previous standard of 80 ppb, and remains under evaluation for future changes. It appears as though O3 has a narrow exposure window in relation to levels of tolerance versus concentrations at which adverse effects have been observed. Estimates put natural baseline concentrations of tropospheric O3 to vary between 20 – 40 ppb, which is very close to the 60 ppb concentration used during controlled “low dose” exposures that were observed to cause decrement in lung function and increases in pulmonary inflammation in human studies (Kim et al., 2011; Mudway and Kelly, 2000).
9
al., 2010). In humans, O3 has been demonstrated to cause decrements in the forced expiratory volume over 1 second (FEV1), forced vital capacity (FVC), alteration of breathing patterns, increases in airway responsiveness, allergen sensitization, neutrophillic influx, increases in proinflammatory cytokines and prostaglandins, and direct oxidation of cellular and extracellular biomolecules (Stanek et al., 2010; Mudway and Kelly, 2000). While these outcomes have been directly attributed to O3 exposure, the underlying mechanism driving these endpoints is not fully understood. Due to its potent oxidative properties, O3 is capable of easily oxidizing important biomolecules causing generation of secondary oxidants and free radicals as well as extensive damage to cellular components. For this reason, oxidative stress has been often implicated as the primary means by which O3 causes adverse cellular, tissue, and systemic effects.
1.4 Air Pollution and the Lung
10
system of physiological defenses inherent to that organ (Olivieri and Scoditti, 2005; Newhouse et al., 1976)
There are both chemical and mechanical elements at work in defending against air pollutants. The pulmonary system is lined by an epithelium which acts as a protective barrier to exogenous materials. Moreover, this epithelium is protected by a fluid layer that lines the respiratory tract and serves to both neutralize soluble components and trap insoluble components for their successive degradation and/or removal. This epithelial lining fluid (ELF) consists of 2 component layers: 1) an upper layer comprised of mucous, and 2) a lower aqueous layer containing biologically active small molecules, proteins, and ions (Mudway and Kelly, 2000).
The ELF is a highly important protective barrier that impedes the interaction of xenobiotics with the underlying epithelium. In fact, the ELF is the first and primary barrier encountered by air pollutants as they enter the pulmonary system. The upper, gel-like, mucous layer of the ELF floats above the lower aqueous layer, and is continuously moving in an upward direction within the respiratory tract via the action of epithelial cilia in a mechanism known as mucociliary clearance (Nicod, 2005; Samet and Cheng, 2004). Mucociliary clearance aids in protecting the pulmonary system by removing insoluble and biologically active components, such as PM, bacteria, and molds, that become trapped in the mucous as air is inhaled.
11
presence of key “antioxidant” compounds, including relatively high levels of reduced glutathione, urate, ascorbate (vitamin C), and α-tocopherol (vitamin E), which have been demonstrated to be protective against various adverse effects of air pollutants (Mudway and Kelly, 2000; Ciencewicki et al., 2008). The presence of antioxidants is especially helpful since it is believed that oxidative stress is a key feature in the mechanism of action for many inhaled xenobiotics, including O3.
As an additional defense, the lungs also have a robust immune and inflammatory response to exogenous insult. This is especially critical for the lower airways and alveolar regions since the ELF is generally thickest at the tracheal end and thins progressively toward the alveoli (Nicod, 2005; Patton, 1996). In the alveoli, immune cells, such as macrophages, provide additional protection against inhaled microorganisms and PM (Maynard and Howard, 1999). Upon activation, macrophages act quickly to destroy and/or remove potential pathogens. This is accomplished through several mechanisms including direct oxidative attack, phagocytosis, and cytokine/chemokine-mediated inflammatory response (Lohmann-Matthes et al, 1994). Macrophages that have engulfed particles and microorganisms can be removed by the mucociliary escalator, or by migrating to local lymph nodes for organized immune destruction.
12
pollutant exposure. This is especially true since the lung epithelium is the first cellular barrier reached once exogenous materials make it past primary defenses in the ELF, mucociliary clearance, and/or local immune cells. Respiratory epithelial cells are equipped to resist the adverse effects of air pollutants. These cells have been reported to have millimolar concentrations of reduced glutathione (GSH) as well as robust expression of key protective enzymes including glutathione peroxidases, glutathione-s-transferases, glutathione reductase, catalase, superoxide dismutase, hemeoxygenase 1, and γ-glutamyl cysteine synthetase to name a few (Rubio et al., 2010; Kelly 2003). All of which are capable of being upregulated via activation of the Nrf2 pathway and the antioxidant response element (ARE) (Lewis et al, 2010).
13
proven to be just as useful, but limitations regarding the number of passages that these cells can be carried can discourage their use. Given these limitations, in 1988, a group at the National Cancer Institute reported the stable transformation of human bronchial epithelial cells using an SV-40 adenoviral transduction (Reddel et al., 1988). The resulting immortalized cell line, BEAS-2B, was characterized and found to have retained common features of the normal human bronchial epithelial cells (NHBE) from which they were created. Since then, BEAS-2B cells have become an accepted model for assessing the responses of normal human bronchial epithelial cells while maintaining the proliferative capacity of an immortalized cell line.
1.5 Air Pollutants, Oxidative Stress, and Inflammation
14
mechanisms. For PM, this is largely due to the physicochemical factors mentioned earlier: the overall composition, size, number, and surface properties (Kelly 2003). Moreover, the presence of metals and organic hydrocarbons on the surface of combustion-derived PM, such as diesel exhaust particles (DEP), have been demonstrated to be major contributors to PM-induced oxidative damage via the generation of reactive species (Kampa and Castanas, 2008; Cheng et al., 2012; Curtis et al., 2006; Yang and Omaye, 2009; Samet et al., 1998). Ozone, on the other hand, is a potent oxidizing gas that is capable of causing oxidative damage by directly attacking various biomolecules, or through the indirect generation of secondary and tertiary byproducts (Olivieri and Scoditti, 2005).
15
lung injury, asthma, COPD, emphysema, and cancer (Yang and Omaye, 2009). In Figure 1.5.1 A and B, Frank Kelly visually depicts oxidative stress as an imbalance between antioxidants and free radicals (A), while Ciencewicki and colleagues highlight several mechanisms leading to the adverse health effects caused by air pollutant-induced oxidative stress (B). (Kelly, 2003; Ciencewicki et al., 2008).
16
A)
B)
17
In general, the influx of immune cells to a particular area of injury is often associated with inflammation. Both O3 and PM have been observed to cause increased expression of proinflammatory cytokines including interleukin-6 (IL-6), interleukin-8 (IL-8), and tumor necrosis factor-α (TNF-α) (Devlin et al., 1994; Stone et al., 2007; Ovrevik et al., 2009). Moreover, these pollutants have been demonstrated to increase the expression of proinflammatory proteins through activation of signaling cascades. Inflammatory transcriptional responses to oxidative stress have been demonstrated to involve multiple pathways and transcription factors including: Mitogen-Activated Protein Kinases (MAPK), p53, Nuclear Factor kB (NF-kB), and Activator Protein 1 (AP-1) (Liu and Sun, 2010; Ma 2010; Veranth et al., 2007; Tal et al., 2010). Of these, the transcription factors NF-kB and AP-1 appear to play the most significant roles in mitigating the inflammatory responses induced by air pollution-related oxidative stress (Karin et al., 2001). In brief, NF-kB regulates many genes related to inflammatory response (cytokine/chemokines), cell proliferation/death, immune function and synaptic plasticity, while AP-1 regulates redox sensitive signaling pathways, MAP kinases, and activation of inflammatory mediator gene expression (Stone et al., 2007). More importantly, both of these transcription factors are known to be activated by oxidative stress, and mediators used in their activation appear to be redox-sensitive (Li et al., 2008; Vagaggini et al., 2010; Liu and Sun, 2010; Ma 2010; Xia et al., 2006)
18
19
1.6 The Importance of Glutathione
Reduced glutathione (GSH) is a biologically-active tripeptide consisting of glutamate, cysteine, and glycine (Kelly 1999). GSH is a critical reducing agent and potent antioxidant molecule found within all eukaryotic cell types in high, millimolar concentrations (Anathy et al., 2012; Meyer and Dick, 2010; Kelly 1999). Most importantly, GSH has been characterized as the major redox buffer of cellular environments, and is physiologically required for cell survival (Anathy et al., 2012). The high concentration of GSH found within cells accounts for ≥ 90% of the total non-protein thiol (sulfur) content, making this compound a major component involved in the overall homeostasis of cellular redox (Anathy et al., 2012; Kelly 1999). Ultimately, maintenance of the intracellular reducing potential by GSH keeps other cellular components in a reduced state, which preserves their biological activity (Meister 1995).
Being a major component of intracellular antioxidant systems, GSH is found in various cellular compartments including the cytosol, mitochondria, and nucleus.
De novo synthesis of GSH, which is restricted to the cytosol in mammalian cells,
20
availability of cysteine combined with γ-GCS activity is considered to be the rate-limiting substrate and step of GSH synthesis, respectively (Meister 1995).
21
The glutathione system consists of a network of accessory proteins that utilize or maintain glutathione. These proteins include: glutathione reductase, glutathione peroxidase, glutaredoxin, and glutathione-S-transferase. Glutathione peroxidases (GPx) oxidize GSH to GSSG during enzymatic reduction of peroxides. To date, eight GPx isoforms have been identified which vary in specificity for substrates as well as cellular and tissue location (Toppo et al., 2008; Burk and Hill, 2010). Of the eight GPx isoforms, five use selenocysteine in lieu of cysteine to reduce peroxides (Lu and Holmgren, 2009). GPx specifically act in response to hydroperoxides, particularly H2O2 and lipid peroxides (LOOH), generated during oxidative events. Of relevance to findings to be presented in this dissertation, GPx1 and GPx4, are both selenocysteine peroxidases that largely catalyze the degradation of H2O2 and phospholipid hydroperoxides, respectively (Lu and Holmgren, 2008).
As GSH becomes oxidized to GSSG, the action of glutathione reductase (GR) reduces the disulfide back to GSH at the expense of NADPH, which is used as a reducing equivalent. In this regard, GR is a critical component for maintaining the existing GSH pool in its reduced state, especially during periods of oxidative stress,
as de novo synthesis would likely prove insufficient. This also makes the
participation of the pentose phosphate pathway (PPP) vital in mediating the effects of oxidative stress since it is the major mechanism by which NADPH is produced.
22
largely differ from thioredoxins in that they do not require enzyme-mediated reduction for their regeneration. Under normal conditions, Grx catalyze the reduction of disulfides (de-glutathionylation) in target proteins, which ultimately leads to oxidation of GSH (Fernandes and Holmgren, 2004; Anathy et al., 2012). However, during oxidative stress this mechanism can be reversed resulting in the generation of protein mixed disulfides (PSSG), reflecting the oxidative status of the intracellular glutathione pool (Anathy et al., 2012). Lastly, glutathione-S-transferases (GST) directly conjugate GSH to xenobiotic compounds to facilitate detoxification and elimination. There are at least 7 classes of GSTs, and, most notably, the mu and pi isoforms possess genetic polymorphisms that have been linked to air pollution susceptibility (Wu et al., 2011; Auerbach and Hernandez, Ko and Hui, 2010).
1.7 Assessing Oxidative Stress and Associated Challenges
23
requires effective assessment of the earliest possible initiating events. Oxidative stress mechanisms range from generation of ROS and other reactive species, to oxidative damage of biomolecules, to impairment of antioxidant defenses. To add to this complexity, the effects of oxidative stress are often reversible, and due to their reactivity, the reactive species generated are typically short-lived. All of these factors make assessment of a specific “oxidative stress” quite challenging since changes in the redox status of cells are not necessarily driven by the impairment of an individual component or the existence of a single oxidative species.
24
membranes, which contributes to loss of subcellular compartmental specificity while potentially contributing to the generation of oxidation artifacts. To overcome these limitations, many investigators have moved on to conducting live-cell experiments using fluorescent dyes that report the status of a cellular component or generation of a particular reactive species. While this approach maintains cellular integrity, the limiting factor of these assays is typically the properties of the fluorescent reporter because most conventional dyes lack true specificity for their intended target. For example, 2’,7’-dichlorodihydrofluoroscein has been well established for detection of H2O2 within cells; however, recent investigations have demonstrated the lack of specificity of this fluorophore as it also reacts to several other ROS/RNS including hydroxyl radicals, peroxynitrite, and nitric oxide (Chen et al., 2010; Gomes et al 2005).
25
targetable to subcellular compartments, such as the mitochondria (Dickinson and Chang, 2008; Dickinson et al., 2010b).
1.8 Live-Cell Imaging With Genetically-Encoded Fluorescent Reporters of Cellular Redox
26
More recently, mutagenesis experimentation has led to improvement upon the fluorescent properties of GFP. Most notably, a serine to threonine mutation at position 65 yielded a GFP variant that offers enhanced fluorescent intensity and greater compatibility with commonly used laser excitation wavelengths (Meyer and Dick, 2010). This variant is commonly known as enhanced GFP (eGFP). Importantly, despite genetic manipulation, the spectral properties of wtGFP and eGFP have been largely conserved. Both wtGFP and eGFP have two excitation maxima at ~400 nm and 475-490 nm. Emission of this fluorophore at either excitation wavelength occurs at 510 nm (Meyer and Dick, 2010). Spectral and structural properties of GFP can be further altered via additional site-directed mutagenesis that leads to numerous outcomes, including changes in the emission wavelength (color changes) and even “super-folder” capabilities that further stabilize the protein’s structure (Zhang et al., 2002; Pedelacq et al., 2006)
27
changes. The following sections describe two examples of protein-based reporters, roGFP and HyPer, both used in experiments described in this dissertation.
1.8.1 roGFP
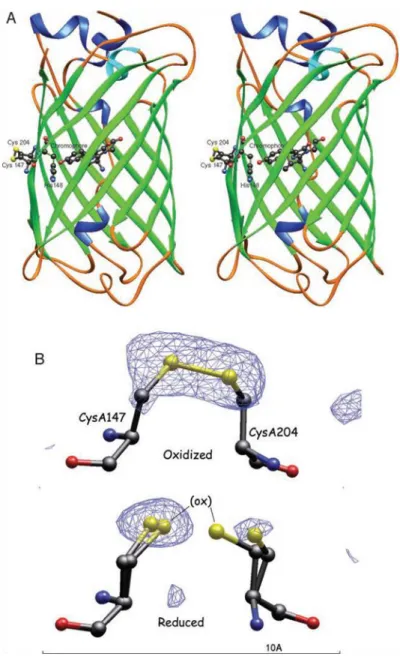
Redox-sensitive green fluorescent protein (roGFP) is a variant of GFP engineered for monitoring the thiol-disulfide equilibrium, a major determinant of oxidative status. In brief, this biosensor was derived by engineering two surface exposed vicinal cysteines into neighboring strands, 7 and 10, on the β-barrel of GFP. Strands 7 and 10 of the β-barrel are located close to the chromophore responsible for the protein’s fluorescent properties. The specific location of the cysteine modifications within the β-barrel depends on the roGFP variant being examined.
28
laser excitation wavelengths (Schwarzländer et al, 2008; Meyer and Dick, 2010, Hanson et al., 2004).
Figure 1.8.1.1 roGFP structure and function. (Hanson et al, 2004)
29
The engineered cysteine residues within roGFP contain thiols that are critical in the function of this redox reporter. Upon oxidizing conditions, a disulfide bridge is formed between the thiol groups of the two engineered cysteines, causing a change in the emission intensity of the fluorophore at each excitation of its two maxima. The dual-excitation/single-emission spectral characteristics of GFP allow for ratiometric measurements by roGFP variants. Ratiometry is an important property of any redox reporter because it reduces or eliminates measurement errors resultant from inconsistencies in fluorophore concentration, illumination intensity, and specimen thickness (Cannon and Remington, 2008). Traditionally, ratiometric measurements are accomplished by independently monitoring the emissions of each excitation wavelength, and then using the emission from one excitation wavelength to normalize the intensity changes observed at the other excitation. During oxidation of roGFP, excitation at 405 nm causes increases the intensity of the emitted fluorescence intensity while the opposite change in intensity occurs during 488 nm excitation. In practice, the final emission intensity is expressed as a ratio of 405/488.
30
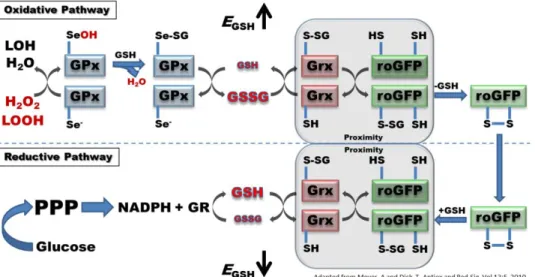
disulfide bond formation and alteration of the spectral properties of the GFP fluorophore (Meyer and Dick, 2010). As with any dynamic reporter of redox conditions, the changes in fluorescence intensity of roGFP are reversible. During recovery, Grx catalyzes the reduction of roGFP disulfide bonds through deglutathionylation as GSSG levels decrease and normal levels of GSH are reestablished by GR, at the expense of NADPH. Thus, the ensuing reduction causes a renormalization of EGSH as GSSG levels decrease, and the baseline ratio of GSH/GSSG is restored (Meyer and Dick 2010).
1.8.2 HyPer
31
hydroxylated to form a cysteine sulfenic acid at position 199. The resulting sulfenic acid then forms an intramolecular disulfide bond with a neighboring cysteine at position 208 which creates a conformational change that activates the protein (Meyer and Dick, 2010).
HyPer was created by inserting circularly permuted YFP (cpYFP) into the regulatory domain of OxyR obtained from E. coli at positions 205 and 206 (Belousov et al., 2006; Meyer and Dick, 2010). The resulting chimeric protein is a fluorescent reporter of H2O2 via the thiol redox state of the OxyR domain. cpYFP is ultimately a variant of GFP, which makes HyPer a ratiometric sensor with two excitation maxima at 420 nm and 500 nm and a single emission maximum at 516 nm (Belousov et al., 2006). As HyPer detects H2O2, a disulfide bond forms in the OxyR region of the protein resulting in a conformational change that directly relates to a ratiometric shift in the two excitation maxima of this reporter (Meyer and Dick, 2010). This leads to an increase in the fluorescence intensity at 500 nm excitation while the intensity at 420 nm decreases as the probe is oxidized by H2O2. Once calculated, the final emission intensity is usually expressed as the ratio of values produced by 500/420 excitation.
1.9 Conclusions, Hypothesis, and Specific Aims
32
many of the toxicological effects of air pollution exposure. The composition of air pollution ranges from well-defined gases, to highly complex mixtures of organic and inorganic compounds that comprise PM. Of recent, the recognition of NP as important constituents of PM has added to this complexity, identifying new knowledge gaps concerning the impact of cellular interaction with NP. As is the case with pollutants of other environmental media, oxidative stress has repeatedly been implicated as a critical feature of the mechanism of action of air pollutants. Specifically, oxidative stress has been implicated as an important mechanism by which PM exerts adverse effects. Among the gaseous air pollutants, ozone is a highly reactive oxidant gas that remains a major component of air pollution in many urban areas. While the direct effects of ozone on biological systems have been fairly well characterized, there are significant informational deficits in regards to the specific oxidative effects of ozone. Thus, it is the overall hypothesis of this dissertation that the initiating oxidative events, which influence the downstream adverse pulmonary effects from particulate and gaseous exposures, can be studied in HAEC with high temporal and spatial resolution using live-cell molecular imaging approaches.
33
exposure to gaseous and particulate air pollutants in live-cell studies will expand the experimental evidence pertaining to the role of oxidative stress in cellular susceptibility to air pollution. Given the transient nature of oxidative events, direct fluorescence detection of ROS and redox potential via live-cell imaging using dynamic biosensors is an especially effective means of observing these very short-lived molecules/changes. Application of newly devised live-cell imaging methodologies, combined with the use of molecular probes capable of 1) assessing changes in intracellular redox status and 2) monitoring levels of intracellular ROS , should aid in the examination of oxidative stress endpoints with high temporal and spatial resolution. Additionally, these molecular probes are targetable to specific cellular compartments, which will aid in pinpointing intracellular targets for oxidative damage as well as determination of cellular responses to changes in oxidative stress.
The hypothesis of this dissertation is addressed with three specific goals: 1)
Chapter 2
Darkfield-Confocal Microscopy detection of nanoscale particle internalization by human lung cells1
2.1 Introduction
The recent proliferation of nanotechnology combined with concerns over the health effects of human exposure to ambient ultrafine particulate matter (UFP) have created a need for information on the toxicology of nanomaterials. Studies to date have made it apparent that the effects of nanomaterials cannot be safely extrapolated from the toxicological properties of larger-scaled materials of the same composition (Biswas and Wu, 2005; Hallok et al, 2009).
Nano-scaled materials are generally defined as structures possessing at least one dimension that is 100 nm or less (Oberdörster et al, 2005a; Oberdörster et al, 2005b). The small size and correspondingly large surface to mass ratio of nanomaterials are features which may alter their interactions with cells and tissues (Jefferson and Tilley, 1999; Tetley, 2007). Incidental human exposure to environmental nanomaterials most often occurs through the inhalation of ambient ultrafine particulate matter that is primarily produced during the combustion of fossil fuels (Harrison and Yin, 2000). Conversely, nanomaterials that are intentionally
1
35
engineered are more commonly known as nanoparticles. In this manuscript, the term nanoparticle (NP) will be used to refer to nano-scaled materials without regard to their origin and are considered to be under 100 nm in size.
Relative to ingestion and dermal absorption, inhalation of NP may be the most likely route of human exposure. The small size of NPs not only allows them to become airborne easily, but promotes deposition in the deep lung as well (Biswas and Wu, 2005). Indeed, inhaled UFP have been reported to be more potent in inducing adverse health effects than larger particles (Biswas and Wu 2005; Oberdörster et al, 2005a; Oberdörster et al, 1994; Nurkiewicz et al, 2008). Some studies have suggested that inhaled NP penetrate the respiratory epi thelial barrier and are distributed systemically to various organs and tissues, including the brain (Jefferson and Tilley, 1999; Oberdörster et al, 2004; Pui et al, 2008; Rothen-Rutishauser, 2007).
36
technology can easily observe particles below 100 nm in size. Unfortunately, EM is costly, labor intensive, limited to materials with sufficient electron density contrast, and primarily restricted to fixed specimens.
37
and Byron, 2009; Xiao et al, 2010). Largely, these studies have been limited by visualizing NP in only a single 2D plane instead of producing a 3D image as presented in this communication.
38
2.2 Methods
2.2.1 Materials and Reagents
Green fluorescent 6.5 µm, 2.0 µm, 0.5 µm, 140 nm, 100 nm, and 50 nm polystyrene spheres (beads) were acquired from Polysciences Inc. (Warrington, PA) and Bangs Laboratories Inc. (Fishers, IN). Titanium dioxide nanoparticles with an average diameter of 27 nm were obtained from Degussa (Aeroxide TiO2, Parsippany, NJ). HCS Cell Mask Blue (H32720) and Prolong Gold Antifade Reagent with and without DAPI (P36934 and P36935) were purchased from Invitrogen (Molecular Probes, Eugene, OR). First Contact cleaning polymer was obtained from Photonic Cleaning Technologies (Platteville, WI).
2.2.2 Specimen Preparation
39
sonicated for 30 minutes in each wash solution. Washed slides were stored in 70% ethanol until needed. Just prior to coverslip mounting, a slide was removed from the 70% ethanol, briefly rinsed in 100% ethanol and allowed to air dry for approximately five minutes. Lastly, to further aid in the removal of slide debris, the specimen area of the slide was painted with a commercially available cleaning polymer (First Contact), allowed to cure for a minimum of 15 minutes, and peeled off immediately before mounting coverslips. All reagents used to wash slides were filtered using 0.22 µm filters. All steps in which the slides were exposed to air (i.e. removal from the various wash solutions) were carried out in a biological hood to minimize contamination with airborne debris. Use of this slide cleaning procedure produced slides that were relatively free of debris detectable by darkfield microscopy.
Fluorescent Polystyrene Beads: Suspensions of 50 nm, 100 nm, 140 nm 500 nm, 2 µm, and 6.5 µm Fluorescent polystyrene beads (Polysciences, Warrington, PA) were prepared in dH2O and directly applied to freshly cleaned glass slides. Following a drying time of 15 to 20 minutes, #1.5 coverslips were mounted onto the slides using Prolong Gold Antifade Reagent.
2.2.3 Cell Culture and Exposure
40 plated (≤ 1.5 x 10⁶
cells/well) on 12 mm, #1.5 coverslips located in 6-well culture dishes and allowed to grow for one day prior to exposure. At the time of exposure, media was removed from the cell cultures and 2 ml of a freshly prepared homogeneous suspension of 27 nm TiO2 was applied immediately. Cells were typically exposed for either 5 minutes or 2 hours (120 minutes) prior to washing and fixation. Pulsed exposures involved continuous exposure for 5 minutes followed by removal of exposure media, a brief wash using KGM, and incubation in fresh, particle free, media for an additional 115 min. After exposure, cells were washed twice in 1X Dulbecco’s Phosphate Buffered Saline (PBS, Gibco, Grand Island, NY) and then fixed in 4% paraformaldehyde (PF) made up in PBS and stained.
Titanium dioxide Preparation: For each cell exposure experiment, a fresh stock solution of 27 nm TiO2 was prepared by resuspending 1 mg of dry particles in 1 ml of sterile dH2O. This solution was then sonicated for 30 seconds using a temperature-controlled cup-horn sonicator (Fisher Scientific, Pittsburgh, PA). The TiO2 particles were further diluted to their final concentration of 0.5 or 2.5 µg/ml using Keratinocyte Growth Medium (KGM). Just prior to cell exposure, these particle suspensions were sonicated again for 30 seconds and then immediately applied to 6-well dishes that contained 12 mm cover slips.
2.2.4 Cell Fixation, Staining, and Mounting
41
or 4',6-diamidino-2-phenylindole (DAPI) for nuclear staining. Staining using CMB was done as an adaptation of the procedure provided by the manufacturer. Briefly, 1 ml of 0.1 µg/ml CMB in 1X PBS was added to each well and allowed to incubate overnight at room temperature. The next morning, cells were washed in 1X PBS followed by a final rinse in dH2O. Lastly, the coverslips from each well were mounted on newly cleaned slides using Prolong Gold Antifade Reagent. In experiments where DAPI staining was performed, cells were mounted using Prolong Gold Antifade Reagent with DAPI in lieu of overnight staining.
2.2.5 Confocal Microscopy Quality Assurance (QA)
The confocal microscope, lenses and optical components utilized in this study were evaluated for QA using the procedures described by Zucker and Zucker et al. (Taatjes et al, 2006; Zucker, 2006a-c; Zucker et al, 2007). Briefly, colocalization was examined using PSF beads, and field illumination and laser powers were monitored. In the Nikon confocal system, laser fluorescence colocalization was present between the 488 and 561 lines, while the 404 showed a z axis spectral shift with the other 2 visible wavelengths (488 nm and 561 nm) and was not colocalized. This lack of colocalization of UV and visible laser light with the Nikon C1Si is quite typical of confocal microscopes from all manufacturers.
2.2.6 Simultaneous DF and CLSM
42
43
Figure 2.2.6.1 Schematic diagram of an inverted confocal system equipped for simultaneous fluorescence and darkfield imaging. In this example, source laser light (Blue) is focused on the specimen for fluorescence excitation. Fluorescence light emitted by the specimen
(Green) is collected by the objective in a conventional CLSM manner.
44
45
diaphragm that was variable between 1.32 numerical aperture and 0.6 numerical aperture was employed. This system used a dry condenser, compared with the oil condenser from the Nikon system. The Leica system used a Plan Apo lens with an air condenser while the Nikon system used a Plan Fluor lens with an oil condenser. A higher numerical aperture with better resolution was achievable with the Nikon system due to the oil condenser. However this oil condenser is not applicable on all manufacturers’ inverted microscopes.
46
2.2.7 Statistical Analyses
47
2.3 Results
2.3.1 DF-CLSM detection of nanoscale particles
48
49
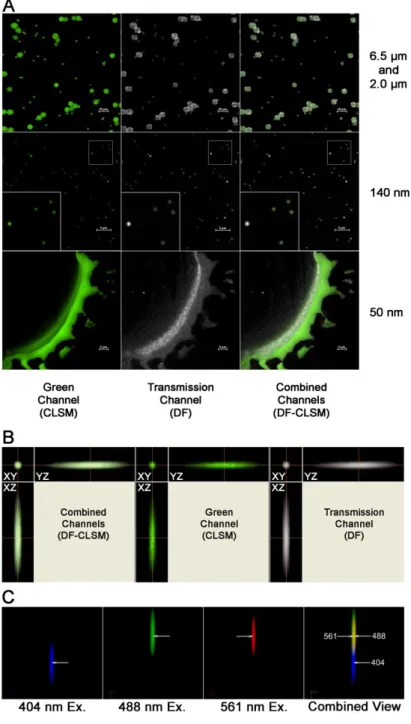
lower left-hand corner show an enlarged area for clarity. B. Three dimensional colocalization analysis of a 500 nm fluorescent polystyrene sphere imaged by DF-CLSM. The sphere shown was excited by 488 nm laser light while simultaneous monitoring for fluorescence and scattered light occurred via the green and transmitted light channels. Each set of images shows the XY, XZ, and YZ orientation for the combined, green (CLSM), and transmission (DF) channels, respectively. The large crosshairs represent the same point in space across all the axial views. C. Variability in spatial localization of DF images obtained with multiple wavelengths of light. Shown are 10x pseudo-colored images of the same 27 nm TiO2 particle illuminated by 404 (Blue), 488 (Green), and 561 (Red) laser light. Each set of images depicts the X, Y, and Z orientation for the transmission (DF) channel. For the combined view, areas of overlap in the 488 and 561 excitations are observed in yellow. The arrows represent the midpoint of the same particle illuminated at each wavelength, showing a small x,y lateral distortion between the 488 and 561 nm excitation lines, while both the 488 and 561 have a much larger axial (z) dispersions from the 404 excitation line. Note the large separation between the blue excitation and the visible laser excitation lines. 60x Plan Fluor, Magnification 600x + 1, 5, or 10x zoom as designated.
50
51
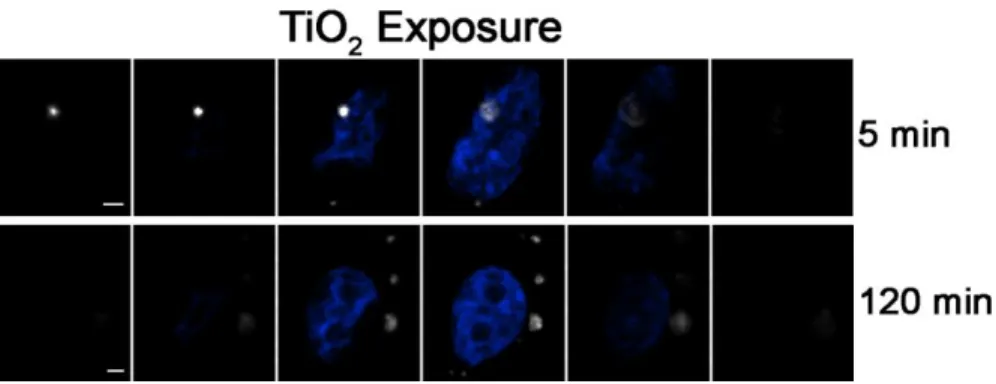
Figure 2.3.1.2 Darkfield(DF)/Confocal(CLSM) imaging of TiO2 nano particles internalized by human bronchial epithelial cells.
52
2.3.2 Examination of in vitro particle internalization using DF-CLSM
53
54
55
56
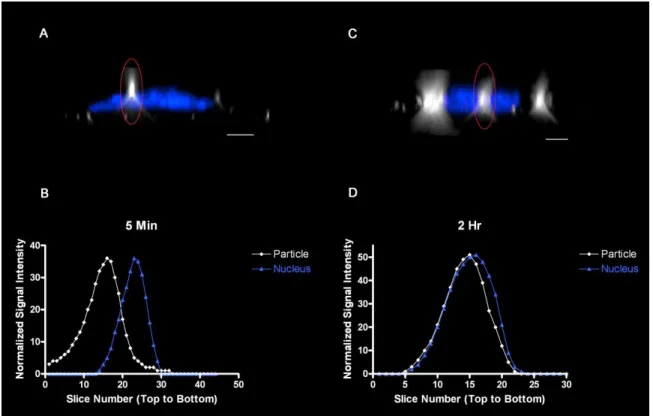
To further test this approach in a practical application, we compared the location of maximal particle scatter intensity relative to the nucleus in the z-axis for BEAS cells exposed to 27 nm TiO2 continuously for either 5 min, or “pulsed” for 5 min followed by washing and an additional 115 min incubation in particle-free media prior to fixation (120 min-pulsed). The data were normalized for slice number and the slice in which the nucleus was centered was designated as zero. Similar to the results in Figure 2.3.2.2, a clear shift in the mean particle location inferred from maximal light scatter was observed between cells exposed to particles for the 5 and the 120 min-pulsed groups. Specifically, there was a time-dependent change in the location of the particle maximum intensity and presumed center away from the cell surface towards the nucleus and slide surface (Figure 2.3.2.3). Interestingly, the 120 min-pulse cells showed particles clustered above, coincident with and below the nucleus center. This may reflect distinct intracellular paths established by the presence of the nucleus within a large fraction of the cell volume or may be due to in part to the variation in intracellular “z” volumes. These findings demonstrate that DF-CLSM is useful to observe time-dependent NP transit within the cell.
57
58
2.4 Discussion
While the use of NP in consumer products, industrial processes, and pharmaceutical applications continues to grow, knowledge of the impact of nanomaterials on human health remains limited (Yang et al, 2008). Compounding the challenge presented by the paucity of toxicological information on nanomaterials, investigators studying the biological effects of nanomaterials are faced with a number of unique challenges. Fundamental questions pertinent to the interaction between nanoparticles and the cell are best addressed with imaging studies. However, NP are usually not detectable by conventional light microscopy methods. In some instances, fluorescent nano materials (i.e., Q-dots) can be used with fluorescent microscopy. Darkfield microscopy can detect the presence of nanoparticles, but their location within the cell or on the surface of the cell cannot be determined with accuracy using a wide field microscope. The combination of darkfield and confocal microscopy described in this manuscript was developed in an effort to address some of these imaging challenges by bringing the strengths of two distinct light microscopy techniques (DF and CLSM) to study the interactions of cells with environmentally relevant NP.
59
60
the study of environmentally relevant NP. An additional advantage of DF-CLSM is its potential to be used in experiments involving live-cell imaging, which is impossible with conventional EM.
Detection of NP using DF-CLSM relies heavily on the intrinsic light scattering properties of the material being observed. In the validation of this technique, DF-CLSM proved to be sufficiently robust to detect several types of NP comprised of different materials ranging from polymers to nanodiamonds and metal oxides (Gibbs et al, unpublished). Interestingly, even materials with relatively smooth surfaces, like the polymers of polystyrene beads, have sufficient light scattering properties to be detected by this technique. The associated signal from larger polystyrene beads is less than that produced by smaller TiO2 nanoparticles.
61
62
acquisition must be taken into account because data acquired with sequential excitation of multiple wavelengths may introduce chromatic aberration errors in the sample between the nanoparticles derived from one wavelength and the fluorescent signals derived from the other laser lines. This is not necessarily a limitation unique to this application, but more likely a limitation resulting from the UV and visible colocalization issues in CLSM and the quality and alignment of the optical components used in the CLSM equipment. It appears that the nanoparticles accentuate these colocalization problems relative to submicron and micron particles. It is recommended that characterization of issues regarding chromatic aberration and colocalization of various wavelengths should be made for each imaging system and each lens used.
2.5 Conclusions
Chapter 3
Monitoring Intracellular Redox Changes in Airway Epithelial Cells Exposed to Ozone1
3.1 Introduction
The intracellular redox environment is a highly dynamic setting governed by the formation and degradation of various reactive species of oxygen and nitrogen. Under normal physiological conditions, the cytosol, nucleus, and mitochondrial matrix space maintain homeostatic conditions in favor of a highly reducing environment (Cannon and Remington 2009). Intracellular reducing conditions are largely maintained by millimolar concentrations of reduced glutathione and its accessory enzymes that together comprise the glutathione system (Anderson 1998). Ultimately, maintenance of the intracellular glutathione redox potential (EGSH) comes from the metabolism of glucose, as glutathione is reduced by glutathione reductase using NADPH produced by the pentose phosphate pathway (Wamelink et al. 2008).
A number of pathophysiological states are associated with changes in the intracellular glutathione redox potential (Dubinina and Dadali 2010; Ma 2010; Yang and Omaye 2009). Such “oxidative stress” is commonly cited as a mechanistic
1
64
feature of the toxicity of numerous xenobiotic compounds linked to adverse health outcomes (Bargagli et al. 2009; Ciencewicki et al. 2008; Kohen and Nyska 2002). For instance, the health effects of the potent ambient air pollutant ozone (O3) are understood to be mediated through an oxidative stress mechanism involving the oxidation of cellular biomolecules (Ballatori et al. 2009; Kelly et al. 1995; Mudway and Kelly 2000). In the lung, ozone exposure causes decrements in pulmonary function and induces inflammatory responses derived from the bronchial epithelium, a major target of ozone exposure (Ballinger et al. 2005; Kelly et al. 1995; Mudway and Kelly 2000; Pryor 1992; Pryor et al. 1995; Song et al. 2010). Due to its high reactivity, O3 interacts with cellular and extracellular biomolecules, resulting in multiple types of oxidative damage to lipids, proteins, and nucleic acids (Kelly et al. 1995; Laumbach ; Mudway and Kelly 2000; Srebot et al. 2009; Van der Vliet et al. 1995; Yang and Omaye 2009). While numerous studies have established oxidant damage of biomolecules as a result of O3 exposure, direct measures of ozone-mediated 'oxidative stress' have been difficult to achieve, yet alteration of a defined intracellular redox couple like glutathione would represent an important early indicator of the oxidative effects of O3 exposure.
65
66
Figure 3.1.1 roGFP2 interactions with the glutathione system.
67
Further efforts to improve the responsiveness of roGFP2 have led to the conjugation of pathway-specific enzymes to create a chimeric fusion of proteins operating as redox relays. In particular, the conjugation of glutaredoxin 1 (Grx1) to roGFP2 has been shown to enhance the kinetics of the roGFP2 response to the oxidation of glutathione (Gutscher et al. 2008).
68
3.2 Methods
3.2.1 Materials and Reagents
Tissue culture media and supplements were purchased from Lonza (Walkersville, MD). Wilco Wells glass-bottom culture dishes were obtained from Ted Pella (Redding, CA) and Warner Instruments (Hamden, CT). Fugene 6 transfection reagent was acquired from Roche Applied Science (Indianapolis, IN). Kits to measure intracellular glutathione and NADPH were bought from Promega (Madison, WI) and AbCam (Cambridge, MA), respectively. Laboratory reagents and chemicals including Hydrogen peroxide, Dithiothreitol (DTT), 2-acetylamino-3-[4-(2-acetylamino-2-
carboxyethylsulfanylthiocarbonylamino)phenylthiocarbamoylsulfanyl]propionic acid (2-AAPA), Buthionine sulfoximine (BSO), and Sodium selenite were obtained from Sigma-Aldrich (St. Louis, MO). Basic laboratory supplies were purchased from Fisher Scientific (Raleigh, NC).
3.2.2 Cell Culture
69
exposures, BEAS-2B cells were plated in 35mm Wilco Wells glass-bottom dishes with a 12 mm #1.5 glass aperture (Ted Pella, Redding, CA).
3.2.3 Genetically Encoded Redox Sensors
Plasmid for the redox-sensitive green fluorescent protein 2, roGFP2, was the generous gift of Dr. S. J. Remington (University of Oregon, Eugene, OR). Plasmid for the hydrogen peroxide sensor, HyPer, was purchased from Evrogen (Axxora, Farmingdale, NY). Cytosolic and mitochondrially targeted versions of roGFP2 and HyPer were placed in lentiviral vectors as described previously (Cheng et al. 2012).
3.2.4 Plasmid Transfection and Lentiviral Transduction
70
were propagated for multiple passages. For some experiments, stably transduced cells were sorted for optimal fluorescence expression at the UNC Core Flow Cytometry Facility
3.2.5 Exposure Conditions
71
72
For each experiment, cells were exposed to control air (5% CO2/Balance air) or ozone concentrations ranging from 0.15 – 1.0 ppm. The entire exposure period typically consisted of 3 component intervals collectively lasting up to an hour in length. They included: 1) an initial untreated baseline period of 5 min; 2) an exposure period of up to 45 min; and 3) a 10 min control exposure period in which cells were oxidized by 0.1 to 1.0 mM hydrogen peroxide for 5 min and then reduced by 10 mM DTT for an additional 5 min. During these exposures, the ozone concentration in the exposure chamber was monitored in real-time using a Dasibi Model 1003-AH Ozone Analyzer sampling at a flow of 2.0 L/min. Ozone exposures for non-imaging assays were performed using exposure chambers operated by the U.S. Environmental Protection Agency’s (EPA) Environmental Public Health Division.
3.2.6 Imaging Analysis
73
Falls, VT). Results were calculated as ratios of the emissions excited by the 488 nm and 404 nm lasers scanned sequentially at a frequency of 1 min. All imaging data were acquired using the Nikon EZ-C1 software.
3.2.7 Measurement of Intracellular NADPH
After cells were equilibrated in fresh KGM or Locke solution (+/- glucose) for 2 hrs, the intracellular levels of total NADPH were assessed using an AbCam NADP/NADPH assay kit. The manufacturer’s instructions provided with the kit were used to carry out this assay. Following the equilibration period, cells were immediately placed on ice and washed with cold 1X PBS just prior to the initial lysis step. Absorbance was read at 450 nm using a PolarStar Optima microplate reader (BMG Labtech, Durham, NC).
3.2.8 Statistical Analysis
74
3.3 Results
3.3.1 Ozone exposure induces an increase in the cytosolic glutathione redox potential
75
Figure 3.3.1 Exposure to O3 induces a dose- and time-dependent
76
3.3.2 Glucose deprivation potentiates the elevation of EGSH induced by ozone
exposure
77
Figure 3.3.2.1 Glucose deprivation sensitizes cells to O3-induced
78
79
3.3.3 Validation of glutathione-dependent roGFP2 responses to ozone exposure
80 A
B