iii
THE RELATIONSHIP BETWEEN PAIN AND EMOTIONAL FACES: INVESTIGATING THE ROLES OF LOAD AND VALENCE
Page Sloan Dobson
A thesis submitted to the faculty at the University of North Carolina at Chapel Hill in partial fulfillment of the requirements for the degree of Master of Arts in Psychology.
Chapel Hill 2016
Approved by:
Mark Hollins
Joe Hopfinger
ii © 2016
iii ABSTRACT
Page Sloan Dobson: The relationship between pain and emotional faces (Under the direction of Mark Hollins)
It is well established that pain perception can be decreased when one is
completing a cognitive task or exposed to mood enhancing stimuli. However, there is
much less research concerning valenced distractors. In this experiment, both stimulus
valence and cognitive load were manipulated by presenting emotional faces that were
either upright (low-load) or inverted (high-load). Participants viewed the images while
experiencing noxious heat pulses and then gave ratings on both the visual and thermal
stimuli. Pain intensity and unpleasantness were significantly higher when participants
viewed happy faces compared with neutral faces, regardless of orientation. This finding
is at odds with studies on emotional modulation of pain, in which pleasant stimuli reduce
pain compared with neutral stimuli. However, as both upright and inverted happy faces
were recognized with high accuracy, the present findings are in line with distraction
studies in which concurrently presented low-load stimuli result in higher pain ratings
than high-load distractors. That is, happy faces required much less processing for
identification and were thus ineffective distractors compared with the more ambiguous
iv
This work is dedicated to my family.
To Dad, Mom and Brother John, who have driven me.
v
ACKNOWLEDGEMENTS
Thank you to Matsen for your programming expertise and your calm presence.
This experiment would not have happened without those two invaluable contributions.
Thank you to Emily for running subjects and for running all over town with me
when I just couldn’t work in Davie. I would not have reached my goal without your
empathy over missed appointments and Panhellenic distaste.
Last in the list, but first in my heart, thank you to Mark Hollins. It takes a special
human being to unfailingly support a graduate student through the ups and downs of the
degree requirements. It takes someone of an even higher caliber to also support a
graduate student through the extracurricular parts of life. I may have a funny way of
showing it, but I’ve treasured every piece of advice on academic and personal matters.
Your voice will be the (maybe only) source of reason in my mind for years and years.
vi
TABLE OF CONTENTS
LIST OF TABLES ………...……….……….vii
LIST OF FIGURES………..…………..viii
INTRODUCTION ………..………..1
CURRENT STUDIES ……….………..………...16
Pilot Study………17
Method……….18
Results……….21
Discussion………..……….23
Main Experiment……….25
Method……….25
Results……….30
Discussion………..……….41
Conclusion………..……….49
REFERENCES……….………..………....50
vii
LIST OF TABLES
viii
LIST OF FIGURES
Figure 1.1 - Proportion correct in the pilot task with 500ms presentation time…………22 Figure 1.2 - Proportion correct in the pilot task with 750ms presentation time………....22
Figure 1.3 - Proportion correct in the pilot task with 1000ms presentation time………..22
Figure 1.4 - Proportion correct in the pilot task with 1500ms presentation time………..22 Figure 1.5 - Proportion correct in the pilot task with 2000ms presentation time…...…22
Figure 2 – Pain intensity ratings by visual stimulus type ………....34
Figure 3 – Pain unpleasantness ratings by visual stimulus type………34
Figure 4 – Proportion correct in main experiment task by visual stimulus type………...34 Figure 5 – Pain intensity ratings by orientation and emotion………..36
Figure 6 – Pain unpleasantness ratings by orientation and emotion……….36
Figure 7 – Pain intensity ratings for visual stimuli across orientation……….37 Figure 8 – Pain unpleasantness ratings for visual stimuli across orientation…………...38
Figure 9 – Proportion correct by orientation and emotion………...39
1 Introduction
Cognition and emotion both affect pain, with distractions and improved mood
serving to reduce pain. In life, one can imagine situations in which these factors work
together (being distracted from pain by an activity that lifts your mood, such as playing
piano) or against each other (completing a boring, joyless task that is distracting but
lowers mood). However, most experimental paradigms manipulate either cognitive or
emotional factors and do not consider the ways in which emotional distractors influence
noxious processing. The purpose of this study is to test the relationship between these
factors in the modulation of pain.
Pain and Distraction
Experimental evidence points to a negative relationship between pain and
unrelated cognitive processing, suggesting that these processes share a common pool
of resources. Behavioral reports of pain, in response to a noxious stimulus, are reduced
during cognitively-demanding tasks such as simple math problems (Dowman, 2004;
Schelreth, Baumgartner, Magerl, Stoeter, & Treede, 2003;Terkelsen, Andersen,
Molgaard, Hansen, & Jensen, 2004; Yamaki, Kakigi, Watanabe, & Hoshiyama, 2005),
Stroop paradigms (Bantrick, Wise, Ploghaus, Clare, Smith, & Tracey, 2002;
Seminowicz, Mikulis, Davis, 2004; Valet et al., 2004), n-back tests (Bingel, Rose,
Glascher, & Buchel, 2007; Buhle & Wager, 2010), and video games (Campbell, Witmer,
2
Although the majority of experiments report this pattern, some report no effect of
distraction (Pud & Sapir, 2006; Roelofs, Peters, van der Zijden, & Vlaeyen, 2003; Van
Damme, Crombez, Eccelston, Goubert, 2004). Therefore, not all distractors are
effective analgesics. The extent to which a task can reduce pain depends on the
amount of load required by the task (Buhle & Wager, 2010; Veldhuijzen, Kenemans, de
Bruin, Olivier, & Volkerts, 2006), level of concurrent pain (Buhle & Wager, 2010), and
characteristics of the individual (Campbell et al, 2009; Roelofs, Peters, van der Zijden,
Vlaeyen, 2004; Seminowicz, Mikulis, & Davis, 2004).
Imaging evidence suggests that these changes in pain, revealed by self-report
measures, are accompanied by changes in brain activity. Reduced activity during
cognitively-demanding tasks is found in several areas associated with pain processing,
including the somatosensory cortices (Seminowicz, Mikulis, Davis, 2004), as well as the
thalamus, insula, and the anterior cingulate cortex (Bantick et al., 2002; Valet et al.,
2004). Distraction during pain is also associated with increased activation in certain
areas including orbitofrontal cortex (OFC), perigenual anterior cingulate cortex (pACC),
periaqueductal grey (PAG), & posterior thalamus (Bantick et al., 2002; Petrovic et al.,
2000; Valet et al., 2004). Increased activity in frontal areas (OFC, ACC) reported by
these studies is thought to reflect top down influences on pain processing.
Pain and Emotion
Laboratory inductions of mood generally find a valence-specific effect on pain
ratings. Pleasant stimuli reduce subjective pain ratings or increase pain tolerance while
unpleasant stimuli tend to increase pain ratings and decrease pain tolerance. This
3
Meagher, Arnau, Rhudy, 2001), videos (Weisenberg, Raz, & Hener, 1998), music (Roy,
Peretz, Rainville, 2008), written statements (Zelman, Howland, Nichols, Cleeland,
1989), and odorants (Villemure & Bushnell, 2009; Villemure, Slotnick, & Bushnell,
2003). However, not all studies find this pattern. For example, greater pain in the
presence of emotional odorants (Martin, 2006) and emotional faces (Senkowski, Kautz,
Hauck, Zimmerman, & Engel, 2011) of both positive and negative valence were found
compared to neutral stimuli. Negative mood states, such as fear, have been found to
increase pain threshold or tolerance when the emotion is strong enough to produce
endogenous opioid release or cardiovascular changes (Rhudy & Meagher, 2000).
As with cognitive tasks, there are brain activation changes associated with pain
modulation due to mood induction. Villemure and Bushnell (2009) found that pleasant
odorants reduced pain ratings, and that these valence-related changes were associated
with decreased activation of the anterior cingulate, medial thalamus, and primary and
secondary somatosensory cortices. In another study, anxiety induced by threat of pain
increased entorhinal responses, which predicted changes in pACC cingulate (related to
affective pain processing) and mid-insula (related to sensory pain processing) to
electrical pulses (Ploghaus et al., 2001).
Subjective pain ratings and brain activation patterns are measures of supraspinal
modulations of pain. Emotional modulation also occurs at the spinal level. Rhudy,
Williams, McCabe, Nguyen, and Rambo (2005) measured both subjective ratings and
the nociceptive flexion reflex (NFR), an involuntary measure of nociceptive processing.
Although the NFR is considered a more objective measure that is less susceptible to
4
influences. Participants viewed images with either positive or negative valence while
painful electrical pulses were delivered to their ankle. As expected, subjective pain
ratings were higher during unpleasant pictures and lower during pleasant pictures
compared with neutral pictures. This measure of supraspinal pain processing was
corroborated by the NFR magnitudes; compared with responses to electrical stimulation
paired with neutral images, amplitudes were higher during unpleasant pictures and
lower during pleasant pictures. Thus, affective stimuli are capable of modulating both
spinal and supraspinal measures of nociceptive processing.
Pain, Distraction, and Emotion
Although most experiments focus on either a cognitive or an emotional
manipulation, it is difficult to fully dissociate these factors. For instance, a distracting
task could be more enjoyable than focusing on the painful heat pulse. If so, any pain
modulation could be due to decreased attention, increased positive mood, or a
combination of both. It is thus important to consider the possible contributions of both
processes in experiments that ostensibly involve only one or the other.
Villemure, Slotnick, and Bushnell (2003) attempted to tease apart the effects of
distraction and emotion by directing participants’ attention (distraction) to either painful
heat pulses or to odorants that were either pleasant or unpleasant (emotion).
Participants rated the noxious heat pulses on two components of pain, intensity and
unpleasantness. A double dissociation was found, such that distraction reduced pain
intensity (regardless of odor valence) while odor valence affected pain unpleasantness
(regardless of attentional focus). Sloan & Hollins (under review) tested the generality of
5
of odorants. Using auditory stimuli, this pattern of results did not hold. Pain
unpleasantness was affected by both the direction of attention and sound valence, while
pain intensity ratings were impervious to the experimental manipulations.
In neither study did the effects of emotion and attention on pain ratings interact.
The attentional manipulation in both studies ostensibly compared two extreme
conditions: Instructions asked subjects to focus their attention exclusively on the pain, or
exclusively on the distracting stimulus. Additionally, neither study asked participants to
attend to the valence of the distractor, but instead to the physical intensity of the odorant
or sound. It may be that the emotional value of the distractor modulates the analgesic
effectiveness of the distractor when the participant is asked to attend to both the pain
and the emotional content of the distractor concurrently. The present study tests this
hypothesis using emotional faces as the distractor.
Faces are an especially good fit for this line of research for several reasons.
First, some types of stimuli may be more arousing or novel to particular groups of
people. Emotional human faces on the other hand are much less susceptive to
individual bias because most individuals come into contact with an emotional human
face every day. Because the average person is a face expert, there may be less
variance in how these images are processed compared to images of physical injuries.
Second, interpreting emotions is especially important to us as a means of social
connection and, from an evolutionary standpoint, survival.
Along with their validity outside the laboratory, faces are also excellent
candidates for experimental manipulations. One reason is that a wide variety of
6
more visual features with emotional faces than a neutral scene (such as a grocery
store) does with an emotional scene (a mountain view or dirty restroom).
Similarly, we are able to manipulate attentional load without changing any
physical features by simply inverting the face. Yin (1969) first reported a
disproportionate reduction in memory for inverted faces compared to other inverted
images, a finding called the face inversion effect (FIE). Many studies have since
replicated the poor memory for inverted faces (reviewed by Valentine, 1988). Other
types of task performance such as visual search for singletons (Lamy et al., 2008) are
also disrupted or slowed by inversion. As these studies show, it is more difficult to
process inverted versus upright faces. For this reason, face orientation is used as a
proxy for cognitive load in the studies described below. That is, upright faces are
considered low-load and inverted faces are considered high-load. In the context of the
current experiment, this manipulation allows us to determine if the effects of distractor
valence on pain differ between high-load versus low-load conditions, instead of merely
comparing load and no load conditions.
Additionally, human faces display a wide array of expressions which can be
categorized further than simply “pleasant” or “unpleasant”. Although sounds, odorants,
and other visual stimuli are capable of influencing many emotions, the delineation of
which emotions are intended or experienced may be less clear. Using as an example an
image of a mutilated body, it is reasonable that one may feel disgusted, sad, angry, and
fearful, but all of these emotions are collectively called unpleasant in the experimental
setting. Conversely, the images used in this experiment are designed to clearly
7
responsible for the effects of valence. The fact that information about emotions is
actually present in a facial expression (whereas it is not in, say, a sunset) makes it
possible to objectively measure a person’s ability to correctly perceive emotions.
Finally, faces are prime candidates for pain modulation based on their degree of
arousal. The effectiveness of other emotional stimuli in influencing pain relies on both
their valence and the arousal they produce (Rhudy, Williams, McCabe, Russell, &
Maynard, 2008). The expressions used in these experiments (happy, angry, fearful) are
rated as moderately to highly arousing (Gerber et al., 2008).
Effect of viewing emotional faces on pain
Despite the suitability of faces for pain research, there are surprisingly few
experimental studies on the impact of emotional faces on pain ratings. Most often,
studies of faces and pain are investigating vicarious pain by presenting subjects with
images or videos of other people expressing pain. Vicarious pain studies usually find
that viewing pain faces increases reports of one’s own pain in response to a noxious
stimulus (Mailhot, Vachon-Presseau, Jackson, & Rainville, 2008). Additionally, brain
activations while viewing someone else in pain are similar to those observed when the
subject is in pain (Botvinick, et al., 2005; Vachon-Presseau et al., 2010). However, there
are relatively few studies that investigate how emotional, but not pained, faces modulate
the experience of one’s own pain. This paucity of studies is surprising because faces
provide an excellent stimulus, as described above.
Senkowski et al. (2010) presented noxious electrical pulses either alone or with a
8
pictures conveyed happiness, anger, fear, or a neutral expression. Faces with a
negative emotion increased pain ratings compared to neutral expressions and to
electrical pulses presented alone. This result follows the literature reported earlier where
unpleasant stimuli increase pain. Interestingly, pain responses to happy faces also
increased pain compared with neutral faces or no face- a finding that runs counter to
most other emotion studies. Additionally, neutral faces compared to the no face trials
raised pain ratings.
Two experiments conducted by another research group found a different pattern
of subjective pain rating modulations by faces displaying positive and negative
expressions. In both a fMRI study (Yoshino et al., 2010) and a MEG study (Yoshino et
al., 2012), painful electrical pulses were delivered through an electrode needle that was
inserted just below the skin while sad, happy, or neutral faces were viewed. Pain ratings
were higher during sad faces than happy and neutral faces, with no differences between
happy and neutral faces.
Reicherts, Gerdes, Pauli, and Wieser (2013) played videos of models making
facial expressions (neutral, joy, fear, or pain) while participants felt noxious heat pulses.
Pain intensity ratings were lower for all videos compared with only a fixation cross on
screen, an effect attributed to distraction. Videos of transient pain expressions by the
model were associated with the highest pain ratings, an effect that corroborates studies
of vicarious pain increasing experienced pain (Mailhot et al., 2008). There were no
differences between the pain intensity ratings in the presence of neutral, joy, or fear
9
The studies reported above are equivocal regarding the effects of emotional, but
not pained, facial expressions on pain perception, with (1) a valence-specific effect such
that only the negatively-valenced expression increased pain ratings (Yoshino et al.,
2010; 2012), (2) valence-general increases in pain (Senkowski et al., 2010), and (3) no
effect of emotional expressions on pain (Reicherts et al., 2013).
These differing effects of emotional modulation of pain is surprising given
evidence from emotional priming research showing that the appraisal of faces can
influence our affective interpretation of other stimuli. For instance, Chinese characters
are rated as more pleasant by those unfamiliar with the language when they follow a
likable face (preferred presidential candidate) than when they follow a disliked face
(non-preferred candidate; Payne, Hall, Cameron, & Bishara, 2010). Using a similar
paradigm, Blaison et al. (2012) found that Chinese characters were rated as more
anger- or fear-evoking following angry and fearful faces, respectively.
One possible explanation for the disparity in those results and that of other
emotional stimuli is that viewing emotional faces may not evoke the first person
experience of said emotion when the participant is experiencing a contrasting emotion.
For instance, viewing a happy face may decrease, instead of increase, positive affect in
the participant when the participant is in pain. However, if this were the case, we would
expect that the studies listed above would have been more similar to Senkowski’s
results. It is also difficult to support this theory by discussing previous research as there
has not been a paradigm to date that assesses the emotional reaction of a participant in
10
Two other explanations for why this valence-specific pattern has not emerged in
the literature on emotional faces and pain research are easier to assess given the
experiment paradigms. First, timing may be important. In both Senkowski and Yoshino,
the faces were presented concurrently with a painful shock. Perhaps faces must be
presented first to influence pain, much like the set up for the emotional priming in
Payne’s studies. Secondly, emotional faces may only be capable of influencing the
affective component of pain, not the sensory (intensity) component. All three studies
cited above didn’t discriminate between the two, so conclusions cannot be drawn
regarding this possibility.
A cognitive, instead of emotional, approach may be necessary to explain these
results, considering the lack of control for general effects of attention. In both Senkowski
et al. and Reicherts et al., the only controls for the appearance of faces were fixation
crosshairs, while in Yoshino et al. there were no trials without faces. This lack of a
control for an on-setting stimulus is an especially strong argument of Senkowski’s study,
were neutral faces raised pain ratings compared with a trials were pain was presented
without a visual stimulus. This increase study could be due to an arousing or orienting
effect such that the appearance of a face (a complex, socially important cue), compared
with a crosshair (meaningless and visually simple), induced participants to direct more
resources to all aspects of the experiment, including the pain stimulus (another
evolutionarily important signal). In Reicherts’s experiment, all videos of transient facial
expressions reduced pain compared to a fixed crosshair. This design speaks more to
the effectiveness of videos to distract an individual from a pain than it does about the
11
hypothesis posits that differences in stimulus presentation are at least partially
responsible for the divergent findings.
Upright and inverted faces
Cognitive processing. Many investigations of emotional face processing use
inverted faces as controls for physical qualities of the face (Bannermann, Milders, de
Gelder, & Sahraie, 2009; Eastwood. Smilek, Merikle, 2001; Fox & Damjanovic, 2006;
Lamy, Amunts, Bar-Haim, 2008; Williams, Moss, Bradshaw, & Mattingley, 2005). Such
a control is necessary because the effect of emotion could be due to differences in the
distinctiveness of facial features varying across emotions (whites of the eyes, teeth
visibility, brow contours) or low-level visual differences (luminance, energy, texture,
contrast). Calvo and Marrero (2009) found that the emotional faces with the greatest
visual search advantage also had the greatest number of distinct physical features such
as wide open eyes, lips apart, and forehead wrinkles, but that the low-level visual
qualities were unrelated to search efficiency. The use of inverted faces as controls holds
facial features and physical characteristics constant, while presumably changing the
speed of image processing or way the image is processed.
There are two explanations for different task performance when faces are
inverted: 1) inverted face processing is a different process than upright face processing;
2) inverted and upright faces use the same process, it is just slower and more effortful
for inverted faces. Farrah et al. (1995) conducted some of the early work in support of
12
Gathering emotional information from a human face is an expert process for
most, one that we do every day. Although this process may feel automatic, evidence
that emotional processing does require cognitive resources comes from studies
showing that attentional demands from a secondary cognitive task reduce the effects of
emotional faces (Ethral et al., 2005; Okon-Singer et al., 2007).
However, the cognitive demands of emotional processing are low. In the lab,
humans can reliably identify emotional expressions when they are shown for only
100-150 ms (Calvo & Marrero, 2009; Esteves & Ohman, 2008). ERPs show very early
modulations in response to emotional versus neutral faces (Eimer & Holmes, 2002;
Eimer & Holmes, 2007). Emotional faces grab attention even when they are task
irrelevant, as seen by slower singleton identification (Hodsoll, Viding, & Lavie, 2011),
increased attentional blink (Bach, Schmidt-Daffy, & Dolan, 2014), and slower reaction
times in a spatial cueing task (Okon-Singer, Tzelgov, & Henik, 2007). These incredibly
fast emotion effects due to emotional faces suggest that processing the emotion on a
human face is a low-load task. Therefore, when there is no attempt to modulate
attention or perform another task, upright emotional faces provide an excellent way to
test the effects of emotion with little consumption of cognitive resources.
Emotional processing. Several paradigms, including emotional priming of
popout (Lamy et al., 2008) and threat biased saccades (Bannermann et al., 2009), show
differential task performance due to valence for upright, but not inverted, faces. Findings
such as these are interpreted as evidence that the effects are due solely to the
emotionality of the face and not to any featural or low-level visual differences between
13
However, experiments that investigate the effects of orientation on emotional
face processing suggest that inversion effects are not always present in behavioral and
neuroimaging measures. Using the same battery of faces that were used in the current
experiments, Lipp, Price, and Tellegen (2009) found no effect of inversion on detection
times in visual search for emotion, or on measures of explicit and implicit evaluations of
the expressions of the faces.
Bannerman et al. (2008) found that accuracy was better for upright versus
inverted emotional faces. However, the accuracy for recognizing the target expression
in the inverted condition was still at approximately 80% and there were no differences in
response times between upright and inverted faces. Lamy et al. (2008) found no
inversion effects on visual search for an emotional singleton in either accuracy or
reaction time measures. Emotional information can still be gleaned from inverted faces,
even though it is often slowed and less accurate compared with upright face processing.
The finding that inversion does not totally prevent identification of facial
expressions is not surprising given the findings on featural processing in inverted faces
and upright emotional faces. Inverted face processing relies more heavily on features,
not holistic information, than upright face processing (Farah, Tanaka, & Drain, 1995;
Searcy & Bartlett, 1996). Calvo and Marero (2009) found that specific facial features
played a role in the effects of emotion on visual search performance. Therefore, it is
reasonable to expect that information about the emotion displayed on inverted faces
14
Once an expression has been recognized, it has the potential to influence later
processing. It just may take longer for these influences to manifest because it takes
longer to recognize emotion from an inverted face.
Pain modulation is an excellent vehicle to test the theory that upright and inverted
faces have the same qualitative effect on later processing. It is well established that
emotional stimuli can influence pain ratings, but this study will seek to determine if the
additional cognitive load of inverting faces will interact with the emotional modulation.
Speeded manual responses and ERPs that are elicited less than a second after
stimulus presentation may be more sensitive to the effects of inversion, whereas the
slower identification of inverted facial expressions may still have time to influence
perception of a noxious heat pulse lasting 4s. Therefore, it is not unreasonable to
suspect that there could be emotional modulation of pain even with inverted faces.
Including upright and inverted faces allows conclusions to be drawn about the effects of
emotion and distraction on pain perception, as well as on the extent of emotional
information available from inverted faces.
Pain modulates emotional reactions to valenced stimuli
The focus of most pain studies is on factors that modulate pain, with the end goal
of applying the findings of the research to reduce suffering in those with acute and
chronic pain. Often, the effect of pain on the task at hand is overlooked. In order to fully
understand the forces that interact with the processing of noxious stimuli, it is important
to understand both directions of the relationship. Anecdotally, pain is known to lower
mood and disrupt cognition, observations that have experimental support. Pain has
15
Buhle & Wager, 2010). Emotional decision making, along with these cognitive failures,
is also disrupted by pain (Apkarian et al., 2004).
Several experiments have demonstrated the ability of pain to modulate emotional
processing. Godinho and colleagues (2008) compared valence ratings to images during
painful electrical shocks versus innocuous vibrations. The images were taken from the
International Affective Picture System database as well as from other sources. The
variety of pictures included scenes (e.g., pleasant: waterfalls, unpleasant: car
accidents), objects (e.g., pleasant: sports cars, unpleasant: guns), or humans (e.g.,
pleasant: erotic, unpleasant: suicide attempts). Each block contained 3 pictures
matched on valence (pleasant, unpleasant, or neutral). Blocks of pleasant images were
rated as significantly less pleasant during pain conditions than non-pain conditions.
Ratings of unpleasant and neutral blocks did not differ between pain conditions.
Although Godhino’s stimuli were not exclusively images of faces, faces were
included in the images of the human body. Gerdes, Wieser, Alpers, Strack, and Pauli
(2012) investigated the influence of pain on the valuation of faces in particular. Valence
and arousal ratings of emotional faces were not changed when the face was paired with
a painful pressure stimulus.
Gerdes et al. also recorded facial EMGs made in response to the pictures.
Participants were told to either make a compatible face (e.g., smile in response to a
pleasant expression) or an incompatible expression (frown in response to a pleasant
expression). Pain slowed both the compatible and incompatible facial movements to
happy faces, but did not affect facial movements in response to unpleasant
16
found, both studies found that pain only disrupts processing of positively valenced
stimuli.
In another study (Wieser, Gerdes, Greiner, Reicherts, & Pauli, 2012), this
research group investigated how pain affects facial processing using ERPs, instead of
EMGs. Again, there were no differences in affective ratings between faces viewed
during a painful versus non-painful pressure stimulus. Corroborating the behavioral
ratings, there were no pain- related differences in ERPs that reflect affective facial
processing (N170, EPN). However, pain did disrupt measures of attention to faces at
both early (P100) and later (LPP) stages.
It seems from the studies reported thus far (Gerdes et al., 2012; Reicharts et
al.,2013; Wieser et al., 2012) that pain does not change our ability to recognize the
strength (arousal) or value (valence) of emotional faces. Although this categorization of
facial expression seems impervious to the effects of pain, our reactions to the faces
(Gerdes et al.) and attention allocated to facial processing (as indexed by ERPs in
Wieser et al.) are modulated by pain.
CURRENT STUDIES
The purpose of the main experiment is to investigate how emotional faces
modulate the experience of pain by comparing the effects of emotional expression
(neutral, happy, angry, fearful), cognitive load (low-load: upright faces, high-load:
inverted faces), and the joint effects of affect and distraction on two components of pain
17
The experimental design allows for a test of facial expression by comparing pain
ratings made while viewing a neutral face to those made while viewing the other
expressions. This design controls for two possible cognitive effects. First, any orienting
effects of an on-setting visual stimulus are controlled for by the inclusion of a scrambled
face condition. Secondly, the comparison between upright and inverted faces is meant
to test the extent to which the cognitive load required to identify emotional faces
contributes to the modulation of pain by those stimuli. We must first make sure that
emotional information can be gleaned from inverted emotional faces to ensure that
differences are not due to a difference in available emotion information. It is also
important for the study aims that it is more difficult to identify an emotion on an inverted
versus an upright face. That is, emotion recognition accuracy should be lower for
inverted compared with upright faces and participants will have to expend more
cognitive effort for inverted, than upright faces. Toward that purpose, a pilot study was
conducted to determine the stimulus presentation time need to extract emotional
information from both upright and inverted faces with an accuracy level of at least 85%
for both orientation conditions, with upright faces having a significantly higher accuracy
rating.
Pilot Study
The purpose of this study is to shed light on how long it takes for emotional
information to be gleaned from an inverted face. This study seeks to equate emotion
identification accuracy between upright and inverted faces by adjusting the amount of
time the faces are viewed by participants. Results of this study will determine the
18 Method
Participants
Twenty nine subjects were recruited through the Psychology Research
Participant Pool and enrolled in the study. Participants were excluded from participation
if they had a mood disorder or if their vision was not normal or corrected to normal. The
first participant was deemed a practice subject and their data is not included in the
analysis. The remaining 28 participants (20 females) were between 18 and 25 years of
age (M=18.5, SD=.5). The experimental procedure was explained and written informed
consent was obtained before participation.
Materials and Procedures
Visual Stimuli. Faces were selected from the Facial Expressions of Emotion:
Stimuli and Tests (FEEST; Young, Perret, Calder, Sprengelmeyer, Ekman, 2002)
picture library. The images to be used in this study are taken from the Ekman 60 Faces
subset of the FEEST database. This subset includes black and white photographs of 6
females and 4 males portraying neutral, angry, disgusted, fearful, happy, sad, and
surprised facial expressions. These images were chosen for inclusion in the Ekman 60
Faces subset because the models’ expressions were the best recognized within the
FEEST database, based on accuracy in a forced choice recognition test.
This experiment included happy, angry, fearful and neutral faces from 5 female
and 4 male models. Original images were cropped so that only the face is visible, by
removing hair and the surrounding background from each image. All pictures were also
19
Questionnaires. Participants completed two pen and paper questionnaires. The
Demographic Information sheet asked the participant to report age, gender, ethnicity,
race, and dominant hand. Although the recruitment advertisement stressed that those
with mood disorders were ineligible for this study, The Beck Depression Inventory-II
(BDI-II; Beck et al., 1996) was administered as a further screening tool, as those with
depression have deficits in emotional face processing (Fales et al., 2008; Leppanen,
2006).This survey asks participants to answer 21 questions concerning their emotional
health. Information concerning on-campus emotional support resources was given to
participants both at consent and debriefing.
Pilot Task
The pilot task was administered after the questionnaires. There were 5
experimental blocks. In each block, a series of visual (upright or inverted faces) and
auditory (500 Hz pure tone) stimuli were presented concurrently. Participants were
instructed to maintain attention on the computer screen, even in the absence of a visual
stimulus, as they must provide feedback concerning the expressions on the faces.
While there are no faces onscreen, participants were instructed to fixate on a cross that
was on the computer screen at all times (except when a face is onscreen). When a face
appears onscreen, participants were instructed to attend to the face and were free to
move their eyes around the face in order to determine the expression on that face.
Trials were separated into blocks by the amount of time that the visual stimuli
were onscreen. There were five experimental blocks: with faces onscreen for 500ms,
750ms, 1000ms, 1500ms, and 2000ms. That is, all trials in each block included visual
20
In each block, there were 72 trials. Each facial orientation (upright and inverted)
was presented 36 times in each block. In each block, the 9 models appeared 8 times:
displaying neutral, happy, angry, and fearful expressions both upright and upside down.
Order of presentation was randomized within each block. Block presentation order was
counterbalanced across participants.
In order to simulate the distraction from a different modality that will accompany
and follow faces in the main experiment (i.e. heat pulses), an auditory stimulus was
paired with the visual stimuli on each trial. A 500 Hz pure tone onset with the visual
stimulus and lasted for 4s, regardless of how long the visual stimulus was onscreen.
The tone was presented over headphones at approximately 60 dbSPL.
Immediately following the offset of the auditory tone, the participant was required
to make a 4-alternative forced choice (4-AFC) judgment concerning the emotion on the
face. The participant clicked one of four buttons onscreen (neutral, happy, angry,
fearful) to make their choice for each trial. Instructions were given for the participant to
make the decision as quickly as possible, but there was no time limit for the decision.
The next trial began 5s after the participant made their choice.
When participants completed the experimental task, they were thanked for their
participation and debriefed as to the purposes of the study. Credit was assigned within
21 Results
Questionnaires
The BDI-II was administered to determine whether the current mood state of the
participant would be related to the ability to make emotional judgments of the visual
stimuli. Participants indicated the severity of 21 symptoms and the total score was
calculated by summing all responses such that a higher score indicates more severe
depression. A score between 0-13 indicates minimal depression, and all participants in
this study scored 12 or below (M=3.29, SD=3.59). Due to the low scores and the fact
that this predictor was not significant in the initial model, F (1, 26) = .70, p=.4092, it was
dropped from the final model.
Accuracy
Accuracy data was collected and analyzed for the 4-AFC response concerning
facial expression for each block. The primary measure of interest is the accuracy
difference in the upright and inverted expressions for each block or stimulus duration. A
repeated-measures general linear mixed model (GLM) was conducted using stimulus
duration, image orientation, and facial expression to predict emotion judgment accuracy,
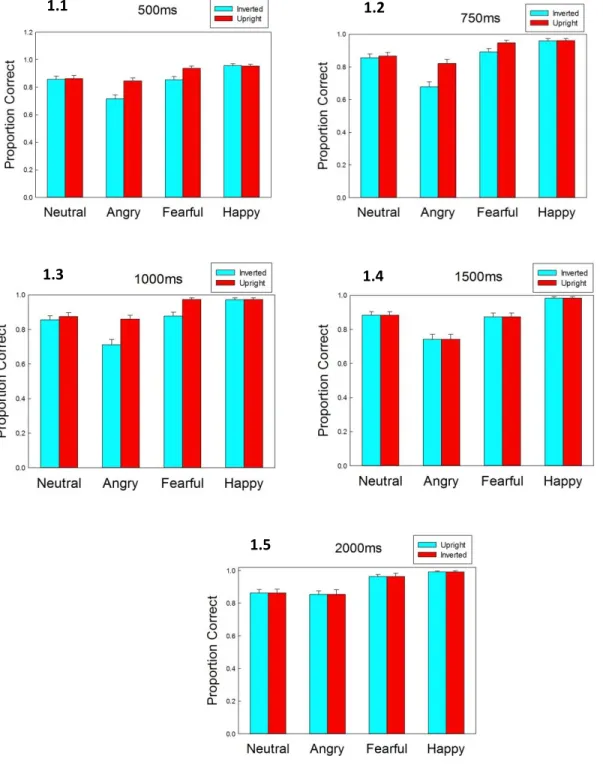
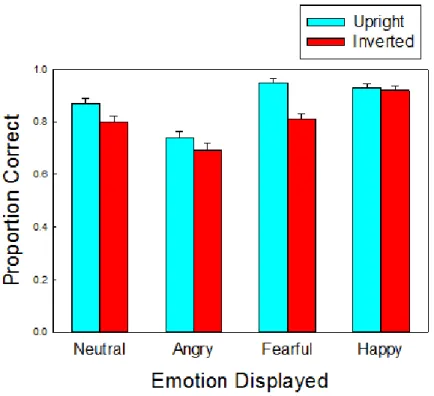
with participants as random intercepts. Figure 1 shows the proportion correct for each
22
Figure 1. Proportion correct in the expression categorization task by orientation and
facial expression when the image was presented for 500ms (1.1), 750ms (1.2),
1000ms (1.3), 1500ms (1.4) and 2000ms (1.5).
1.1 1.2
1.5
23
There was no effect of main effect of stimulus duration on emotion judgment
accuracy, F(4, 100) = 1.87, p=.1214 and no interaction of stimulus duration with either
orientation, F(4, 100) = 0.25, p=.9105 or expression F(12, 300) = 0.68, p=.7734.
There was a main effect of image orientation F(1, 27) = 76.08, p<.0001, such that
inverted faces (M=.857, SE=.009) were significantly less accurate overall than upright
faces (M=.9125, SE=.009).
There was a main effect of facial expression F(3, 81) = 163.58, p<.0001.
Post-hoc testing with Tukey’s adjustment shows that angry faces had significantly lower
accuracy than fearful t(81), -15.24, p<.0001, happy t(81), -21.07, p<.0001, and neutral
t(81), -8.79, p<.0001 faces. Neutral faces were less accurately recognized than fearful
t(81), -6.35, p<.0001 and happy t(81), -12.11, p<.0001 faces, while fearful faces were
not recognized as well as happy faces t(81), -5.77, p<.0001.
Discussion
The purpose of the pilot study was to determine whether emotional information
could be gleaned from inverted faces and to establish the stimulus timing for the main
experimental task. Overall accuracy was higher for upright compared to inverted faces,
which was to be expected because processing inverted faces has proven more difficult
in many other tasks (Lamy et al., 2008; Valentine, 1988; Yin, 1969). However, accuracy
for inverted faces was still very high, at 85.7% overall.
Interestingly, the small, but significant inversion effect did not differ across
experimental blocks. Accuracy for upright faces was not significantly higher when faces
24
This result is not surprising as previous research has shown the very fast recognition
(Calvo & Marrero, 2009; Esteves & Ohman, 2008) and effects (Blaison et al., 2012;
Payne, et al., 2010) of upright emotional face processing. What is surprising is that
emotional recognition is so high for inverted faces at both long (M= .87, SD=.34) and
short (M= .85, SD=.36) presentation times. Together, these results indicate that
emotional information can be gleaned from inverted faces very quickly, but that it is a
less accurate, and thus more difficult, process than when the face is upright.
Since the goal is to analyze the effects of emotion and cognition, it is important
that recognition of the faces is sufficiently high and that the visual stimulus is sufficiently
distracting. Since there were no differences in accuracy across block timing, it seems
that emotion recognition is sufficiently high regardless of the stimulus duration.
However, there are still several reasons to leave the visual stimulus on-screen for as
long as possible. First, it is important that the emotions on the faces are recognized if
they are to have a significant effect on pain ratings. Although there were no significant
differences, the trend was for higher accuracy at longer stimulus durations. This is
especially important so that inverted faces have the best chance for emotional
identification. Secondly, since we are interested in the distracting effects of the visual
stimuli, it is important that the faces overlap with the heat pain stimulus, which takes
time to reach the destination temperature. At short presentation times, participants
could attend to the face and then shift their attention to the heat pulse only after the face
had disappeared and the thermode had reached a noxious temperature. In that case,
25
stimulus will onset with the heat pulse and will last 2000 of the 4000ms duration of the
heat pulse on each trial of the main experiment.
Main Experiment
Method
Participants
Potential subjects were recruited through the Psychology Research Participant
Pool. Exclusion criteria included any chronic pain disorders, current damage or injury to
the right arm, diabetes, or a mood disorder. No potential participants met any of these
criteria. Participants were between 18 and 25 years of age and had normal or corrected
to normal vision. Sixty undergraduate students gave consent to participate and were
enrolled in the study. The first two participants were designated practice subjects and
their results are thus not included in the analysis. Data for five of the enrolled subjects
could not be collected due to equipment, software, or technical malfunctions. Two
subjects rated the heat pulses above the cutoff (over 90 on a 100 point scale) on the
first block which immediately ended their participation and resulted in no data from
those subjects. Of the remaining 51 remaining subjects, 11 were dropped from analysis
because they did not report the necessary level of pain (an average pain rating of
10/100 for the heat pulses with the highest temperatures). The final sample consisted
of 39 participants (24 females) between the ages of 18 and 25 (M=19.1, SD=0.97).
However, not all experimental blocks were included for every participant. Two
participants rated above 90 on the last experimental block; that block was immediately
26
participants) were not available for analysis due to a software failure that occurred
during those blocks. The experimental procedure was explained to all participants and
written informed consent was obtained. All aspects of the study were approved in
advance by the Institutional Review Board of the University of North Carolina at Chapel
Hill.
Materials and Procedures
Visual Stimuli. Faces in the main experiment were identical to the ones used in
the pilot experiment, with the addition of scrambled images. Scrambled images were
created using each actor’s neutral expression and were scrambled by Fourier phase
transformation, as in Calvo, Fernandez- Martin, Nummenmaa (2014). This image
processing technique randomly rearranges all pixels in the image, but does not change
the properties of the pixels. The resulting image therefore has the same size and
physical features as the original image, but is no longer recognizable as a human face.
In sum, the happy, angry, fearful and neutral faces of the 8 models were cropped and
presented both upright and inverted, while the neutral faces of each actor were
scrambled by pixel. The resulting image types, upright, inverted, and scrambled, are
necessary to answer the questions that have motivated this study.
Questionnaires. Participants completed three pen and paper questionnaires
after giving informed consent. The Demographic Information Sheet asked the
participant to report age, gender, ethnicity, race, and dominant hand. The Current Pain
Questionnaire asked the participant to rate the intensity and unpleasantness of their
pain over the past two weeks and at the time of testing. The Patient Health
27
the individuals. Although the recruitment advertisement stressed that those with mood
disorders are ineligible for this study, the PHQ was administered to further screen for
depression. Information concerning on-campus emotional support resources were given
to participants both at consent and debriefing.
Pain Threshold Determination. Following the questionnaires, pain thresholds
were determined. Heat pulses were delivered using a Medoc Neuro Sensory Analyzer
Model TSA-II. This apparatus creates painful heat pulses by applying a contact
thermode to the participant’s skin. The 1.6 cm2 thermode reaches the destination temperature at a rate of approximately 5oC/s. Temperature control is achieved using Medoc software to determine pain threshold and a LabVIEW (National Instruments
Version 2014) program during the experimental task.
Heat pain threshold was determined for each participant using the method of
limits. Heat ramps were delivered to the volar forearm using the contact thermode.
Starting from an adaptation temperature of 35oC, four successive ramps were delivered at a rate of 2oC/s. Participants press a button when the heat becomes painful. Between ramps there were a 30s delay and the thermode was placed on a different area of the
forearm for each trial. Thresholds were determined by averaging these four trials.
VAS practice. Following heat pain threshold determination, participants
practiced using the VAS to rate intensity and unpleasantness. Subjects practiced
making intensity and unpleasantness ratings on a visual analogue scale (VAS) in
response to sound clips. Participants heard 4 different sound clips from the International
Affective Database of Sounds (IADS; Bradly and Lang, 2007), each lasting 4s. Two
28
unpleasant, according to the normative ratings from the database. One sound of each
valence category (highly and mildly unpleasant) was presented at a high intensity
(software volume setting = 80) and the other two sounds were presented at a low
intensity (software volume setting = 50). After hearing each sound, the participant rated
the intensity (in terms of loudness) and unpleasantness by using the mouse to fill in a
VAS for each factor. Each VAS was in the shape of a rectangle presented on the
computer screen. The participant moves the mouse until the length of a red bar within
the VAS represents how intense and pleasant/unpleasant they found each sound. The
two scales were presented together onscreen. The top scale was the intensity scale,
anchored by No Sound and Most Intense Sound Imaginable. The bottom scale was the
unpleasantness scale, anchored by Not at all Unpleasant and Extremely Unpleasant.
Experimental Task. The main experimental task was administered after VAS
practice. A series of 4s heat pulses were presented either alone or with a 2000ms visual
stimulus (upright, inverted, or scrambled faces). Heat pulses and visual stimuli had the
same onset. Participants were instructed to maintain fixation on the computer screen,
even in the absence of a visual stimulus. Participants were instructed to attend to the
heat pulses and the visual stimuli, as they would rate both stimuli after each trial.
There are 10 types of trials (heat alone, heat with each upright facial expression,
heat with each inverted facial expression, and heat with a scrambled image). Each type
was presented 9 times for a total of 90 trials. These trials were grouped into 3
experimental blocks of 30 trials each.
Within each block, each trial type was presented twice in random order. Across
29
expression both upright and upside down as well as scrambled). Individual models
appear twice in each block, once upright and once inverted. The upright and inverted
face of each actor do not have the same expression within a block. The neutral
expression of each actor was scrambled. Two actor’s scrambled neutral images appear
in each block. This is done to control for the physical qualities of the stimuli as these
scrambled images are not recognizable as faces. Order of presentation was
randomized within each block.
Heat pulses were presented to 10 different sites on the volar forearm. Sites
measured 2cm2. There were two rows of stimulation sites. Each row included 5 stimulation sites. All sites were measured with a ruler and marked with a skin safe,
washable makeup pencil before the task began. Each site on the forearm was
stimulated twice per block. Each site was stimulated once before any site was
stimulated again and no site was stimulated in two consecutive trials. Order of
stimulation was pseudo-randomized for each of the 3 blocks for every subject to meet
the stipulations above. There were 2 minute breaks after the first and second blocks,
and the experiment concluded after the third block.
Heat pulses were delivered at either 1oC or 3oC above pain threshold or 2oC below pain threshold. Presenting two noxious temperatures along with an innocuous
temperature was meant to discourage participants from giving every heat pulse the
same intensity and unpleasantness ratings. All heat pulses were 4s in duration with
30
Following every heat pulse, two visual analogue scales appeared onscreen. The
top VAS was pain intensity (anchored by No Pain and Most Intense Pain Imaginable)
and the bottom was pain unpleasantness (anchored by Not at all unpleasant and
Extremely Unpleasant). Participants made intensity and unpleasantness ratings for the
heat pulse delivered on the preceding trial. There was no time limit for participants to
make these ratings. Following the VAS ratings, the participant then indicated which
emotion was present on the face by selecting one of five buttons (No Face, Scrambled
Face, Happy, Angry, Fearful, Neutral). There was no time limit to make the decision
concerning the face and the next trial began 5s after the judgment had been made.
When participants have completed the experimental task, they were thanked for their
participation and debriefed as to the purposes of the study. Credit was assigned within
24 hours of participation.
Results
Heat Pain Thresholds
Before the task began, heat pain thresholds were determined for each
participant. Thresholds were used to determine the temperatures used in the main
experimental task. This individualization was necessary because pain thresholds are
highly variable across individuals and the goal was to create a moderately painful
experience for each participant. Heat pain thresholds in our study show variability
31 VAS Practice
In order to become familiar with the rating system employed in the main
experimental task, participants first practiced using the VAS to rate the intensity
(loudness) and unpleasantness of four different sounds. Participants rated the two
sounds that were presented at a higher volume by the software (M=23.49, SD=18.33)
as significantly more intense than the two sounds that were presented at a lower
volume (M=14.00, SD=18.15), F(1,156) = 11.9, p=.0007. Participants also rated the
sounds with the lower normative pleasantness ratings as more intense (M=21.96,
SD=18.31) than those with higher normative pleasantness ratings (M=15.53,
SD=18.83), F(1,156) = 5.48, p=.02. However, these main effects are qualified by an
interaction of sound volume and pleasantness ratings F(1,156) = 5.48, p=.02, such that
the differences in intensity for sound volume were only significant when the sound was
highly unpleasant. Participants rated the two sounds that had lower normative IADS
pleasantness ratings as significantly more unpleasant than the two sounds with higher
normative pleasantness ratings, F(1,156) = 4.31, p=.04. Unpleasantness ratings did not
depend on the volume of the sound, F(1,156) = 3.82, p=.052, or the interaction between
pleasantness and volume, F(1,156) = 2.79, p=.10. These results indicate that the
participants were able to dissociate intensity and unpleasantness components of each
sound and to use the scales to accurately rate each component.
Questionnaires
The Current-Pain Questionnaire (CPQ), given prior to the delivery of any noxious
stimuli, assessed the intensity, unpleasantness, and location of any ongoing pain that
32
obtain the intensity and unpleasantness measurements, and subjects indicated on a
checklist where on their body any ongoing pain was located. Average pain intensity
(M= 3.9, SD=8.09) and pain unpleasantness (M=2.96, SD=6.58) ratings were low and
no participants reported current pain in their left arm. Most subjects gave negligible
ratings of pain intensity (Median=0, Mode=0) and unpleasantness (Median=0, Mode
=0), although 5 participants had current pain intensity levels of 20 or more. As current
pain intensity was not a significant predictor of pain intensity, pain unpleasantness, or
emotional judgment accuracy and as no participant indicated pain in the left arm,
current pain levels are not responsible for the results reported below.
The Patient Health Questionnaire was administered to determine whether the
current mood state of the participant would be related to the ability to make emotional
judgments of the visual stimuli. Participants answered a number of questions on a Likert
scale and the total score was calculated by summing all responses. The average total
was low (M= 2.45, SD = 3.11) and is below the total score for even mild depression
(score of 5) as assessed by this tool (Kroenke et al., 2001). This total score was added
as a predictor of pain intensity, pain unpleasantness, and emotional judgment accuracy.
As it was not significant in any model, it was dropped from further analysis.
Pain Ratings
Orienting hypothesis. In order to test the orienting hypothesis, a
repeated-measures general linear mixed model testing visual stimulus type (face, scrambled
image, no image) was conducted for pain intensity, pain unpleasantness, and proportion
correct. A random intercept for subjects was added to control for individual differences
33
the model to control for the rating changes that occur as a result of the three different
temperatures of the heat pulses. There were no significant differences between the
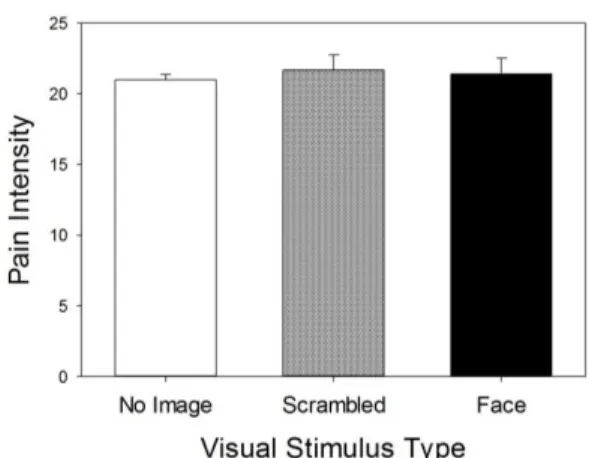
visual stimulus types in pain intensity (Figure 2), F(2, 78) = .85, p=.43, or pain
unpleasantness (Figure 3), F(2, 78) = 2.54, p=.09. As can be seen in Figure 4, there
was a main effect on accuracy, F(2,78) = 3.57, p <.01, such that the scrambled image
trials were more consistently identified than the no face trials, t(78) = 2.58, p=.03.
However, there was no difference in accuracy between the face and scrambled images
or between the face and no image trials. Therefore, the results cannot be explained
34
Figure 2. Pain intensity ratings by visual image type.
Figure 3. Pain Unpleasantness ratings by visual image type.
35
Emotion and Load. To test the effects of emotion, cognitive load, and their
interaction, a 2 (orientation: upright, inverted) X 4 (emotion: neutral, happy, angry,
fearful) repeated-measures mixed GLM was conducted for both pain components.
Again, the model included a random intercept for the subjects term, as well as a term for
the temperature of the noxious heat pulse.
For pain intensity, there was a significant main effect of temperature, F(2, 78) =
1003.55, p<.0001, such that both noxious temperatures were rated as significantly more
painful than the below threshold temperature and the highest heat pulse was rated as
significantly more painful than the lower noxious heat pulse. There was not a significant
main effect of orientation, F(1, 39) = .06, p=.81, but there was a significant effect of
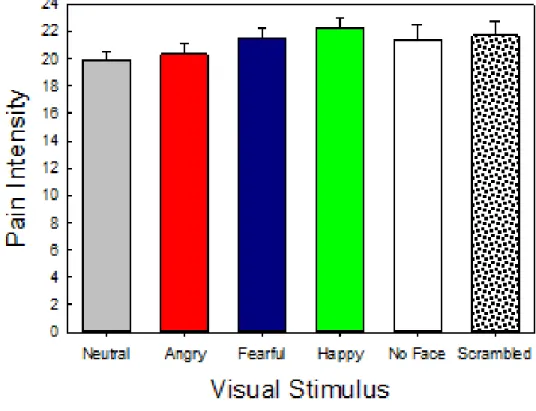
facial expression on pain intensity ratings, F(3,117) = 5.24, p=.002 (Figure 5). Post-hoc
testing using Tukey’s adjustment shows that this main effect was due to significantly
higher pain ratings during happy faces compared with neutral faces, t(117) = 3.63,
p=.0023.
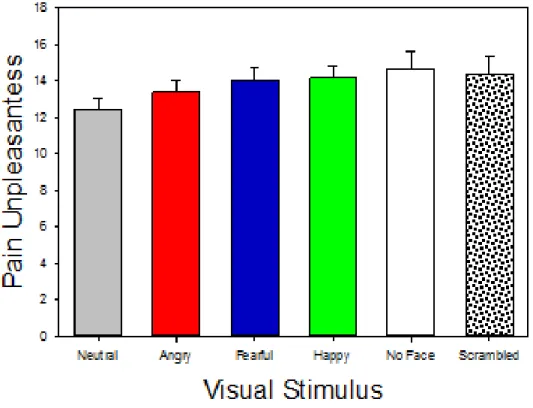
Pain unpleasantness (Figure 6) showed a very similar pattern to pain intensity,
which is not surprising considering the high correlation between these two components,
r=.79, p<.001. There was a main effect of temperature, F(2, 78) = 656.45, p<.0001, in
that higher temperatures had significantly higher unpleasantness ratings. There was no
effect of orientation, F(1,39) = .13, p<.72. There was a main effect of emotion, F(3,117)
= .3.35, p<.02, such that pain unpleasantness was significantly higher while viewing
36
Figure 5. Pain intensity ratings for upright and inverted faces with neutral, angry, fearful,
and happy expressions.
Figure 6. Pain unpleasantness ratings for upright and inverted faces with neutral, angry,
37
Identical analysis for pain intensity and unpleasantness were conducted using
only trials in which the subject correctly identified the emotion expressed in the image.
None of the statistical decisions were affected.
Since there was no effect of inversion, I collapsed those categories in order to
determine if the significant difference between happy faces and neutral faces was due
to an increase in pain due to viewing happy faces (compared with viewing no face) or a
decrease in pain when viewing neutral faces. As can be seen in Figure 7 (pain intensity)
and Figure 8 (pain unpleasantness), this effect was due to the decrease in pain while
viewing neutral faces. However, this only reached statistical significance for pain
unpleasantness, t(195) = -2.20, p = .03.
38
Figure 8. Pain unpleasantness collapsed across orientation category.
Emotion Judgments
Overall Accuracy. Accuracy data were collected and analyzed for the 4- AFC
response. A 4 (emotion: neutral, happy, angry, fearful) X 2 (orientation: upright,
inverted) repeated-measures mixed GLM was conducted on the accuracy of the
judgment task. There was no main effect of temperature, F(2,78) = 1.98, p=.14. The
significant main effects of emotion, F(3,117) = 43.02, p<.0001, and orientation, F(1,39)
= 25.10, p<.0001, were qualified by an interaction between the two terms, F(3,117) =
4.05, p=.009 (Figure 9). For both upright and inverted faces, anger (M=.75, M=.69) had
statistically lower accuracy than the three other facial expressions. However, the
interaction comes from the differences in upright and inverted faces concerning the
39
better at identifying fearful faces (M=.95) than neutral faces (M=.87), F(3,117) = 4.05,
p=.009. There was no significant difference between fearful and neutral accuracy for
inverted faces. However, happy (M=.92) faces were recognized with significantly greater
accuracy than both fearful (M=.81) and neutral (M=.80) faces when the images were
inverted.
Figure 9. Accuracy for upright and inverted faces with neutral, angry, fearful, and happy
expressions.
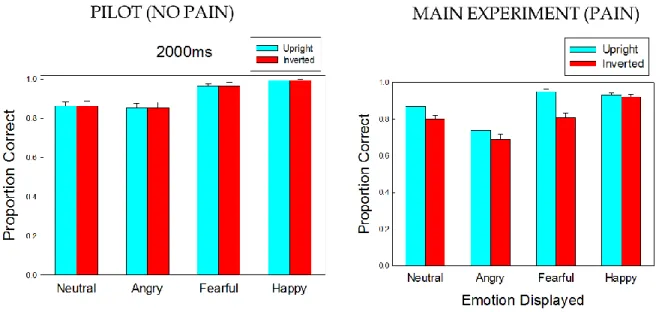
Effect of pain on accuracy. Although the temperature of the heat pulse did not
affect accuracy on a trial by trial basis, we wanted to determine if the presence of
noxious heat pulses reduced overall accuracy. To test this hypothesis, we compared
accuracy in the pilot study block in which faces were presented for 2s to accuracy in the
main experiment (Figure 10). In this way, we were able to test the differences in
40
not (pilot study). There was a significant main effect of presence of pain, with accuracy
being significantly lower when pain was present (M=.84) compared to when it was not
(M=.89), F(1,66) = 7.34, p=.009). Additionally, the presence of pain also affected the
accuracy patterns across the emotion and orientation manipulations. There was no
effect of orientation in the pilot experiment, but pain significantly lowered accuracy for
inverted facial categorization. In terms of emotion categorization, pain had an especially
negative effect on participant’s ability to recognize angry faces. In the main experiment,
but not the pilot, angry faces resulted in significantly less accuracy than even the neural
faces.
Figure 10. Comparison of pilot (no pain) with main experiment (pain) accuracy ratings.
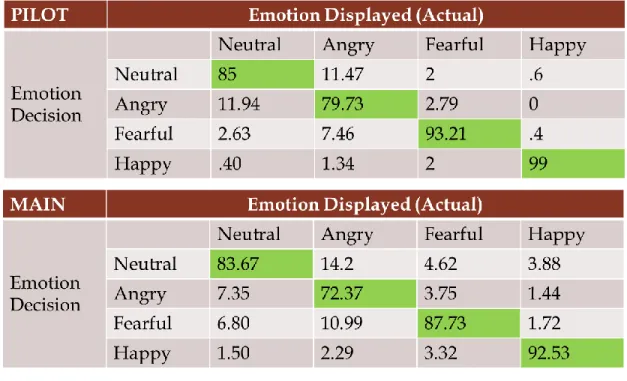
Confusion matrices. In a forced choice task such as this, it is important to
analyze the pattern of incorrect responses. The table below (Table 1) shows the
confusion matrices for both the pilot study and the main experiment. As stated above,
overall accuracy was lower for the main experiment. The main point of this table is that
41
on the emotion that was displayed. For instance, in the main experiment, angry faces
were often misidentified as neutral. However, the low incidence of this type of error for
fearful and happy faces indicates that participants were not simply choosing the
“neutral” option when they were unsure of the expression.
Table 1. Confusion matrices for pilot and main experiments.
Discussion
The purpose of this experiment was to determine if face processing modulates
pain perception and, if so, to determine whether that modulation is due to cognitive,
emotional, or a combination of cognitive and emotional factors. In order to answer these
questions, participants viewed emotional stimuli that were either high load (inverted
faces) or low load (upright faces) while a series of heat pulses were applied to their
volar forearm. Following each trial, ratings were given concerning the intensity and
42
stimulus. Happy faces resulted in the highest pain ratings and also had the highest
accuracy in the emotion categorization task. We conclude that viewing emotional faces
does not cause an emotional reaction in the participant that is strong enough to
modulate pain processing. However, the cognitive load associated with identifying the
emotional expression contained on each face is sufficient to reduce noxious processing
by means of distraction.
Image type
Previous experiments have been equivocal about the effects of facial processing
on pain perception. One possible reason for the discrepancies in the results is the
differences in experimental design. Several of the experiments (Yoshino et al., 2010,
2012) did not have a no-face condition, while others had no control for an on-setting
visual stimulus (Senkowski et al.; Reicherts et al.). This lack of control trials makes it
difficult to determine whether the results were due to the stimuli themselves or are
artifacts of the experimental design. In the present study, we included both no-face trials
and trials with a non-face, on-setting visual stimulus in order to control for these
experimental effects.
In order to exclude the possibility that the on-setting of the stimuli led to orienting
or distracting effects, ANOVAs were conducted to determine the effect of visual stimulus
type (Face, Scrambled Image, No Stimulus) on pain intensity, pain unpleasantness, and
accuracy. Although there was a significant difference in accuracy between scrambled
images and no-face trials, no other tests were significant. The lack of controls cannot
explain the discrepancy in findings between previous studies or the results of the