STRUCTURAL VARIATION AND THE EVOLUTION OF THE MOUSE GENOME
Andrew Parker Morgan
A dissertation submitted to the faculty at the University of North Carolina at Chapel Hill in partial fulfillment of the requirements for the degree of Doctor of Philosophy in the Department of
Genetics in the School of Medicine.
Chapel Hill 2017
Approved by:
Fernando Pardo-Manuel de Villena
Terry Magnuson
Leonard McMillan
Daniel Pomp
Thomas Petes
© 2017
ABSTRACT
Andrew Parker Morgan: Structural variation and the evolution of the mouse genome
(Under the direction of Fernando Pardo-Manuel de Villena)
Genetic variation in populations is governed by four basic forces: mutation, recombination,
natural selection and genetic drift. Mutation is the source of new alleles, which are assorted among
chromosomes by recombination. Selection and drift dictate the magnitude and direction of changes
in allele frequency over time. These forces are intimately linked to meiosis, and asymmetries in
meiosis create the opportunity for intragenomic conflict: competition between selfish alleles at the
same locus for transmission to progeny. Such conflicts manifest as selection at the population level
but subvert the Darwinian concept of fitness.
The aim of this thesis is to characterize three of the four basic forces — recombination, mutation
and intragenomic conflict — using the house mouse as a model system. I focus on the role of
large segmental duplications, long tracts of repeated sequence that make up approximately10%
of mammalian genomes and are the site of the preponderance of structural variation between
individuals. First I use two laboratory populations, the Collaborative Cross and the Diversity
Outbred, to analyze the effects of sex and genetic background on the rate of recombination. I
discover that (crossover) recombination is strongly suppressed in both sexes near large multiallelic
copy-number variants. Second I reconstruct in detail the evolution of one such variant,R2d2. I show
thatR2d2represents an ancient duplication that has been amplified to more than100copies in some
lineages of European mice. Alleles with high copy number (R2d2HC) are associated with suppressed
recombination but have an extremely high mutation rate. They are also selfish, having risen to
high frequency in wild and laboratory populations by meiotic drive, in spite of their deleterious
effect on reproductive fitness. Finally I perform a comprehensive survey of sequence and structural
variation on the mouse Y chromosome. I show that patterns of nucleotide and structural diversity
ACKNOWLEDGEMENTS
The work presented in this thesis was possible only through the advice, support and material
contribution of many faculty, trainees and staff at the University of North Carolina and elsewhere.
Many individuals deserve my thanks; any omissions are by fault of memory.
I am foremost grateful to my adviser, Fernando Pardo-Manuel de Villena. His generosity, deep
enthusiasm for science, high expectations and relentless eye for detail have shaped my development
as a scientist and prepared me well for the future.
I was fortunate to work alongside many talented students, postdocs, researchers and staff in
the Pardo-Manuel de Villena group and the Department of Genetics: David Aylor, Tim Bell, Ryan
Buus, John Calaway, Mark Calaway, Sarah Cates, Amelia Clayshulte, Jim Crowley, John Didion,
Lauren Donoghue, Marty Ferris, Justin Gooch, Pablo Hock, Leeanna Hyacinth, Samir Kelada,
Yunjung Kim, Colton Linnertz, Rachel McMullan, Darla Miller, Randy Nonneman, Dan Oreper,
Corey Quackenbush, Nikki Robinson, Paola Gusti-Rodriguez, Allison Ryan, Ginger Shaw, John
Shorter, Pat Sullivan, Wei Sun, Will Valdar, Brit Wanstrath, Lucy Williams and Vasyl Zhabotynsky.
Regular interactions with the group of Leonard McMillan in the Department of Computer
Science have been a valuable part of my training: Matt Holt, Seth Greenstein, Jeremy Wang,
Shunping Huang, Chen-Ping Fu, Katy Kao, Catie Welsh, Sebastian Sigmon and Maya Najarian.
Through my adviser’s collaboration with Gary Churchill I have enjoyed working with several
researchers at the Jackson Laboratory: Dan Gatti, KB Choi and Chris Baker.
I am grateful for the guidance of my thesis committee: Terry Magnuson (chair), Leonard
McMillan, Daniel Pomp, Thomas Petes and Gary Churchill.
My studies would not have been possible without funding from the Bioinformatics and
Com-putational Biology Training Grant, the Medical Scientist Training Program, the Center for Genome
Dynamics, the Mutant Mouse Resource and Research Center, the National Institute of Allergy and
Infectious Disease and the National Institute of Mental Health. I thank the administrative staff in
Regan and Carol Herion, for their patience and support.
I thank Todd Vision, Mark Heise and the late Gene Orringer for providing opportunities for me
to get started in research as an undergraduate.
Finally, I am grateful for the continued love and support of my family, particularly my wife
TABLE OF CONTENTS
LIST OF FIGURES . . . xii
LIST OF TABLES . . . xv
1 INTRODUCTION I: THE MAMMALIAN GERMLINE . . . . 1
1.1 Meiosis: from diploid to haploid . . . 1
1.2 Gametogenesis in mammals . . . 4
1.2.1 Sex determination . . . 4
1.2.2 Oogenesis . . . 5
1.2.3 Spermatogenesis . . . 6
1.3 The nature of germline genetic variation . . . 8
1.3.1 Small-scale sequence variation . . . 8
1.3.2 Sub-chromosomal structural variation . . . 9
1.3.3 Sex differences in mutation rates . . . 13
1.4 Genetic variation in populations . . . 15
1.4.1 Genetic drift . . . 15
1.4.2 Genetic diversity and population size . . . 15
1.4.3 Effects of natural selection . . . 16
1.5 Methods for characterizing genetic variation . . . 17
1.5.1 The role of reference genomes . . . 17
1.5.2 Microarrays . . . 18
1.5.3 Whole-genome sequencing . . . 19
2 INTRODUCTION II: THE MOUSE AS A MODEL FOR GENOME EVOLUTION . . . 21
2.1 The mouse among rodents . . . 22
2.2.1 Taxonomic status of mouse lineages . . . 24
2.2.2 Speciation and hybrid zones . . . 25
2.3 Origins of laboratory mice . . . 25
2.3.1 Ancestry of classical inbred strains . . . 26
2.3.2 Wild-derived strains . . . 26
3 STRUCTURAL VARIATION AND RECOMBINATION IN THE MOUSE GERMLINE 29 3.1 Introduction . . . 29
3.1.1 Molecular basis of recombination . . . 31
3.1.2 Broad-scale control of recombination . . . 33
3.1.3 Fine-scale control of recombination . . . 34
3.1.4 Methods for studying recombination . . . 35
3.1.5 The Collaborative Cross and Diversity Outbred populations . . . 36
3.2 Results . . . 37
3.2.1 The CC and DO provide complementary views of recombination . . . 37
3.2.2 Rate and distribution of crossovers differs by sex . . . 48
3.2.3 Sex-linked loci have large effects on recombination rate . . . 50
3.2.4 Advanced paternal age increases recombination rate . . . 54
3.2.5 Crossovers are enriched in known hotspots . . . 57
3.2.6 Crossovers are suppressed near large structural variants . . . 62
3.2.7 Coldspots have epigenetic features of inactive chromatin . . . 70
3.2.8 Coldspots are not unique to the rodent lineage . . . 73
3.3 Discussion . . . 74
3.3.1 Sex differences in recombination . . . 74
3.3.2 Effects of paternal age on recombination . . . 76
3.3.3 Recombination-rate variation and speciation . . . 77
3.3.4 The relationship between structural variation and recombination . . . 79
3.4 Conclusions and future directions . . . 81
3.5.1 Mice . . . 82
3.5.2 DNA preparation . . . 82
3.5.3 Genotyping . . . 82
3.5.4 Haplotype reconstruction . . . 83
3.5.5 Pedigree reconstruction in the DO . . . 84
3.5.6 Estimation of genetic maps in the G2:F1 . . . 84
3.5.7 Estimation of genetic maps in the DO . . . 84
3.5.8 Estimation of genetic maps in intercrosses . . . 86
3.5.9 Models for crossover interference . . . 86
3.5.10 Models for recombination rates . . . 87
3.5.11 Identification of recombination coldspots . . . 87
3.5.12 Whole-genome sequencing in the DO . . . 88
3.5.13 Discovery and genotyping of CNVs . . . 88
3.5.14 Analyses of ChIP-seq data . . . 89
3.5.15 Test for enrichment of sequence features . . . 89
4 EVOLUTIONARY FATES OF A LARGE SEGMENTAL DUPLICATION INMUS . . . . 90
4.1 Introduction . . . 90
4.2 Results . . . 92
4.2.1 Duplication ofR2dinMusancestor . . . 92
4.2.2 Copy number polymorphism atR2d2 . . . 98
4.2.3 Sequence and structural diversity nearR2d2 . . . 102
4.2.4 R2dcontains the essential geneCwc22 . . . 104
4.2.5 Expression patterns ofCwc22paralogs . . . 107
4.2.6 Non-allelic gene conversion betweenR2d1andR2d2 . . . 111
4.2.7 High copy number atR2d2suppresses meiotic recombination . . . 114
4.3 Discussion . . . 117
4.3.1 Long-tract gene conversion . . . 118
4.3.3 Origin and distribution of an allele subject to meiotic drive . . . 121
4.3.4 Additional members of the CWC22 family . . . 121
4.4 Conclusions and future directions . . . 122
4.5 Materials and methods . . . 122
4.5.1 Mice . . . 122
4.5.2 DNA preparation . . . 123
4.5.3 Whole-genome sequencing and variant discovery . . . 123
4.5.4 Copy-number estimation . . . 124
4.5.5 De novoassembly ofR2d2 . . . 124
4.5.6 Sequence analysis ofR2d2contig . . . 125
4.5.7 Microarray genotyping . . . 127
4.5.8 Analyses ofCwc22expression . . . 128
4.5.9 Phylogenetic analyses . . . 129
4.5.10 Analyses of recombination rate atR2d2 . . . 130
5 SELFISH SELECTION ON A STRUCTURAL VARIANT . . . 131
5.1 Introduction . . . 131
5.2 Results . . . 133
5.2.1 Evidence for a selfish sweep in wild mouse populations . . . 133
5.2.2 A selfish sweep in the Diversity Outbred population . . . 139
5.2.3 R2d2HChas an underdominant effect on fitness . . . 139
5.2.4 Selfish sweeps in other laboratory populations . . . 142
5.3 Discussion . . . 143
5.3.1 Why has theR2d2HCallele not fixed? . . . 143
5.3.2 Population dynamics of meiotic drive . . . 146
5.4 Conclusions and future directions . . . 147
5.5 Materials and methods . . . 147
5.5.1 Mice . . . 147
5.5.3 Microarray genotyping . . . 150
5.5.4 PCR genotyping . . . 150
5.5.5 Copy-number assays and assignment ofR2d2status . . . 151
5.5.6 Exploration of population structure in wild mice . . . 151
5.5.7 Scans for selection in wild mice . . . 153
5.5.8 Detection of identity-by-descent in wild mice . . . 154
5.5.9 Analysis of local sequence diversity in whole-genome sequence . . . 155
5.5.10 Estimation of age ofR2d2HC alleles . . . 156
5.5.11 Analyses of fitness effects ofR2d2HCin the DO . . . 156
5.5.12 Whole-genome sequencing of HR selection lines . . . 157
5.5.13 Null simulations of closed breeding populations . . . 157
5.5.14 Investigation of population dynamics of meiotic drive . . . 158
6 SEQUENCE AND STRUCTURAL DIVERSITY OF MOUSE Y CHROMOSOMES . . . 160
6.1 Introduction . . . 160
6.1.1 Origins of sex chromosomes . . . 161
6.1.2 The mouse Y chromosome . . . 162
6.1.3 Intragenomic conflict between the sex chromosomes . . . 164
6.2 Results . . . 164
6.2.1 A catalog of Y-linked sequence variation in mouse . . . 164
6.2.2 Phylogeography of Y chromosomes . . . 166
6.2.3 Sequence diversity and tests for selection . . . 168
6.2.4 Demography of male lineages . . . 171
6.2.5 Modes of copy-number variation on the Y . . . 174
6.2.6 Differentiation of Y-linked gene expression during spermatogenesis . . . 176
6.3 Discussion . . . 182
6.3.1 Phylogeography of mouse Y chromosomes . . . 182
6.3.2 What explains the deficit of Y-linked sequence variation? . . . 183
6.3.4 Equivocal support for hypothesis of X-Y intragenomic conflict . . . 186
6.4 Conclusions and future directions . . . 188
6.5 Materials and methods . . . 189
6.5.1 Alignment and variant-calling . . . 189
6.5.2 Size estimation of co-amplified regions of Yq and X . . . 189
6.5.3 Estimation of site frequency spectra . . . 190
6.5.4 Diversity statistics . . . 191
6.5.5 Demographic inference . . . 191
6.5.6 Analyses of gene expression . . . 192
7 CONCLUDING REMARKS . . . 194
7.1 Recombination in the male germline . . . 195
7.2 Structural variation and the “last frontier” of mammalian genomes . . . 196
7.3 Genetic conflict, structural variation and the sex chromosomes . . . 198
A ON THE NUMBER OF OBSERVABLE MEIOSES IN THE DIVERSITY OUTBRED . . . 202
A.1 On the number of observable meioses in the Diversity Outbred . . . 202
A.2 On the accumulation of recombination events in the Diversity Outbred . . . 203
LIST OF FIGURES
1.1 Overview of meiosis and gametogenesis . . . 3
1.2 Formation of structural variants via recombination . . . 11
2.1 Phylogenetic tree of the rodents . . . 23
2.2 Geographic dispersal of mouse subspecies . . . 24
2.3 Phylogenetic relationships between laboratory strains and wild mice . . . 27
3.1 Molecular basis of meiotic recombination . . . 32
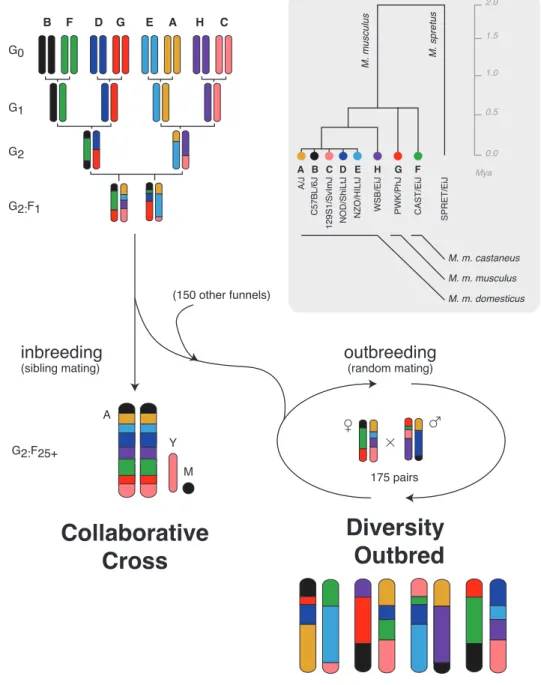
3.2 Breeding schemes for the Collaborative Cross (CC) and Diversity Outbred (DO) . . . 38
3.3 Assignment of crossovers to meiosis in G2:F1sibling pairs . . . 40
3.4 Accumulation of crossovers in the genomes of Diversity Outbred (DO) mice . . . 43
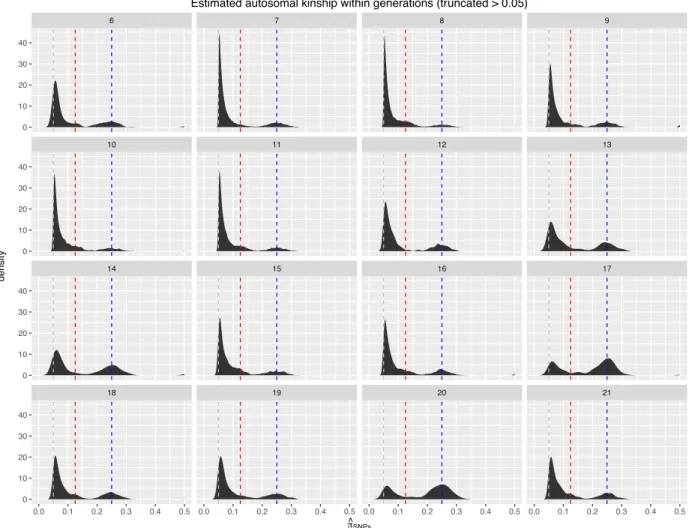
3.5 Distribution of relatedness within generations in the DO . . . 44
3.6 Joint inference of DO pedigree from and sharing of crossovers . . . 45
3.7 Comparison of kinship estimates from genotypes versus shared crossovers . . . 46
3.8 Comparison of unscaled cumulative recombination map in CC and DO . . . 47
3.9 Comparison of local recombination rates in the CC and rescaled DO maps . . . 48
3.10 Correlation between DO and CC maps as a function of scale . . . 49
3.11 Crossover interference differs between males and females in the CC . . . 50
3.12 Sex-specific recombination rates in the CC . . . 51
3.13 Crossovers are enriched in the distal portion of chromosomes in males . . . 52
3.14 Effect of Y chromosome haplogroup on recombination rate in males . . . 53
3.15 Effect of X chromosome genotype on recombination rate . . . 53
3.16 Effect of X-Y genotype combinations on recombination rate . . . 54
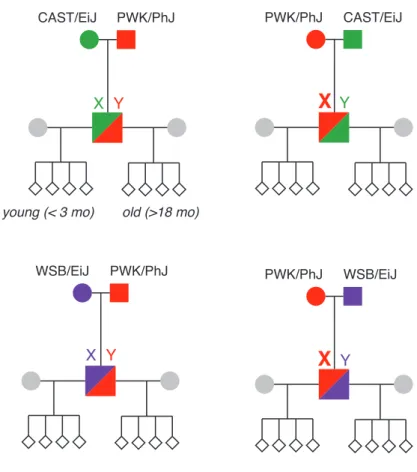
3.17 Pedigrees used to test paternal age effect on recombination . . . 56
3.18 Effect of age and X chromosome on male recombination . . . 58
3.19 Strategy for measuring pseudoautosomal recombination . . . 59
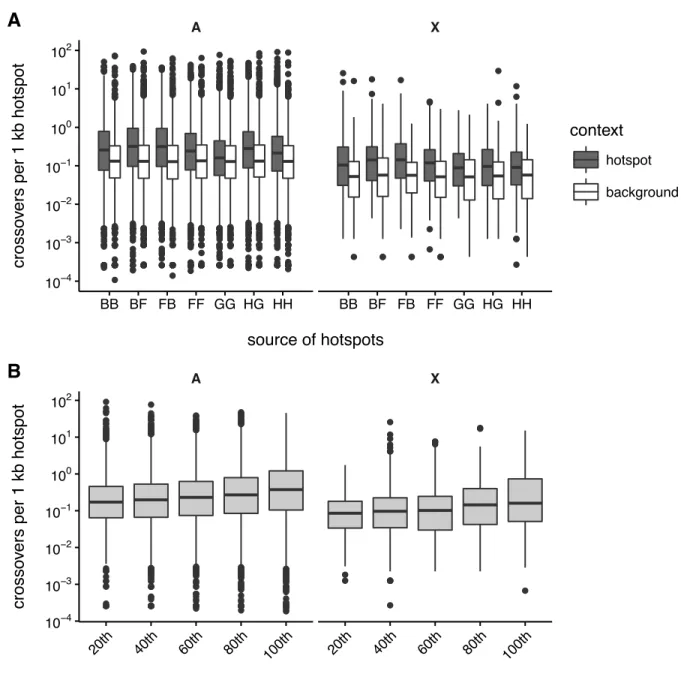
3.20 Recombination hotspot usage in the DO . . . 61
3.22 Recombination hotspot usage in regions of identity-by-descent in the DO . . . 63
3.23 Example of a recombination coldspot in the DO . . . 64
3.24 Genome-wide view of copy-number variability in the DO . . . 67
3.25 Genetic mapping of complex CNVs in the DO . . . 68
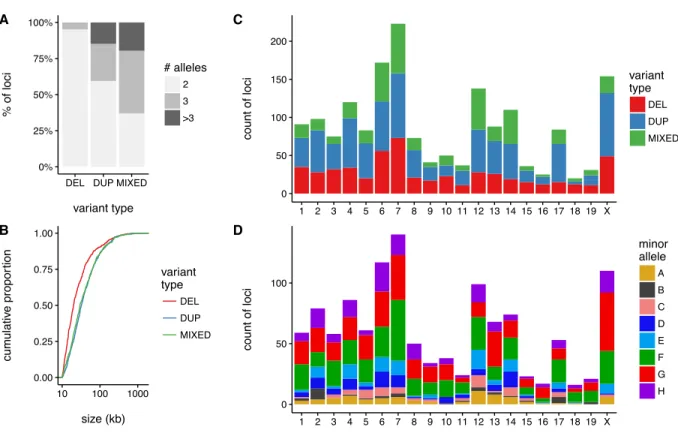
3.26 Properties of CNVs ascertained in the DO . . . 69
3.27 Biased distribution of crossovers in the vicinity of coldspots . . . 71
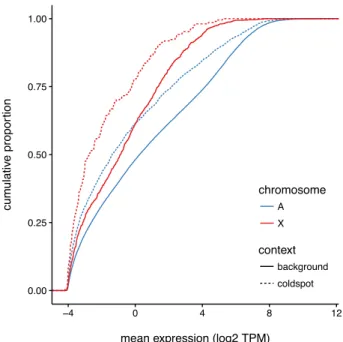
3.28 Gene expression in coldspots in male germ cells . . . 72
3.29 Epigenetic marks in coldspots in male germ cells . . . 73
3.30 Sex-specific recombination rates in the domestic dog . . . 75
3.31 Recombination coldspots in the domestic dog . . . 75
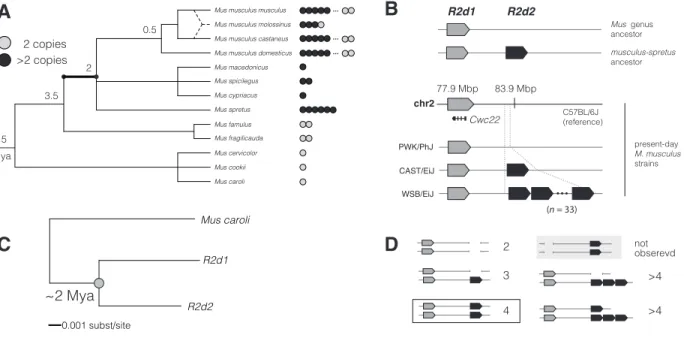
4.1 Origin and age of theR2d2duplication . . . 93
4.2 Conservation of synteny aroundR2d1 . . . 94
4.3 Targetedde novoassembly using the msBWT . . . 96
4.4 Sequence ofR2d1vsR2d2 . . . 97
4.5 Copy-number variation ofR2din mouse populations worldwide . . . 100
4.6 Rate ofde novocopy-number changes atR2d2 . . . 103
4.7 Sequence and structural diversity aroundR2d2 . . . 105
4.8 Cwc22paralogs in the mouse genome . . . 106
4.9 CWC22 protein tree . . . 108
4.10 CWC22 protein alignment . . . 109
4.11 Expression ofCwc22isoforms . . . 110
4.12 Signatures of non-allelic gene conversion betweenR2d1andR2d2 . . . 112
4.13 Physical linkage at boundaries of non-allelic gene conversion tracts . . . 113
4.14 Partial loss ofR2d2with structural rearrangement . . . 115
4.15 Suppression of crossing-over aroundR2d2in the DO . . . 116
4.16 Suppression of crossing-over aroundR2d2in other experimental crosses . . . 117
5.2 Haplotype-sharing atR2d2provides evidence of a selective sweep . . . 136
5.3 Haplotype-sharing on chromosome 2 (zoomed-in view) . . . 137
5.4 Local phylogeny atR2d2in wild mice . . . 138
5.5 Conventional tests for selection do not detect a sweep atR2d2 . . . 140
5.6 Selective sweep forR2d2HCin the DO . . . 141
5.7 R2d2HChas underdominant effect on fitness . . . 142
5.8 Selective sweep forR2d2HCin other laboratory stocks . . . 144
5.9 Fixation ofR2d2HCin wild-derived strains . . . 145
5.10 Population dynamics of a meiotic drive allele. . . 148
5.11 Validation ofCwc22qPCR assays . . . 152
6.1 Evolution of heteromorphic sex chromosomes . . . 162
6.2 Y chromosomes in mammals . . . 163
6.3 Structure of the mouse sex chromosomes . . . 165
6.4 Phylogenetic tree of Y chromosomes and mitochondrial genomes . . . 167
6.5 Definition and selection of models for patrilineal demographic history . . . 172
6.6 Marginal posterior distributions of key demographic parameters . . . 174
6.7 Structural variation on the Y chromosome short arm . . . 175
6.8 Structural variation on the Y chromosome long arm . . . 177
6.9 Genomic size of co-amplified gene families on X versus Y . . . 178
6.10 Sequence diversity across the X chromosome . . . 178
6.11 Y-linked gene expression in mice from thedomesticus-musculushybrid zone . . . 180
6.12 Y-linked gene expression in testes ofF1 hybrids. . . 181
6.13 X vs Y expression balance in testis for co-amplified gene families inF1hybrids. . . . 182
6.14 Phylogeographic relationships for Y chromosomes and mitochondria . . . 184
7.1 A strain-specific centromeric repeat . . . 199
LIST OF TABLES
3.1 Expectations for recombination in G2:F1pedigrees . . . 41
3.2 Total length of the autosomal genetic map by sex in the CC . . . 49
3.3 Number of genotyped progeny by cross and paternal age . . . 56
3.4 Observed recombination in PWK/PhJ×CAST/EiJ cross . . . 59
3.5 Sequence features associated with recombination coldspots . . . 65
4.1 Transposable elements inR2dparalogs . . . 95
4.2 R2dcopy-number status by geography . . . 101
4.3 De novomutations atR2d2 . . . 102
4.4 Regions ofR2dtargeted forde novoassembly . . . 126
5.1 R2d2HCallele frequencies in wildM. m. domesticuspopulations . . . 133
5.2 Candidate selective sweeps besidesR2d2 . . . 135
6.1 Wild and laboratory mice used for Y chromosome analyses . . . 166
6.2 Sequence diversity statistics . . . 169
6.3 Y-X and Y-autosome diversity ratios . . . 169
6.4 Population differentiation and divergence for sex chromosomes . . . 170
6.5 Hudson-Kreitman-Aguadé tests for neutral evolution of Y chromosomes . . . 170
CHAPTER 1
Introduction I: The mammalian germline
The aim of this thesis is to characterize three basic forces governing the level and distribution of
genetic variation in populations: recombination, mutation and intragenomic conflict. In particular
I focus on the role of large structural variants in repetitive regions of the genome and the ways in
which differences between males and females influence the accumulation of mutations and create
sex-specific opportunities for the spread of selfish genetic elements.
♦ ♦ ♦
The entirety of individual’s genetic information is transmitted to the next generation by a single
cell, the gamete. In most animal species, a dedicated population of cells — the germline — is
responsible for the production of gametes. Only mutations arising in the germline are heritable.
Although mutations arising in all other (somatic) tissues may have important consequences for the
organism — for instance, cancer — they are not transmitted, and neither contribute to the genetic
diversity of the population nor are subject to natural selection.
Patterns of genetic diversity in populations are therefore intimately connected to processes
that maintain the integrity of the genome during the series of cell divisions that ultimately lead
to functional gametes. In this section I review key features of germline structure and function
from an evolutionary perspective, with special attention to differences between males and females.
Although I focus on the properties of the germline in mammals, many of these properties are deeply
conserved across multicellular eukaryotes.
1.1 Meiosis: from diploid to haploid
Mammals, like most animals, are diploid and reproduce sexually, inheriting one copy of the
genome from each parent. In order to reproduce the organism must reduce the diploid genome to
ubiquitous among eukaryotic taxa and its key steps are conserved from higher organisms to the
simplest unicellular species (Figure 1.1). As the channel through which all genetic information
must flow from one generation to the next, the events of meiosis are of fundamental evolutionary
importance. Errors in meiosis are also clinically relevant, as they frequently lead to infertility and
developmental disorders.
Like mitosis, meiosis begins with a round of DNA replication in primary gametocyteswhich
are diploid (2N) and have a double complement of DNA (4C). Here the program diverges from
mitosis: replication is followed by a reductive division (meiosis I), in which the two members of
each homologous chromosome pair are segregated to daughter cells. Segregation of maternal and
paternal copies occurs independently and stochastically for each chromosome pair. The daughter
cells of the reductive division, thesecondary gametocytes, are haploid (1N) and no longer genetically
equivalent, but still carry a double complement of DNA (2C). At the second, equational division
(meiosis II), sister chromatids are segregated into gametes which are both haploid (1N) and carry a
single genome-equivalent of DNA (1C).
The segregation of homologous chromosomes during meiosis I provides the mechanistic basis
for Mendel’s two rules of inheritance: the “law of segregation”, which states that for each
chro-mosome either the maternal or the paternal copy is transmitted, but not both; and the “law of
independent assortment”, which states that this process occurs independently for each chromosome
pair. Mendel’s laws were based on empirical observations in breeding experiments long before the
details of meiosis were known, but they elegantly and accurately predicted patterns of inheritance
and formed the basis of the chromosome theory of heredity.
With few exceptions in animals, meiosis I is preceded by an extended prophase during which
some or all chromosomes undergorecombination, a tightly-regulated genetic exchange between
homologs inherited from each parent1. Recombination begins with the programmed introduction
of double-strand breaks (DSBs) at up to hundreds of sites per germ cell. One strand is enzymatically
resected at the free ends, and the resulting naked strands scan the homologous chromosome for
matching sequence. This homology search mediates chromosome pairing, a critical step of meiosis
I. A small subset (on the order of10%) of free ends form physical connections between homologous
chromosomes calledchiasmata. A chiasma holds members of the chromosome pair in tension
2N 4C
meiosis I meiosis II
1N 2C
gamete(s)
1N 1C
mitosis
2N 2C
15 dpc
7 dpc (puberty) (fertilization)
arrest
A
B
C
PGC primary
gametocyte secondarygametocyte
replication recombination
Figure 1.1: Overview of meiosis and gametogenesis. (A) General features of meiosis in eukaryotes.
A round of DNA synthesis occurs in primary gametocytes, derived from the primordial germ
cell (PGC) pool. Recombination occurs during the first meiotic prophase, followed by a reductive
division and then an equational division to produce up to four gametes per PGC. The total
chromosome number (N) and DNA complement (C) is shown for each stage. (B) Female meiosis
and oogenesis. PGCs have begin to differentiate by7dpc and meiosis begins by15dpc. Primary
oocytes arrest after forming chiasmata, and meiosis does not resume until after puberty (upon
ovulation). The second meiotic division is triggered by fertilization. Each division produces
one functional product and one polar body; the product of meiosis II is the mature oocyte. (C)
Male meiosis and spermatogenesis. The PGC pool in males continues to divide throughout life.
Meiosis is not initiated until puberty, but once it begins, it continues in orderly waves. Secondary
minimum of one chiasma per chromosome arm is generally required to ensure proper disjunction .
Aberrant disjunction leads to gametes with either too few or too many chromosomes (aneuploidy);
many aneuploidies are incompatible with life, and those that are not are associated with profound
developmental and reproductive defects.
Chiasmata are resolved as crossovers — reciprocal exchanges between the chromosome
sege-ments up- and downstream of the initiating DSB — during metaphase I. These crossovers enhance
the combinatorial mixing between parental genomes already induced by independent assortment.
The stochastic nature of the recombination process along chromosomes ensures that the haploid
genome of each gamete is a unique mosaic of the maternal and paternal genomes. By
gener-ating new combinations of alleles, recombination facilitates natural selection2. Variation in the
rate of recombination along the genome is an important determinant of haplotype structure in
populations3,4.
The process of recombination and its evolutionary significance is reviewed in more detail in??.
1.2 Gametogenesis in mammals
Meiosis is embedded in the process of gametogenesis — the production of sperm or oocytes —
in higher organisms. Because gametogenesis differs between the sexes, the regulation and timing
of meiosis also differs between males and females. To understand sex differences in gametogenesis
therefore requires a brief discussion of sex determination in mammals.
1.2.1 Sex determination
Placental (eutherian) mammals — those mammals besides marsupials (such as kangaroos)
and monotremes (platypus and echidna) — have a chromosomal system of sex determination.
Individuals with two X chromosomes are genetically female, and those with an X and a Y are
genetically male. The X and Y chromosomes are together referred to as thesex chromosomes(the
remaining pairs beingautosomes); they are the only chromosome pair in which the two homologs
are different in content and structure5. However, the mammalian embyro begins its development
with the potential to be anatomically and physiologically male or female: the precursors of both
male and female gonads are both present in the urogenital ridge regardless of sex chromosome
karyotype. In the absence of a Y chromosome, the gonad differentiates into an ovary. The presence
of a single factor expressed from the Y chromosome — the product of the geneSry(sex-determining
sex determinationis complete upon specification of the gonad by13.5days post-conception (dpc) in mouse. Remaining internal and external anatomical structures characteristic of each sex then
develop under the influence of hormones secreted by somatic cells in the gonad. Experiments
using mice with abnormal sex chromosome karyotypes were instrumental in demonstrating the
distinction between primary and secondary sex determination, and the role of the Y chromosome
in the former7.
Theprimordial germ cells(PGCs) that will give rise to the germline differentiate very early in
embryonic development, around8.5dpc in mouse and15dpc in humans8. By12dpc (mouse) or50
dpc (human) the PGCs have migrated into the developing gonad. Importantly, these steps precede
the process of primary sex determination, and indeed the eventual fate of PGCs as oocytes or sperm
depends on the sex of the somatic cells in the gonad and not the sex-chromosome karyotype of the
PGCs themselves. Once PGCs have reached the gonad the germline developmental programs of
females and males diverge.
1.2.2 Oogenesis
Female germ cells enter meiosis by15 dpc9, having undergone a total of approximately25
cell divisions since fertilization10. The entire pool primary oocytes — numbering in the tens of
thousands — undergoes recombination and the formation of chiasmata but arrest at the end of the
first meiotic prophase, and remain arrested until puberty (Figure 1.1B). Thereafter small cohorts of
oocytes are periodically released from meiotic arrest in synchrony with cyclic physiological changes
in the uterus (the estrous or menstrual cycle) in anticipation of pregnancy. Completion of meiosis
I is concurrent with ovulation. This division is asymmetric, producing one secondary oocyte
and a non-functional polar body. The secondary oocyte arrests again; meiosis II is triggered by
fertilization and is again asymmetric, yielding one mature oocyte and a polar body. Each primary
oocyte therefore gives rise to a single functional gamete and three non-functional products.
Two properties of mammalian oogenesis — the extended period of arrest during prophase I
and the asymmetry of both meiotic divisions — present challenges unique to females. The first is
to maintain the integrity of attachment to and alignment on the spindle apparatus for a period of
months to decades. Indeed, nearly all cases of aneuploidy in humans are of maternal origin, and the
risk of improper disjunction increases dramatically with maternal age11. Chiasmata, which allow
of chromosomes during meiosis I: nondisjunction is associated with decreased recombination in
several human trisomies12. Strong selection against aneuploidy may be responsible for the apparent
requirement of one crossover per chromosome arm in mammals13.
The second challenge to be addressed during female meiosis is a more teleological one. The
asymmetry of both meiotic divisions leaves open the possibility ofintragenomic conflict: a selfish
allele that can exploit the meiotic machinery to increase its probability of segregation to the oocyte
rather than the polar bodies can increase in frequency independent of its effect on organismal
fitness. This phenomenon of non-random segregation is calledmeiotic drive. True meiotic drive —
as opposed to other systems influencing the transmission ratio at a locus, such as selection against
a particular class of gametes — requires asymmetric meiotic division, an asymmetric meiotic
spindle, and functional heterozygosity at a locus that mediates interaction with the spindle14.
These requirements can be met in female but not male meiosis in mammals. The role of meiotic
drive in the evolution of a specific locus in mouse,R2d2, is the subject ofChapter 4of this thesis.
From a practical point of view, the fact that they key events in female meiosis occur while
the female herself is an early embryo make them quite difficult to study. The study of meiosis in
general, and recombination in particular, has benefitted greatly from model systems in which all
four products of a single meiosis can be observed simultaneously as a tetrad, as is the case in many
fungi (e.g. Saccharomyces cerevisiae,Neurospora crassa) and flowering plants (e.g. Arabidopsis thaliana).
The products of mammalian meiosis are not a tetrad, and heroic technical efforts are required to
recover the closest equivalent structure — an oocyte with its corresponding polar bodies — in a
mammal15. Knowledge of mammalian meiosis and recombination is therefore somewhat biased
towards the male germline.
1.2.3 Spermatogenesis
Whereas meiosis begins in females concurrent with early embryonic and gonadal development,
male germ cells do not enter meiosis until the onset of puberty. Instead, the PGCs differentiate into
a population of self-renewing stem cells calledspermatogoniathat undergo a period of arrest from
16.5dpc until the first week after birth. Thereafter they divide every8days for the remainder of life
(Figure 1.1C). The spermatogonia reside along theseminiferous epitheliumthat lines the basement
membrane of the tubules of the testis. They are nurtured by somatic cell lineages (Sertoli and
At puberty, spermatogonia enter meiosis in coordinated waves taking30−33days each in mouse. The resulting primary and secondary spermatocytes migrate towards the lumen of the
tubule in an orderly fashion with clearly-defined stages16. In fact, chains of spermatogonia (and
later spermatocytes) often form physically-connected chains that share cytoplasm as a syncytium.
The products of male meiosis are round spermatids, which further differentiate into mature
spermatozoa. In contrast to female meiosis, both meiotic divisions are symmetric in males, and a
single spermatogonium gives rise to four functional gametes.
The sex chromosomes present two challenges unique to male meiosis. First, proper segregation
of the X and Y chromosomes requires that they pair and recombine despite their very different
size and structure. In most mammals, pairing and recombination are restricted to a short region of
residual homology at the tips of the sex chromosomes called thepseudoautosomal regions(PAR)5.
(The human sex chromosomes are metacentric and have a PAR on each chromosome arm; the
mouse sex chromosomes are acrocentric and have a single PAR at the end of their long arms.) The
PAR thus becomes a site of intense crossover activity: the recombination rate per unit physical
distance is10−50times greater than on the autosomes.
The second challenge involves transcriptional control of the sex chromosomes during meiosis.
Expression of some Y-linked genes (includingZfy1and Zfy2) is toxic during meiosis and leads
to infertility17. As a result, transcription from the unpaired regions of the sex chromosomes is
epigenetically suppressed from late in the first meiotic prophase until after meiosis is complete. This
meiotic sex chromosome inactivation(MSCI) is absolutely required for fertility in mouse and is a special
case of the more general process ofmeiotic silencing of unsynapsed chromatin(MSUC)18,19. MSUC, in
turn, is thought to have evolved as a defense against transcription from selfish genetic elements in
the germline. The unpaired regions of the X and Y chromosome co-localize in a structure referred
to as thesex bodywhich is spatially distinct from the autosomes during late prophase and mediates
suppression of both transcription and recombination in these regions20.
Because male meiosis is symmetric with respect to cell fate, true meiotic drive cannot occur
in males. However, there are many cases of distorted transmission due to gametic selection in
heterozygous males, the prototypical example of which in mammals is the mouset-haplotype
(reviewed in Lyon21). These are two-component systems involving aresponderlocus, at which a
that is toxic in sperm carrying the wild-type allele22. Recombination between the responder and
distorter ablates drive; the two components are often tightly linked on a single chromosome and in
some cases held in complete linkage by an inversion23.
When transmission distortion affects the sex chromosomes it is known assex-ratio driveand
has particular evolutionary importance. Unequal transmission of the sex chromosomes in the
heterogametic sex (males, in mammals) may distort the sex ratio in the population, eventually
reducing mean fitness, and fuel intragenomic conflict between the sex chromosomes24. Sex-ratio
drive is thought to have played an major role in shaping the gene content of the mammalian sex
chromosomes25. I return to these ideas inChapter 6.
1.3 The nature of germline genetic variation
All heritable genetic variation arises by mutation in the germline. I briefly discuss the spectrum
of germline mutations — in increasing order of size from single-base substitutions to large-scale
rearrangements — and their relative rates, and how they differ between the male and female
germline.
1.3.1 Small-scale sequence variation
The simplest class of mutations is single-base changes (single-nucleotide variants, SNVs; or point
mutations). SNVs arise at a sex-averaged rate on the order of10−9−10−8per base per generation
(bp−1gen−1) in mammalian genomes. The current estimate for humans is1.2×10−8bp−1gen−1
and for mouse5×10−9bp−1gen−126. This equates to approximately30new mutations per haploid
gamete. SNVs are therefore by far the most frequent type of new mutations and the most abundant
class of variants between individuals in the population, accounting for>99.9%of known variants
in humans27.
Point mutations are dependent on DNA replication: they arise either as simple copying errors, or
via repair of damaged dinucleotide pairs. The rate of point mutation varies dramatically depending
on local sequence context, largely as a result of the susceptibility of different dinucleotides to DNA
damage (reviewed extensively in26). Transitions (swaps between nucleotides of the same chemical
class) are approximately two-fold more frequent than transversions (swaps between nucleotides of
different classes). Among transitions, mutations at CpG dinucleotides are approximately tenfold
more abundant than expected based on the number of CpGs in mammalian genomes. Current
patterns of within-population variation from recent large-scale surveys are in good agreement28.
Short insertion and deletion (indel) polymorphisms, operationally limited to polymorphisms
<10bp in size, are between seven- and ten-fold less abundant then SNVs in both humans27and
mice29. However, indels atmicrosatellitesequences — tandemly-arrayed repeats of1−8bp — arise
at a much higher rate. Mutation in microsatellites tends to occur in units of the underlying repeat
via slippage of DNA polymerase against the template strand. Mutation rate at microsatellites varies
over several orders of magnitude depending on the length of the tandem array and the size of the
repeat unit, with longer tracts of smaller repeat units being less stable in general30. Direct estimates
of microsatellite mutation rates in mouse31and human pedigrees32are similar, on the order10−4.
It should be noted that SNVs are much more readily detected than indels (especially at
mirosatel-lite loci) using current technologies. Structural variants, discussed below, are more challenging still.
The consequences of this ascertainment bias are discussed in more detail in§ 1.5. Existing catalogs
of sequence variation in organisms with large and complex genomes like those of mammals thus
offer an incomplete view of the true genetic diversity in populations33.
1.3.2 Sub-chromosomal structural variation
Mutations that alter the copy number, order or organization of kilobase- to megabase-sized
regions of the genome can be gathered under the umbrella ofstructural variants(SVs). These can be
subdivided intocopy-number variants(CNVs); rearrangements in the absence of changes in copy
number; and insertions or excisions oftransposable elements(TEs).
Copy-number variants (CNVs). CNVs are the best-characterized class of SVs, both in population
frequency and inde novorates. Although the mutation rate per generation for CNVs is estimated
to be lower than for SNVs (1.2×10⁻² per haploid gamete34), CNVs affect a much larger genomic
territory. Indeed the total number of base pairs which differ between two humans is as much as
100-fold larger for CNVs than SNVs35. Because of the larger footprint of CNVs, an individual CNV
is more likely to overlap functional elements of the genome including protein-coding genes than
an individual SNV or small indel. Mutations incompatible with embryonic development and live
birth will go unobserved in pedigree- or population-based studies. It is therefore important to note
that it is more difficult to deconvolute the effects of mutation from purifying selection for CNVs
The mutation rate for de novoCNVs varies by orders of magnitude along the genome. The sequence feature most strongly associated with copy-number mutation is the presence of existing
segmental duplications (SDs), operationally defined as duplications > 1 kb in size with > 90%
pairwise sequence identity34. More than half of currently-known CNVs segregating in the human
population are associated with SDs36, and SD-associated CNVs are larger and more likely to have
multiple alleles than otherwise37,38,39. The preponderance (5-10%) of SD content in mammalian
genomes and their polymorphism in populations were among the earliest and most striking
observations of the first era of genome-sequencing projects40,41,42,43. The CNV mutation rate at
some SDs in humans is high enough that similar mutations reoccur with detectable frequency
at the same loci. At least 50 such loci in the human genome are associated with developmental
or psychiatric disorders — 7q11 (Williams-Beuren syndrome), 11p15.5 (β-thalassemia), 16p11.2
(autism), 17q11.2 (neurofibromatosis type 1), 17p12 (Charcot-Marie-Tooth syndrome type 1A) —
collectively known as “genomic disorders”40.
CNVs associated with SDs are thought to arise primarily vianon-allelic homologous recombination
(NAHR), that is, illegitimate recombination between duplicated sequences44. NAHR was first
proposed as mechanism for changes in copy number by Sturtevant in 1925, studying thebarlocus
inDrosophila melanogaster45and was subsequently recognized as an important mechanism in the
expansion of gene families46. Exchange may occur between duplicates on the same chromatid,
resulting in deletion; or between sister chromatids or homologous chromosomes, yielding either
deletion or duplication plus a reciprocal product (Figure 1.2). Direct estimates of the relative
contribution of intra-chromatid versus chromosomal exchange in sperm suggest that
inter-chromosomal exchanges with the homologous chromosome predominate47. This indicates that,
at least at the CNV hotspots studied, SD-associated mutations are predominantly meiotic rather
than mitotic in origin. NAHR in mammals apparently requires tracts of uninterrupted sequence
similarity on the order of100bp in length48.
A subset of copy-number mutations are associated with SDs but are not “recurrent” in the sense
that the same breakpoints are not reused by independent mutational events. The mechanism(s)
underlying these mutations have more in common with those generating CNVs not associated
with SDs44. These non-recurrent CNVs may arise by one of a family of DNA-replication-based
del
dup
dup
wt
wt
wt wt
del
del
wt wt
wt
wt wt
wt wt
intra-chr
omosome
inter
-chr
omosome
A
B
C
D
Figure 1.2: Formation of structural variants via non-allelic recombination between duplicate
sequences. Duplicates are colored grey and either pink (maternal chromosomes) or blue (paternal
chromosomes). All four chromatids are shown. (A) Normal recombination with crossing over
between allelic duplicates. All four products are wild-type (wt). (B) Recombination with crossing
over between non-allelic duplicates on different chromosomes. Two products are wild-type and
the other two are a deletion (del) and its reciprocal duplication (dup). (C) Recombination between
two maternal sister chromatids. Paternal chromosomes are both wild-type while the maternal are a
deletion and reciprocal duplication. (D) Intra-chromatid recombination between non-allelic copies
on one maternal chromatid. Paternal chromosomes and the unaffected maternal chromatid are all
wild-type, while the affected maternal chromatid has a deletion. Unlike cases B and C, there is
no reciprocal duplication product. Note that alternative outcomes are possible if duplicates have
mechanisms — and the resulting CNV alleles — may become quite complex, involving multiple
double-strand breaks and switches in the repair template. Non-recurrent CNVs arising by aberrant
replication are, by construction, mitotic rather than meiotic events.
Rearrangements. Changes in sequence organization in the absence of changes in copy number
are among the most difficult class of mutations to detect. (In fact copy-number mutations, especially
those associated with SDs, frequently also involve rearrangement44.) From the point of view of
this thesis, the most important class of rearrangement isinversion51. Crossing-over is supressed
or completely absent across an inversion in heterozygotes because of spatial constraints on
chro-mosome pairing; when an (odd number of) crossover does occur, the resulting products are one
dicentric and one acentric chromosome, typically incompatible with stable segregation to gametes.
Inversions are extremely important in the processes of karyotype evolution and speciation52, and
in particular in the evolution of sex chromosomes53. These ideas are revisited inChapter 4and
Chapter 6.
Transposable elements. Approximately half of both the human54and mouse55reference genomes
are comprised of sequence corresponding to TEs. TEs are viruses and virally-derived fragments
that were actively replicating in the host germline at some point during its evolutionary history and
have integrated into the host genome. Although the biology of TEs is fascinating and appears to
differ between mammalian lineages, a full review is beyond the scope of this thesis. It suffices to say
that more than100,000polymorphic TE insertions have been identified in inbred strains of mice
and that most TE polymorphism — both insertion and excision — arises in the male germline56.
Because TEs can be collapsed onto a few ancestral sequence families, they are also calledinterspersed
repeats. Illegitimate recombination between TEs mediates some recurrent CNVs, although the
contribution is smaller than for SDs44.
Cytological markers. A final and class of genetic variation deserves mention: variation in
cytologically-visible markers of gross chromosome structure including centromeric
heterochro-matin57, “nucleolar organizer regions” (NORs; clusters of ribosomal RNA genes)58and
“homogeneously-staining regions”59. Although variation in chromatin-staining patterns has been historically
the relationship of cytological markers to underlying sequence changes is largely unknown. The
corresponding sequences are at best incompletely represented in reference genome assemblies
of both mouse and human. Their repetitive nature makes them refractory to accurate assembly
even with significant manual effort. Yet at least some of these genomic features are associated with
important phenotypes: variation in centromeres, for instance, directly influences the fairness of
chromosome segregation in meiosis14,61.
1.3.3 Sex differences in mutation rates
The rate and spectrum of mutation differs between the males and females as a direct
conse-quences of sex differences in germline physiology. The best-characterized patterns are the increased
risk of aneuploidy in oocytes discussed earlier in this chapter and the so-calledpaternal-age effecton
point mutations.
It has long been known that the recurrence risk of many Mendelian disorders with autosomal
dominant inheritance pattern — including Apert syndrome, Waardenburg syndrome, osteogenesis
imperfecta, neurofibromatosis, certain types of achondroplasia and (X-linked) haemophelia A —
increases with paternal age62,63. The observation originated from two early heroes in genetics,
Wilhelm Weinberg64and J.B.S. Haldane65. The correlation between parental ages induced by
nor-mal marriage patterns has historically made it difficult to independently estimate the contribution
of paternal versus paternal age to recurrence risk66. Furthermore, some have argued that the
paternal-age effect could be explained in part by spermatogonial selection67,68. This hypothesis is
based on the observation that tumor suppressors, growth factors or their receptors (e.g. FGFR3, a
fibroblast growth factor receptor, in achondroplasia) are overrepresented among the causative genes
for Mendelian disorders with a paternal-age effect. If ade novomutation confers a tendency for
spermatogonia to divide more rapidly, the mutation is more likely to be transmitted and observed
recurrence risk represents a conflation of mutation rate with spermatogonial growth rate. The
spermatogonial selection hypothesis also predicts a faster-than-linear increase in mutational burden
with age, a pattern which has been observed for a subset of disorders with a paternal-age effect63.
Recent large-scale sequencing efforts in non-disease human pedigrees have demonstrated
conclusively that the average mutation rate in the male germline is three- to four-fold higher than
in the female germline69,70,28. This is consistent with estimates based on comparisons between
but not maternal age70,28, with an extra one to two mutations trasmitted for each extra year of
age. A similar relationship exists for microsatellites32. Age-associated mutations are not uniformly
distributed across the genome but tend to occur in early-replicating regions and near genes28and
are thus more likely to have functional consequences.
It is less clear whether the rate ofde novostructural mutation differs between the sexes or is
related to age. At least two large cohort studies of intellectual disability or developmental delay
have reported an excess ofde novoCNVs of paternal origin and an increased burden ofde novo
CNVs in offspring of older fathers72,73. However, a strong maternal bias has been reported for
recurrent mutations at the autism-associated 16p11.2 locus74. Only one study (the Genome of
the Netherlands Project75) has estimated the rate ofde novostructural mutation in non-disease
pedigrees, and it found a two-fold excess of mutations on paternal versus maternal haplotypes. The
discrepancies between these results might be resolved by stratifying mutations according to likely
meiotic versus mitotic origin.De novoCNVs arising in or near existing segmental duplications —
perhaps by illegitimate recombination during meiosis — tend to show a more subtle paternal bias
and no age effect35. This implies that spontaneous mutations in regions of the genome susceptible
to recurrent CNVs, including loci associated with human disease, are less likely to be sex- or
age-biased. By contrast, non-recurrent mutations — presumably arising by mechanisms involving
errors of replication44— apparently occur more frequently in the male germline and are subject to
an age effect72. However, the empirical evidence for these patterns remains thin.
Sex differences in the rate and spectrum of spontaneous mutations seem to be parsimoniously
explained by the male and female germline discussed earlier in this chapter. Whereas all oocytes
have undergone an approximately equal number of cell divisions (25in mouse;40−50in human)
between their origin in the early embryo and fertilization, the stem cells of the male germline
continue to divide throughout reproductive life. The sperm of a 45-year-old man have undergone
at least tenfold more divisions than those of a 25-year-old man, even allowing for some variation in
the rate of cell division across different subtypes of spermatogonia76. All classes of mutations that
can be attributed to errors of DNA replication in actively-dividing cells are expected to increase
1.4 Genetic variation in populations
The level of genetic variation in populations is governed by four “fundamental forces:”
muta-tion, recombinamuta-tion, drift and selection77. So far I have discussed mutation and recombination and
their underlying biological basis at the individual level. In this section I introduce the remaining
two forces, which are population- rather than individual level processes. This discussion is not
meant to be exhaustive but rather to provide a starting point for discussion in the main chapters of
this thesis.1
1.4.1 Genetic drift
In a population of finite sizeN, allele frequencies change over time due to the stochastic effects
of sampling the next generation’s alleles from the current generation’s gametes. Every new allele
that arises by mutation has initial frequency21N, and in finite time it will either be lost or fixed. The
rate of drift can be summarized by the change in heterozygosity between successive generations
(δH). In a population of diploids:
δH = 1 2N
That is, genetic drift is more rapid in smaller populations. For neutral alleles, the the probability
of fixation is equal to initial frequency (pf ix = 21N79) and the expected time to fixationτ ≈4N80.
Genetic drift is accelerated byinbreeding, or mating between individuals sharing recent genealogical
ancestors.
1.4.2 Genetic diversity and population size
In an idealized population — a population which is constant in size, randomly-mating, sealed
off from in- or out-migraiton, and either hermaphroditic or having sex ratio at parity — there exists
an equilibrium at which the entry of new alleles from mutation is balanced by the exit of existing
alleles by drift. At this equilibrium levels of standing variation are proportional to the product of
mutation rate (µ) and population size (N). Formally, we can describe genetic diversity at a locus
1With the exception of some results of particular interest for which original references are cited, most of the material here
via thepopulation-scaled mutation rate(θ)):
θ=KN µ
whereKis a scaling factor. This scaling factor arises because the fundamental unit of inheritance is
the chromosome, not the individual: mutations arise on chromosomes, and they are transmitted on
chromosomes. Population size therefore depends on the number of transmissible chromosomes
at a locus. For a diploid organism with an X-Y sex chromosome system,K = 4for autosomes,
since each sex can transmit either member of each chromosome pair);K = 3for the X chromosome,
since females can transmit either of their two Xs and males can transmit one; andK = 1for the
uniparentally-inherited Y chromosome and mitochondrial genome.
When a population deviates from idealized assumptions, we can replace the census population
sizeN by theeffective population size,Ne. To a first approximation this parameter absorbs many
possibly-unknown demographic factors into a single value that allows us to describe the levels of
genetic diversity and drift we would expect if the true population were replaced by one of sizeNe
that conformed to idealized assumptions81,82.
Under the “infinite-sites” assumption, mutations do not occur at the same site twice, so every
new mutation creates a newsegregating site. The numberS of segregating sites in a sample of
chromosomes from the population can therefore be used to estimate genetic diversity83:
θ= P2NS−1
i=1 1/i
Under the assumption of random mating (i.e.random union of gametes),θis also an estimator
ofH, the expected heterozygosity at a locus.
1.4.3 Effects of natural selection
Natural selection decreases genetic diversity around the selected locus. Ongoing negative
selection against deleterious alleles purges those alleles and any linked variants from the population.
Positive selection increases the frequency of a beneficial allele; as the allele increases in frequency,
so do any linked variants on the same haplotype, leading to a local reduction in diversity termed a
is mitigated by recombination between that locus and the target of selection.
There are two notable exception to these rules. The first is so-called balancing selection, in
which selection favors the existence of multiple alleles in the population rather than any single
alleleper se. This may be the case at, for example, loci important in kin recognition and mate
choice, for which diversity at the population level promotes the avoidance of inbreeding85. Loci
under balancing selection and any linked haplotypes show an excess of polymorphism relative
to neutral expectations. The second exception ismeiotic drive, the transmission of alleles at
non-Mendelian frequencies. An allele subject to meiotic drive may rise in frequency and crowd out
other haplotypes, leaving a footprint indistinguishable from positive selection, while decreasing
host fitness. An example of just such aselfish sweepis discussed inChapter 5.
1.5 Methods for characterizing genetic variation
Empirical investigation of genetic variation in populations requires techniques to identify
variant sites and genotype them in multiple individuals. In this section I briefly review some
relevant methods for characterizing genetic variation, with a focus on methods for ascertaining
variants at whole-genome scale with high throughput. I emphasize the strengths and weaknesses
of different technologies and approaches rather than the details of their implementation.
1.5.1 The role of reference genomes
A reference genome sequence, orreference assembly, is a single, haploid, linear sequence taken to be (in some way) representative for the organism under study. Because genetic variation is
intrinsically relative, a reference sequence facilitates description of genetic variants by providing
both a common coordinate system for describing the location of alleles and a common baseline
against which to describe their sequence content. Reference genomes vary widely in quality and
completeness; the current references for mouse55and human86are the highest-quality references
among vertebrates. Both were constructed by capillary sequencing of700−1000bp reads from
genomic fragments cloned into bacterial or yeast vectors. These reads were assembled intocontigs
on the basis of sequence, and contigs intoscaffoldson the basis of orthogonal physical mapping
techniques. Scaffolds were grouped into chromosomes and ordered on the basis of physical
mapping and genetic mapping.
Although reference sequences are fundamental to the current practice of genomics, they may
several sources. First, for repetitive sequences with high copy number and high mutual similarity
— especially when the repeat period is longer than a sequencing read — there may not exist a single
optimal linear representation that can be extracted from sequencing data. High-identity repeats may
be collapsed to fewer than the true number of copies87. Second, some genomic regions segregating
in the population may be completely absent from the reference even in mature assemblies such
as human36. Third, regions that are present in the reference but have accumulated substantial
divergence from the individual(s) under study may lead to difficulties in interpreting the true level
of sequence polymorphism88. One of they main contributions of this thesis is to demonstrate that
several classes of biologically-important sequences are poorly represented in the mouse reference
assembly, and that interpreting variation in these regions requires looking beyond the reference
genome.
1.5.2 Microarrays
Genotypes can be ascertained for thousands to a few million biallelic SNVs at a time in a
single individual using oligonucleotide microarrays (“SNP chips.”) Genotyping arrays have been
used with great success in humans89and laboratory model organisms such as mouse90,91,92, and
the increasing availability of custom-designed platforms has expanded their utility to organisms
of agricultural or ecological interest93. Although there exist several competing technologies, all
genotyping arrays exploit the specificity of binding between synthetic olignonucleotide probes
immobilized on a chip and complementary sequences in sample DNA washed over the chip’s
surface. Relative binding of DNA fragments with the two possible alleles (labelled A or B by
convention) is converted to a fluorescence readout, and offline signal-processing algorithms are
used to render one of three possible genotype calls (AA, AB, BB). Assuming that most target loci
are present in the expected diploid copy number in a sample, the relative fluorescence intensity
from the A and B alleles can be used to infer the presence of copy-number variants94.2
Genotyping arrays are cost-effective and robust but their utility for population genetics is
2Design of microarray platforms tailored to diverse laboratory and wild mouse populations is a major research activity
in the Pardo-Manuel de Villena lab. The group participated in the design of the Affymetrix Mouse Diversity Array92
(2008) and led the design of three versions of the Illumina Mouse Universal Genotyping Array (MUGA)95(2010, 2012,
2015). I contributed to the design and led the validation of the third generation of MUGA95, and developed a software
limited by the fact that they interrogate only known variants. When array content is ascertained
in a representative sample with similar ancestry to the population under study, SNP genotypes
provide an accurate estimate of haplotype diversity and are useful for assessing population structure
and relatedness. Otherwise arrays are subject to ascertainment bias that may be quite strong97,98.
Array genotypes are generally not appropriate for estimating quantities that depend on knowing
the total number of segregating sites in a population or the full site-frequency spectrum, which
includes many estimators for genetic diversity.
1.5.3 Whole-genome sequencing
Direct sequencing of unselected genomic DNA is the workhorse technique of modern genetics.
Although it is common to refer to this family of assays as “whole-genome sequencing” (WGS), it
is more accurate to describe them asre-sequencingbecause they sidestep the extensive assembly
and validation efforts involved in the creation of a high-quality genome sequence. The aim of
re-sequencing is inherently comparative: the end product is an alignment between the sequences
of two or more chromosomes, from which variant sites and their respective alleles can be identified.
WGS has transformed our understanding of genetic variation in the human population27 and
among mouse strains29.
The typical WGS protocol involves four steps: (1) fragmentation of chromosomes into smaller
pieces collectively known as alibrary; (2) generation of sequence reads from the fragments; (3)
alignment of the reads to the reference,orassembly of the fragmentsde novo; and (4) identification
of sequence variants between samples and/or the reference genome99. The first two steps are
experimental and the last two purely computational. Nearly all sequencing protocols take a
shotgun approach, randomly fragmenting the whole genome and and sequencing the entire library
in parallel. With sufficient redundancy at the read-generation step, coverage of the entire genome
by at least some reads can be assured to a reasonable approximation100. Redundancy between
sequence reads also mitigates the effect of sequencing errors and allows accurate identification
of heterozygous sites in diploid samples. The level of sequencing redundancy is expressed as a
coverage factor: for example,4×coverage means that each site is covered by4reads, on average. WGS protocols can be broadly divided into two classes: short-read and long-read. The dominant
short-read platform at time of writing is Illumina. These instruments are capable of generating
and per-base error rates on the order of 10−3. Reads may besingle-end, representing one end
of a genomic fragment; orpaired-end, representing opposite ends of a single fragment (with or
without unknown sequence in between). Because of their short length, individual Illumina reads
are relatively uninformative. The first step in the analysis of Illumina data is therefore to produce
alignments of reads (read pairs) to a reference sequence. Variant sites are then identified from the
read alignments of one or more individuals.
Short reads from complex, repeat-rich genomes like those of mammals have important
limita-tions. First, unambiguous alignment of a read (read pair) to a single location in the reference genome
may not be possible when the read originates from repeat sequence. The problem is exacerbated
by sequencing error and by divergence between the reference genome and the sequenced sample.
Second, even paired-end reads provide limited information about sequence organization at scales
larger than a few kilobases. Deviations from expected read depth at a locus are informative for
copy number, but more detailed characterization of the order, orientation and divergence between
individual copies of repeats is rarely possible from short reads alone.
Long-read platforms include traditional capillary sequencing (low-throughput) and
high-throughput platforms such as PacBio and Oxford Nanopore. Read lengths are not uniform and
range from700bp (capillary) to20kb (PacBio). Unfortunately read length is inversely correlated
with throughput, per-base accuracy, or both. I do not make use of long-read sequencing in this
thesis, but I note here that long reads and short reads have complimentary properties. Long reads
are extremely valuable forde novo assembly, especially in structurally-complex regions of the
CHAPTER 2
Introduction II: The mouse as a model for genome evolution
The house mouse (Mus musculusLinnaeus 1758) — hereinafter simply “the mouse” — has been
a workhorse of both basic and applied biomedical research since the beginning of the twentieth
century. Mice have many favorable qualities for a model system: they are readily bred in captivity,
require little space, have short generation time, and are amenable to experimental manipulation.
Many aspects of mouse physiology and behavior are readily translated to humans. Mice have
been instrumental in the study of diverse physiological phenomena: transplant rejection101;
self-vs-nonself recognition in the immune system102; skin pigmentation and coat color103,104,105; sex
determination7; dosage compensation on the X chromosome of females106; resistance to oncogenic
viruses107; hormonal regulation of energy balance108,109; mutagenesis by ionizing radiation110; and
many others.
Mice have been a particularly important model system in genetics. Early crosses between
mouse stocks with different coat colors helped demonstrate that Mendel’s laws applied to animals
as well as plants and complemented ongoing work inDrosophilato demonstrate the chromosomal
theory of heredity (reviewed in111). (In fact, Mendel’s first experiments were with mice — until his
superiors deemed them unfit company for a monk112.) Establishment of the first inbred strains
in the early 1900s facilitated studies of the mechanisms of inheritance and linkage. The mouse
genome was only the second vertebrate genome to be sequenced, in 200255. Since that time an
extremely deep and continually-growing catalog of functional annotation has been overlaid on this
reference sequence113,114,115.
In addition to their merits as a laboratory organism, mice are also a valuable model for
evolu-tionary studies116. Traditional laboratory strains span relatively little genetic variation, and with
idiosyncratic distribution (discussed at length below), but wild mice and wild-derived strains
substantially expand the space of genetic and phenotypic variation available to researchers117,118,119.