2289
T
he effects of selective peroxisome proliferator-activatedreceptor (PPAR)-δ agonist GW501516 (EC50 of 1.2 nm±0.1 nmol/L and >1200-fold selective for the PPARδ receptor relative to α and γ) have demonstrated increases in high-density lipoprotein cholesterol (HDL-C), decreases in low density-lipoprotein cholesterol (LDL-C), and decreased triglyceride (TG) in preclinical studies1–5 and in an initial pilot
clinical study.6,7 However, to date, a more robust examination
of the lipid-altering effects of a PPARδ agent has not been examined in a human trial.
PPARs are members of the superfamily of nuclear ligand-inducible transcription factors which form heterodimers with retinoid X receptors and bind to consensus DNA sequences. There are 3 known PPAR isotypes: α (NR1C1), γ (NR1C3), and δ (also named β or NR1C2).3,8 Current knowledge of
these receptors indicates that they are involved in lipid and glucose homeostasis. Two of these receptors, PPARα and PPARγ, are targeted by commonly prescribed medications
for the treatment of dyslipidemia (fibrates) and type 2 dia-betes mellitus (glitazones), respectively. PPARα appears to mediate its effects via mechanisms within hepatic tissue, whereas PPARγ resides predominantly in adipose tissue. PPARδ is ubiquitous and has been shown to impart its effects in skeletal muscle although recent data suggest influences in the liver as well.9
It might be expected that an agent that enhances the catabolism of fat would reverse some of the lipoprotein effects in low HDL-C or metabolic syndrome-like subjects, in whom fat stores are particularly enriched. To explore this hypothesis, the first multidose, large-scale study to examine the effects of GW501516 on lipids in subjects with low HDL-C, a prominent feature of metabolic syndrome, was undertaken. A second small-scale exploratory study that was run in parallel provided a complimentary data set that further examined the impact of PPARδ treatment on lipoprotein particle characteristics.
Received on: December 17, 2010; final version accepted on: June 28, 2012.
From the GlaxoSmithKline Discovery Medicine, Philadelphia, PA (E.J.O., G.L.P., D.L.S.); and GlaxoSmithKline, Cardiovascular and Metabolic Medicine Development Center, Stockley Park, UK (N.P.J.).
Correspondence to Eric J. Olson, PhD, Mail Code UW2421, GlaxoSmithKline, 709 Swedeland Rd, King of Prussia, PA 19406. E-mail eric.j.olson@ gsk.com
© 2012 American Heart Association, Inc.
Arterioscler Thromb Vasc Biol is available at http://atvb.ahajournals.org DOI: 10.1161/ATVBAHA.112.247890
Objective—Peroxisome proliferator-activated receptor-δ–induced upregulation in skeletal muscle fatty acid oxidation would predict the modulation of lipid/lipoproteins.
Methods and Results—GW501516 (2.5, 5.0, or 10.0 mg) or placebo was given for 12 weeks to patients (n=268) with high-density lipoprotein (HDL) cholesterol <1.16 mmol/L. Fasting lipids/apolipoproteins (apos), insulin, glucose, and free fatty acid were measured; changes from baseline were calculated and assessed. A second smaller exploratory study (n=37) in a similar population was conducted using a sequence of 5 and 10 mg dosing for the assessment of lipoprotein particle concentration. GW501516 demonstrated HDL cholesterol increases up to 16.9% (10 mg) and apoA-I increases up to 6.6%. Reductions were observed in low-density lipoprotein (LDL) cholesterol (−7.3%), triglycerides (−16.9%), apoB (−14.9%), and free fatty acids (−19.4%). The exploratory study showed significant reductions in the concentration of very LDL (−19%), intermediate-density lipoprotein (−52%), and LDL (−14%, predominantly a reduction in small particles), whereas the number of HDL particles increased (+10%; predominantly medium and large HDL).
Conclusion—GW501516 produced significant changes in HDL cholesterol, LDL cholesterol, apoA1, and apoB. Fewer very LDL and larger LDL support a transition toward less atherogenic lipoprotein profiles. These data are consistent with peroxisome proliferator-activated receptor-δ being a potentially important target for providing cardiovascular protection in metabolic syndrome-like patients. (Arterioscler Thromb Vasc Biol. 2012;32:2289-2294.)
Key Words: free fatty acid insulin ◼ metabolic syndrome ◼ peroxisome proliferator-activated receptor-δ
◼ serum lipids
Lipid Effects of Peroxisome Proliferator-Activated
Receptor-
δ
Agonist GW501516 in Subjects With
Low High-Density Lipoprotein Cholesterol
Characteristics of Metabolic Syndrome
Eric J. Olson, Gregory L. Pearce, Nigel P. Jones, Dennis L. Sprecher
Materials and Methods
Primary Lipid Study Main Criteria for Inclusion
Male or female subjects aged 18 to 75 years with fasting plasma HDL-C concentration ≤45 mg/dL (≤1.16 mmol/L), plasma LDL-C levels that did not require treatment according to the National Cholesterol Education Program/Adult Treatment Panel III guidelines, and fasting plasma TG concentration ≤500 mg/dL (≤5.65 mmol/L) were eligible for the study. Individuals with diabetes mellitus, renal impairment, thyroid dysfunction, or concomitant use of lipid lower-ing agents were excluded.
Design
This was a multicenter, randomized double-blind, parallel, placebo-controlled study with a 2-staged design. In stage 1, patients were randomly allocated to 12 weeks of treatment with 2.5 mg, 5.0 mg, or placebo. An Independent Data Monitoring Committee was pro-spectively appointed to ensure participant safety during the study and additionally to review the stage 1 data to advise whether the study could continue to stage 2 with an expanded dose range. In accordance with the Independent Data Monitoring Committee recommendations, stage 2 of the study was conducted with patients randomly allocated to 12 weeks of treatment with 5.0 mg, 10.0 mg, or placebo. The lipid changes in the treatment arms common to stages 1 and 2 (5 mg and placebo) were assessed for sufficient concordance to permit pooling of data from the 2 stages. In addition to the treatment period, each stage of the study included a 2-week placebo run-in period and a 2-week (stage 1) or 4-week (stage 2) follow-up period (GlaxoSmithKline Protocol: PAD20001; ClinicalTrials.gov Identifier: NCT00158899, URL: http://www.clinicaltrials.gov/ct2/show/NCT00158899?term= gw501516&rank=1).
Written informed consent was obtained before each subject could participate in the study. The study was conducted in accordance with good clinical practice and all applicable regulatory requirements, including the 1996 version of the Declaration of Helsinki and the Institutional Ethics Committee. Blood samples were taken at each clinical visit for routine hematology and clinical chemistry testing by a central laboratory (Quest Diagnostics, Inc., Middlesex, UK). Nonesterified free fatty acids were measured, after having been drawn into EDTA tubes, centrifuged, and plasma frozen at −80°C. Standard lipids/lipoproteins were measured and analyzed after an overnight fast before, during, and after the 12-week dosing period (Quest Diagnostics, Inc).
Exploratory Study
The exploratory investigation was designed as a randomized, paral-lel group, double-blind study in adult males (n=16 on GW501516, n=21 placebo) (age, 18–55 years) with 2 arms, in which subjects were initiated on the 5-mg dose level for 6 weeks, reviewed for safety, and escalated to 10 mg for an additional 6 weeks (12 weeks of total treat-ment duration). Entry criteria included LDL-C≥80 mg/dL, serum TG≥100 mg/dL and ≤400 mg/dL, and body mass index ≥27 kg/m2
but ≤43 kg/m2.
Blood plasma samples for lipoprotein analysis via nuclear mag-netic resonance were taken at baseline, 6 weeks, and end of treatment. Lipoprotein subclass profiles were measured by a commercially available proton nuclear magnetic resonance spectroscopic assay (LipoScience, Raleigh, NC) as described previously.10 The results included particle
concentrations of 6 very low-density lipoprotein (VLDL) subclasses, intermediate-density lipoprotein, 3 low-density lipoprotein (LDL) subclasses, and 3 high-density lipoprotein (HDL) subclasses. VLDL subclasses were regrouped as large (V6, V5), medium (V4, V3), and small (V2, V1) subclasses (GlaxoSmithKline Protocol: PAD100958; ClinicalTrials.gov Identifier: NCT00388180, URL: http://clinicaltrials. gov/ct2/show/NCT00388180?term=pad100958&rank=1).
Statistics
Baseline characteristics were compared among groups using Wilcoxon rank-sum tests for continuous variables because not all measures were
normally distributed. Chi-square tests were used for categorical vari-ables. ANOVA techniques were used to evaluate treatment differences in responses. For the primary analyses, responses were calculated as percent change from baseline at 12 weeks. These models were adjusted for baseline value of the response variable, age, sex, and baseline waist circumference (note: height was not collected so body mass index was unavailable). The Dunnett tests were used to control type I error rate because each treatment was compared with control. Dose effects across treatment groups (ie, not including placebo) were also evalu-ated within the context of these ANOVA models. For the exploratory particle study, descriptions of serum lipid baseline values and changes are presented as mean±SE. Changes in the number of particles are presented as median, 25th percentile, and 75th percentile because the distributions did not meet the assumption of normality. Changes (com-pared with placebo over 12 weeks) were evaluated within the context of ANOVA models adjusting for baseline value, age, sex, and weight. All analyses were conducted using SAS (v9.1, SAS Institute, Cary, NC), and P<0.05 was considered statistically significant.
Results
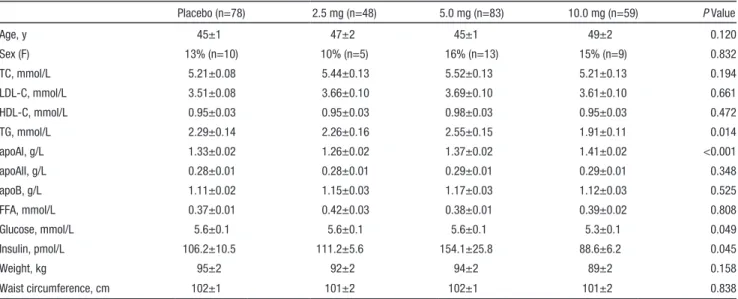
Subjects in the core study were randomly assigned to pla-cebo (n=78), 2.5 mg GW501516 (n=48), 5 mg GW501516 (n=83), or 10 mg GW501516 (n=59). The mean age of par-ticipants was ±46 years, and 14% (n=37) were women. There were no observed contrasts in trend between sex (data not shown). Mean LDL-C was 3.61±0.05 mmol/L, mean HDL-C was 0.95±0.03 mmol/L, and mean TGs were 2.28±0.07 mmol/L. Just over half (n=139, 51.9%) of study subjects had metabolic syndrome per Adult Treatment Panel III/National Cholesterol Education Program definition. Baseline param-eters were similar among treatment groups with the excep-tion of TGs, apolipoprotein (apo) AI, glucose, and insulin (Table 1). All subjects from the exploratory study (n=37; 16 sub-jects 5/10 mg GW501516, 21 placebo) were male and averaged 43.6±1.1 years of age. The mean weight was 103.9±2.0 kg and the mean waist circumference was 109.9±1.5. There were no statistically significant differences between treatment groups for any of these measures. A subtle trend toward a higher mean in weight in the exploratory study cohort, yet a modestly lower TG and modestly higher HDL-C (see Table 3 for baseline lip-ids) were not significantly different between populations.
LDL-C decreased significantly in the intermediate (−4.0%±1.8%, P=0.029) and high (−7.3%±2.4%, P<0.001) dose groups compared with placebo (Figure 1). As noted (Table 2), total cholesterol followed a similar pattern. Dose response was significant for both LDL-C (P=0.035) and total cholesterol (P=0.012).
In a parallel fashion, TGs showed significant decreases (versus placebo) for the intermediate (−9.6%±4.0%, P=0.003) and high (−16.9%±4.2%, P<0.001) dose GW501516 groups, whereas the low dose did not change significantly com-pared with placebo. A significant dose response was estab-lished (P<0.001, Table 2). Consistent with the LDL-C, TG, and total cholesterol, a significant apoB dose response was evident (P=0.004), achieving a 14.9%±2.0% reduction at the highest dose.
HDL-C levels increased to a similar extent (ranging from 11.1%±2.1% for 5.0 mg to 16.9%±2.6% for 10 mg, P<0.001 for each dose) and without any apparent dose response (P=0.l7). No clear plateau was achieved within the timeframe of the study (Figure 2).
ApoAI effects exhibited a pattern consistent with the effects observed for HDL-C. Significant changes compared with placebo were seen in the high-dose group (+6.6%±1.9%,
P<0.001), whereas a more modest increase (+4.3%±1.5%,
P=0.043) was seen in the intermediate dose group. Modest evidence of a dose response was seen at study end (P=0.052). Baseline apoAI levels were lower in the 2.5-mg dose group and did not differ significantly from placebo despite achieving a similar magnitude change (6.2%±1.9% P=0.674 after adjustment for baseline) as seen in the high-dose group (6.6%±1.9%, P<0.001). ApoAII revealed a significant increase for all doses and substantial dose response (ranging from 8.9%±2.4% for 2.5 mg to 10.3%±2.3% for 10 mg,
P<0.001 for all).
Serum free fatty acids revealed a marked significant (P<0.001) decline of −22.2%±4.7%, −19.5%±4.2%, and −19.4%±4.9% in the low, intermediate, and high doses, compared with a rise of 13.7%±6.1% in the placebo (Figure 3).
Glucose levels remained stable in all 3 dose groups; how-ever, an inverse dose relationship was observed for insu-lin levels with both the low- and intermediate-dose groups demonstrating significant reductions (−5.8%±5.6%, P=0.03
and −5.9%±3.9%, P=0.02). No change was observed in the high-dose group compared with placebo (31.2%±17.4% and 30.2%±11.2%, respectively, P=0.69).
There was a statistically significant increase in body weight observed in the high-dose group (+1.3%±0.4%) compared with placebo (−0.4%±0.2%, P=0.006) that was manifest at week 12. This gain represented ≈1 kg. Neither the low (0.2%±0.5%,
P=0.590) or intermediate (0.3%±0.4%, P=0.400) showed significant weight change. A complete overview of 12-week changes (% change from baseline) for serum lipids and lipo-proteins can be found in Table 2.
As shown in Table 3, serum lipid changes from the exploratory study were generally consistent with the results from the primary study. HDL-C showed a significant increase (P=0.006), whereas LDL-C and TG decreased but not significantly (P=0.056 and P=0.191, respectively). Table 3 shows that the number of HDL particles increased significantly (P<0.001) driven by increases in the number of large and medium particles. The concentration of LDL particles decreased (P<0.001), as a result of reductions in the number of medium, small, and very small LDL particles, whereas an increase in the number of large LDL particles was observed. The number of intermediate-density lipoprotein particles decreased (P<0.001). Total VLDL particle concentration decreased (P=0.048) predominantly through a significant reduction in the medium size particles.
Discussion
This is the first large, well-controlled multiple-dose study examining the lipid effects of a highly selective PPARδ ago-nist GW501516 in low-HDL-C subjects with similar char-acteristics to those of metabolic syndrome. The present data demonstrate that GW501516 produced significant increases in plasma HDL-C and apoA1 while causing significant dose-related reductions in LDL-C, apoB, and TGs in comparison with placebo. These changes were found in the context of marked free fatty acid reductions that were observed at all
Table 1. Baseline Population Description (Mean±SE for Continuous Measures, Percent, and Number for Categorical)
Placebo (n=78) 2.5 mg (n=48) 5.0 mg (n=83) 10.0 mg (n=59) P Value Age, y 45±1 47±2 45±1 49±2 0.120 Sex (F) 13% (n=10) 10% (n=5) 16% (n=13) 15% (n=9) 0.832 TC, mmol/L 5.21±0.08 5.44±0.13 5.52±0.13 5.21±0.13 0.194 LDL-C, mmol/L 3.51±0.08 3.66±0.10 3.69±0.10 3.61±0.10 0.661 HDL-C, mmol/L 0.95±0.03 0.95±0.03 0.98±0.03 0.95±0.03 0.472 TG, mmol/L 2.29±0.14 2.26±0.16 2.55±0.15 1.91±0.11 0.014 apoAI, g/L 1.33±0.02 1.26±0.02 1.37±0.02 1.41±0.02 <0.001 apoAII, g/L 0.28±0.01 0.28±0.01 0.29±0.01 0.29±0.01 0.348 apoB, g/L 1.11±0.02 1.15±0.03 1.17±0.03 1.12±0.03 0.525 FFA, mmol/L 0.37±0.01 0.42±0.03 0.38±0.01 0.39±0.02 0.808 Glucose, mmol/L 5.6±0.1 5.6±0.1 5.6±0.1 5.3±0.1 0.049 Insulin, pmol/L 106.2±10.5 111.2±5.6 154.1±25.8 88.6±6.2 0.045 Weight, kg 95±2 92±2 94±2 89±2 0.158 Waist circumference, cm 102±1 101±2 102±1 101±2 0.838
TC indicates total cholesterol; LDL-C, low-density lipoprotein cholesterol; HDL-C, high-density lipoprotein cholesterol; TG, triglyceride; FFA, free fatty acid.
P values represent global tests for any difference among groups.
3.30 3.40 3.50 3.60 3.70 3.80 3.90 LDLc (mmol/L) 3.00 3.10 3.20 Week 0 1 6 8 12 Placebo Dose=2.5 Dose=5 Dose=10
Figure 1. Low-density lipoprotein cholesterol (LDL-C) response over time by treatment group.
doses. Complimentary lipoprotein particle data from a smaller cohort of subjects with similar demographics and characteris-tics demonstrated fewer VLDL and LDL particles, redistribut-ing to smaller and larger in size, respectively, in addition to fewer HDL, but larger HDL subclasses.
These global changes of the lipoprotein profile observed herein are generally consistent with those in rhesus monkeys1
as well as those observed in our previous smaller clinical trials6,7 using the same PPARδ agonist agent. They have all
noted a diminished apoB particle presence on drug admin-istration and have typically observed HDL-C increases. The robust apoB changes likely represent a reduction in interme-diate-density lipoprotein and LDL for the lowest dose, and
VLDL (relevant to TG levels) and LDL reductions for the higher dosing groups. The substantial decrease in small LDL in the exploratory study (ie, a drug-induced modification toward larger LDL particles) is metabolically consistent with the observed decrease in VLDL particle concentrations in the larger subclasses; less TG transfer facilitating an LDL sub-strate more amenable to hepatic lipase induced dense LDL.11
This redistribution of LDL particles to larger subclasses is often viewed as cardioprotective,12 although not consistently.13
Similarly, both HDL-C and its major protein moiety apoAI increased in a parallel fashion, yet revealed improvements which were similar at all dose levels. Greater concentrations of medium and large HDL subclasses, despite an unchanged
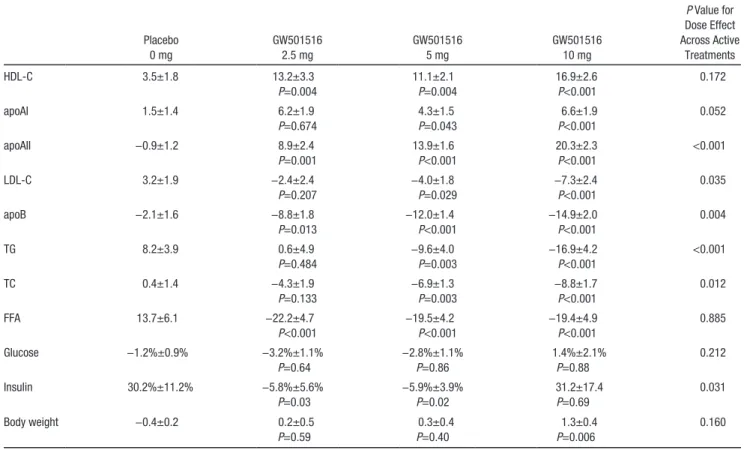
Table 2. Twelve-Week Change (Percent Change From Baseline) in Serum Values and Body Weight for Each Treatment Group
Placebo 0 mg GW501516 2.5 mg GW501516 5 mg GW501516 10 mg P Value for Dose Effect Across Active Treatments HDL-C 3.5±1.8 13.2±3.3 P=0.004 11.1±2.1 P=0.004 16.9±2.6 P<0.001 0.172 apoAI 1.5±1.4 6.2±1.9 P=0.674 4.3±1.5 P=0.043 6.6±1.9 P<0.001 0.052 apoAII −0.9±1.2 8.9±2.4 P=0.001 13.9±1.6 P<0.001 20.3±2.3 P<0.001 <0.001 LDL-C 3.2±1.9 −2.4±2.4 P=0.207 −4.0±1.8 P=0.029 −7.3±2.4 P<0.001 0.035 apoB −2.1±1.6 −8.8±1.8 P=0.013 −12.0±1.4 P<0.001 −14.9±2.0 P<0.001 0.004 TG 8.2±3.9 0.6±4.9 P=0.484 −9.6±4.0 P=0.003 −16.9±4.2 P<0.001 <0.001 TC 0.4±1.4 −4.3±1.9 P=0.133 −6.9±1.3 P=0.003 −8.8±1.7 P<0.001 0.012 FFA 13.7±6.1 −22.2±4.7 P<0.001 −19.5±4.2 P<0.001 −19.4±4.9 P<0.001 0.885 Glucose −1.2%±0.9% −3.2%±1.1% P=0.64 −2.8%±1.1% P=0.86 1.4%±2.1% P=0.88 0.212 Insulin 30.2%±11.2% −5.8%±5.6% P=0.03 −5.9%±3.9% P=0.02 31.2±17.4 P=0.69 0.031 Body weight −0.4±0.2 0.2±0.5 P=0.59 0.3±0.4 P=0.40 1.3±0.4 P=0.006 0.160 TC indicates total cholesterol; LDL-C, low-density lipoprotein cholesterol; TG, triglyceride; FFA, free fatty acid.
P values were adjusted for age, sex, waist circumference and baseline lipid values. P value for each treatment dose compared with placebo.
0.95 1.00 1.05 1.10 1.15 1.20 HDLc (mmol/L) 0.80 0.85 0.90 Placebo Dose=2.5 Dose=5 Dose=10 Week 0 1 6 8 12
Figure 2. High-density lipoprotein cholesterol (HDL-C) response over time by treatment group.
0.30 0.35 0.40 0.45 0.50 FF A (mmol/L ) 0.20 0.25 Placebo Dose=2.5 Dose=5 Dose=10 Week 0 1 6 8 12
Figure 3. Free fatty acid (FFA) response over time by treatment group.
small subclass, may again be the result of smaller or char-acteristically different VLDL, with diminished TG-to-HDL transfer and subsequent attenuated hydrolysis. The increase in HDL particle number is consistent with both the observed increase in apoAI and the substantial increase in apoAII, a key HDL structural protein derived predominantly from the liver.14 This inferred hepatic influence parallels the increase in
apoAII expression from both HepG2 and HuH-7 cells dem-onstrated with administration of GW50151615 and implicates
potential hepatic metabolism, as important in the metabolic consequences of PPARδ pharmacology. We might expect par-ticularly enhanced apoAII production to encourage a selective increase in the number of AI/AII particles, more consistent with HDL3.16 Although HDL2 (and apoAI) appear to be
espe-cially informative for coronary heart disease risk, both HDL2 (predominantly apoAI) and HDL3 are generally predictive of coronary heart disease.17–19 Elevated apoAII was also recently
found to encourage cardiovascular protection.20
The HDL-C and TG changes observed with this agent in these overweight subjects would be in concert with the patho-physiologic proposals from Tanaka and others who implicate PPARδ agonism in the resolution of various aspects of the metabolic syndrome.2,21–23 In these murine models, the use of
a PPARδ agonist has resulted in enhancement of fatty acid oxidation, specifically in skeletal muscle. This is consistent with the enhanced catabolism of radiolabeled fat in a recent human study.6 Our initial hypothesis7 implicated the increase
in fatty acid oxidation within the substrate of skeletal muscle as relevant to the dramatic drop in serum free fatty acids. The diminished fatty acid substrate could in turn explain the reduc-tion in VLDL hepatic producreduc-tion and perhaps the consequent
enhancement in HDL-C from decreased TG exchange as well as resulting in increased residence times. However, the equivalent fatty acid reduction among the doses, in the setting of a dose-related reduction in TGs, implies the potential for hepatic effects outside that of muscle per se.
Also consistent with preclinical models, a significant decrease in serum insulin was observed at the 2 lower GW501516 doses in the core study, in the setting of unchanged glucose concentrations. This would imply an improvement in insulin sensitivity. Reductions in fasting insulin accompanying increases in fatty acid oxidation have been reported previously in euglycemic subjects treated with GW501516.6 However,
whether the implied change in insulin sensitivity and glucose uptake is related to a decreased availability of TGs is unclear. Furthermore, the expected loss in body weight, appreciated in preclinical models associated with improved insulin sen-sitivity, was not apparent in this study. Indeed, an increase was seen for the highest dose group, a subcohort in whom no insulin benefits were observed. These data do not allow char-acterization of the weight change composition, which poten-tially includes fat, muscle mass, glycogen storage, or water. The latter explanation is perhaps particularly unlikely, in that weight was sustained at the 2-week follow-up examination for all cohorts and there was no record of edema.
There are a few caveats to our investigation. Although the primary dose ranging study was performed in 2 stages (enabling safety evaluations before advancing to the 10-mg dose), the lipid changes in the treatment arms common to both stages 1 and 2 (placebo and 5 mg) were sufficiently concordant to permit pooling of data. There were some baseline differences in lipid/ apolipoprotein values, including TG and apoAI. However,
Table 3. Exploratory Study
Serum Lipids
Particle Type
Concentration of Particles
Baseline 12-wk Change, % 12-wk Change, %
GW501516 Placebo GW501516 Placebo GW501516 Placebo
HDL-C 1.11±0.04 1.12±0.07 8.7%±3.1%* −2.5%±1.8% HDL 9.6%# (2.9, 19.4) −3.7% (−12.4, 3.7) Large 31.4* (−1.6, 100.7) 2.7 (−19.2, 20.0) Medium 75.0* (40.0, 700.0) 0.0 (−28.2, 108.8) Small −3.0 (−10.0, 5.2) −8.8 (−15.4, −0.7) LDL-C 3.70±0.19 3.52±0.23 −11.3±3.7 −1.4±2.5 LDL −13.9# (−21.4, −5.0) 6.4 (−9.2, 11.0) Large 70.2# (18.2, 171.4) −18.7 (−48.8, 3.4) Medium −18.8# (−29.4, −12.7) 7.8 (−11.0, 19.2) Small −18.6# (−34.4, −12.0) 7.9 (−4.5, 17.2) Very small −20.1# (−37.0, −13.8) 8.5 (−8.0, 19.1) TG 1.92±0.18 1.67±0.13 −19.9±6.2 −4.5±8.4 IDL −52.4# (−67.2, −17.9) 19.6 (−5.2, 69.7) VLDL −19.3* (−40.5, −5.5) −3.8 (−26.2, 17.7) VLDL large −31.1 (−63.7, 12.9) −36.9 (−73.8, 26.1) VLDL medium −29.5* (−60.9, −11.9) −2.8 (−33.7, 16.7) VLDL small 0.4 (−29.2, 29.4) −4.8 (−8.2, 16.5) TG indicates triglyceride; IDL, intermediate-density lipoprotein; LDL, low-density lipoprotein; LDL-C, low-density lipoprotein cholesterol; HDL, high-density lipoprotein; HDL-C, high-density lipoprotein cholesterol; VLDL, very low-density lipoprotein.
Lipid data are shown in left panel, particle data are shown in right panel. Serum lipid and associated particle changes (all changes percent change from baseline over 12-wk study). Serum lipids shown as mean±SE. Concentration of particles shown as median, 25th percentile, and 75th percentile.
*P value vs placebo <0.05. #P value vs placebo <0.001.
adjustments for baseline values were included in the statistical models. In addition, particle analyses were done in a separate population, with the test agent provided for 6 weeks at each serial dose. However, the baseline attributes were reasonably comparable, and the changes in lipid values were equivalent and net influences on traditional lipid factors appeared similar at the end of 12 weeks for both studies.
In summary, this study recommends pharmacologic target-ing of PPARδ as a central link in the commonly appreciated abnormalities observed among HDL-C, TG, and LDL-C. In the setting of metabolic syndrome, it could be inferred that this nuclear receptor influences several features of the syn-drome, including insulin sensitivity, at both the peripheral and hepatic level. Long-term preclinical safety studies have pre-cluded further development of GW501516 for dyslipidemia indications. However, manipulation of this receptor pathway might become a powerful approach in addressing the thera-peutic challenges across several patient populations including metabolic syndrome or those diseases with a genesis in dys-functional fatty acid oxidation.
Disclosures
None.References
1. Oliver WR Jr, Shenk JL, Snaith MR, Russell CS, Plunket KD, Bodkin NL, Lewis MC, Winegar DA, Sznaidman ML, Lambert MH, Xu HE, Sternbach DD, Kliewer SA, Hansen BC, Willson TM. A selective per-oxisome proliferator-activated receptor delta agonist promotes reverse cholesterol transport. Proc Natl Acad Sci USA. 2001;98:5306–5311. 2. Tanaka T, Yamamoto J, Iwasaki S, et al. Activation of peroxisome
pro-liferator-activated receptor delta induces fatty acid beta-oxidation in skeletal muscle and attenuates metabolic syndrome. Proc Natl Acad Sci USA. 2003;100:15924–15929.
3. Willson TM, Wahli W. Peroxisome proliferator-activated receptor ago-nists. Curr Opin Chem Biol. 1997;1:235–241.
4. Willson TM, Brown PJ, Sternbach DD, Henke BR. The PPARs: from orphan receptors to drug discovery. J Med Chem. 2000;43:527–550. 5. Fürnsinn C, Willson TM, Brunmair B. Peroxisome proliferator-activated
receptor-delta, a regulator of oxidative capacity, fuel switching and cho-lesterol transport. Diabetologia. 2007;50:8–17.
6. Risérus U, Sprecher D, Johnson T, et al. Activation of peroxisome pro-liferator-activated receptor (PPAR)delta promotes reversal of multiple metabolic abnormalities, reduces oxidative stress, and increases fatty acid oxidation in moderately obese men. Diabetes. 2008;57:332–339. 7. Sprecher DL, Massien C, Pearce G, Billin AN, Perlstein I, Willson
TM, Hassall DG, Ancellin N, Patterson SD, Lobe DC, Johnson TG.
Triglyceride:high-density lipoprotein cholesterol effects in healthy sub-jects administered a peroxisome proliferator activated receptor delta agonist. Arterioscler Thromb Vasc Biol. 2007;27:359–365.
8. Kliewer SA, Xu HE, Lambert MH, Willson TM. Peroxisome prolifer-ator-activated receptors: from genes to physiology. Recent Prog Horm Res. 2001;56:239–263.
9. Qin X, Xie X, Fan Y, Tian J, Guan Y, Wang X, Zhu Y, Wang N. Peroxisome proliferator-activated receptor-delta induces insulin-induced gene-1 and suppresses hepatic lipogenesis in obese diabetic mice. Hepatology. 2008;48:432–441.
10. Otvos JD. Measurement of lipoprotein subclass profiles by nuclear mag-netic resonance spectroscopy. Clin Lab. 2002;48:171–180.
11. Adiels M, Olofsson SO, Taskinen MR, Borén J. Overproduction of very low-density lipoproteins is the hallmark of the dyslipidemia in the meta-bolic syndrome. Arterioscler Thromb Vasc Biol. 2008;28:1225–1236. 12. Otvos JD. Why cholesterol measurements may be misleading about
lipoprotein levels and cardiovascular risk: Clinical implications of lipo-protein quantification using NMR spectroscopy. J Lab Med. 2002;26: 544–550.
13. Sacks FM, Campos H. Clinical review 163: Cardiovascular endocrinol-ogy: Low-density lipoprotein size and cardiovascular disease: a reap-praisal. J Clin Endocrinol Metab. 2003;88:4525–4532.
14. Tailleux A, Duriez P, Fruchart JC, Clavey V. Apolipoprotein A-II, HDL metabolism and atherosclerosis. Atherosclerosis. 2002;164:1–13. 15. Thulin P, Glinghammar B, Skogsberg J, Lundell K, Ehrenborg E.
PPARdelta increases expression of the human apolipoprotein A-II gene in human liver cells. Int J Mol Med. 2008;21:819–824.
16. Tall AR, Breslow JL, Rubin EM. Genetic disorders affecting plasma high-density lipoproteins. In: Scriver CR ed. The Metabolic and Molecular Basis of Inherited Disease, 8th ed. New York, NY: McGraw-Hill; 2001: 2915–2936.
17. Sharrett AR, Ballantyne CM, Coady SA, Heiss G, Sorlie PD, Catellier D, Patsch W; Atherosclerosis Risk in Communities Study Group. Coronary heart disease prediction from lipoprotein cholesterol levels, triglycer-ides, lipoprotein(a), apolipoproteins A-I and B, and HDL density sub-fractions: The Atherosclerosis Risk in Communities (ARIC) Study.
Circulation. 2001;104:1108–1113.
18. Williams PT, Feldman DE. Prospective study of coronary heart disease vs. HDL2, HDL3, and other lipoproteins in Gofman’s Livermore Cohort.
Atherosclerosis. 2011;214:196–202.
19. Barter PJ, Rye KA. The rationale for using apoA-I as a clinical marker of cardiovascular risk. J Intern Med. 2006;259:447–454.
20. Birjmohun RS, Dallinga-Thie GM, Kuivenhoven JA, Stroes ES, Otvos JD, Wareham NJ, Luben R, Kastelein JJ, Khaw KT, Boekholdt SM. Apolipoprotein A-II is inversely associated with risk of future coronary artery disease. Circulation. 2007;116:2029–2035.
21. Takahashi S, Tanaka T, Sakai J. New therapeutic target for metabolic syndrome: PPARdelta. Endocr J. 2007;54:347–357.
22. Wang YX, Lee CH, Tiep S, Yu RT, Ham J, Kang H, Evans RM. Peroxisome-proliferator-activated receptor delta activates fat metabo-lism to prevent obesity. Cell. 2003;113:159–170.
23. Wang YX, Zhang CL, Yu RT, Cho HK, Nelson MC, Bayuga-Ocampo CR, Ham J, Kang H, Evans RM. Regulation of muscle fiber type and running endurance by PPARdelta. PLoS Biol. 2004;2:e294.