Abstract: Speckle noise is an important aspect of synthetic aperture radar (SAR) imagery because it greatly affects the quality of the image captured SAR. Speckle noise may consider as inherent disadvantage involve with SAR systems because of its working principle (coherent imagery). This paper presents a wavelet based technique to filter the speckle noise in the SAR images. The proposed technique involves the wavelet transform with inter-scale dependencies and adaptive thresholding. The simulation result shows that the presented algorithm performs well.
Keywords: Synthetic Aperture Radar (SAR), Speckle Noise, Wavelet Transform.
1. Introduction
Synthetic Aperture Radars are now widely adopted for military and surveillance systems because of its ability to capture image irrespective to the atmospheric and sun-light-illumination conditions and higher resolution. However it suffers from the noise called speckle which is a multiplicative kind of noise and greatly disturbs the captured image. Hence the filtering of speckle noise is basic requirement for every SAR system and so there are many techniques are proposed some works on spatial domain and some on transform domain, although the speckle noise is more difficult to remove than additive white Gaussian noise because of its multiplicative nature. The filtering of speckle while preserving the edge and texture information is always considered as
challenging task for filter designers. The detail analysis of speckle noise shows that it contains some useful information and also technically it’s not a noise. Because of complexity of noise most of the filters often fail to preserve sharp features such as edges. To overcome some of these limitations, wavelet-based methods are often utilized in which noise shrinkage is applied to the detail wavelet coefficients of the noisy image [13], [14], [15]. The rest of paper is arranged as that second section discusses some recent works done in same field. Third section explains the speckle noise model followed by wavelet transforms and Bi-Variate shrinkage in fourth and fifth section respectively. The sixth section explains the simulated model and in seventh section results analysis is performed followed by conclusion in eights section.
2. Related Work
This section presents a brief description of some of the most useful and related literatures. Vishal M. Patel, Glenn R. Easley and Rama Chellappa [1] presented a speckle reduction algorithm based on separating the structure and texture components of SAR images. An iterative algorithm based on surrogate functional is presented that solves the component optimization formulation. Total Variation (TV) and Wavelet Shrinkage based method is presented by Banazier A. Abrahim and Yasser Kadah [2] In their method, a noisy image is decomposed into subbands of LL, LH, HL and HH in wavelet domain. LL subband contains the low frequency coefficients along with less noise, which can be easily eliminated using TV-based method. More edges and other detailed information like textures are contained in the other three subbands and we propose a shrinkage method based on the local variance to extract them from high frequency noise. The Probability Density Function (PDF) of the speckle noise in SAR system is derived by Gabriele Moser, Josiane Zerubia, and Sebastiano B. Serpico [4]. They presented an innovative parametric estimation
Transform and Bivariate Shrinkage Function
Nupur Saxena M Tech
Radharaman Institute of Technology and Science
Neha Rathore Assistant Professor
methodology for SAR amplitude data is proposed that adopts a generalized Gaussian (GG) model for the complex SAR backscattered signal. In their literature closed form expression for the corresponding amplitude probability density function (PDF) is derived and a specific parameter estimation algorithm is developed in order to deal with the proposed model. Levent Sendur and Ivan W. Selesnick [5] proposed Bivariate Shrinkage Functions for wavelet based denoising in their paper; they only consider the dependencies between the coefficients and their parents in detail. For this purpose, new non-Gaussian bivariate distributions are proposed, and corresponding nonlinear threshold functions (shrinkage functions) are derived from the models using Bayesian estimation theory. The new shrinkage functions do not assume the independence of wavelet coefficients. Fisher Distribution for Texture Modeling of Polarimetric SAR Data is presented in [6]. This paper shows how Fisher distribution could be used to model the observed signal for multichannel polarimetric SAR data of textured scenes. Stochastic Distances based Speckle Reduction is presented by Leonardo Torres, Antonio C. Medeiros, and Alejandro C. Frery [7]. An adaptive spatial filtering approach is proposed by Fang Qiu, Judith Berglund, John R. Jensen, Pathik Thakkar, and Dianwei Ren [9] in their work a local adaptive median filter was developed that uses local statistics to detect SAR speckle noise and to replace it with a local median value.
3. Statistical Model of Speckle in SAR
Much literature has been published on the modeling of the speckle noise in SAR among them the multiplicative model is proved to most accurate and suitable for SAR imagery [2].
For SAR the noise n assumed to have a mean value 𝑛 = 1. The pixel values returned by the radar imaging process (𝑔) are the product of the true radiometric value (𝑓) and the speckle noise (𝑛).
𝑔 = 𝑓. 𝑛 … … … … . (1)
The detail description of speckle noise statistics is describe in [14][15[16]. The single look SAR images have Rayleigh distributed noise and single look intensity images have negative exponentially
distributed noise. Multi look SAR images have gamma distributed noise, assuming that the looks are independent [3].
4. Wavelet Interscale Dependency and Bivariate Shrinkage function
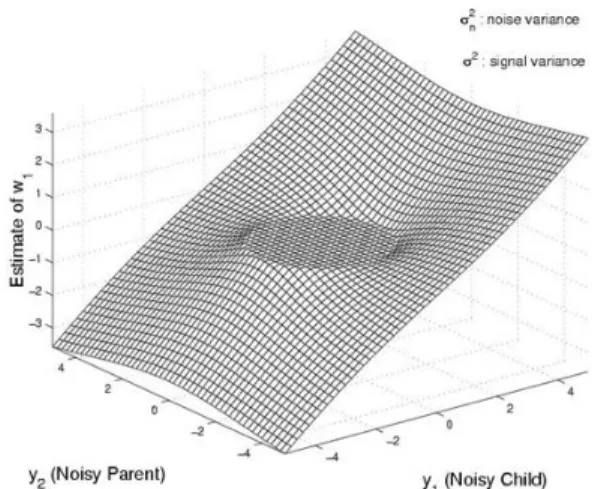
The wavelet transform nearly decorrelates many images and can be viewed as an approximate Karhunen Loeve transform (KLT) [11]. This is the basic property exploited by early wavelet coders and wavelet denoising algorithms. Nevertheless, significant dependencies still exist between wavelet coefficients. Each statistical wavelet model in the literature focuses on a certain type of dependencies, which it attempts to capture using a relatively simple and tractable model. The magnitudes of wavelet coefficients in typical images are strongly correlated across scales. Consider a quadtree representation of wavelet coefficients. If a parent node has small magnitude, its children are very likely to be small too. This property is known as Interscale dependency. A new simple non-Gaussian bivariate probability distribution function to model the statistics of wavelet coefficients of natural images is presented by Shihua Cai & Keyong Li [12]. The model captures the dependence between a wavelet coefficient and its parent. Using Bayesian estimation theory a simple non-linear shrinkage function for wavelet denoising is derived, which generalizes the soft thresholding approach. The new shrinkage function, which depends on both the coefficient and its parent, yields improved results for wavelet-based image denoising. Let w2 represent the parent of w1 (w2 is the wavelet coefficient at the same spatial position as w1, but at the next coarser scale). Then
𝑦 = 𝑤 + 𝑛
𝑤𝑒𝑟𝑒 𝑤 = (𝑤1, 𝑤2), 𝑦 = (𝑦1, 𝑦2) and 𝑛 =
(𝑛1, 𝑛2). The noise values 𝑛1, 𝑛2are iid zero-mean Gaussian with variance 𝜎𝑛2. Based on the empirical histograms computed, the following non-Gaussian bivariate pdf can be derived
𝑝𝑤 𝑤 =
3
2𝜋𝜎2𝑒𝑥𝑝 −
3
With this pdf, 𝑤1 and 𝑤2 are uncorrelated, but not independent. The MAP estimator of 𝑤1 yields the following bivariate shrinkage function
𝑤1=
𝑦12+ 𝑦
12− 3𝜎𝑛
2 𝜎
+ 𝑦12+ 𝑦22
𝑦1
Here subscript + describe following operation
𝑔 += 𝑔 𝑜𝑡𝑒𝑟𝑤𝑖𝑠𝑒0 𝑖𝑓 𝑔 < 0
For this bivariate shrinkage function, the smaller the parent value, the greater the shrinkage. This is consistent with other models, but here it is derived using a Bayesian estimation approach beginning with the new bivariate non-Gaussian model. The plot is illustrated in the figure below.
Figure 1: A bivariate shrinkage function.
5. Performance Evaluation Measures
To evaluate the capability of the filters for removing noise and its effectiveness in successfully preserving the intrinsic structure of the image several quantitative performance measures suggested but in our paper we used the PSNR and MSE
5.1 Mean Squared Error (MSE)
Given a noise-free 𝑚 × 𝑛 monochrome image 𝐼 and its noisy approximation 𝐾, 𝑀𝑆𝐸 is defined as:
𝑀𝑆𝐸 = 1
𝑚𝑛 𝐼 𝑖, 𝑗 − 𝐾 𝑖, 𝑗 2
𝑛−1
𝑗 =0 𝑚 −1
𝑖=0
5.2 Peak Signal to Noise Ratio (PSNR)
The PSNR is defined as:
𝑃𝑆𝑁𝑅 = 10𝑙𝑜𝑔10 𝑅
2
𝑀𝑆𝐸
𝑅 is the maximum variation in the original image pixel values (for 8 bit unsigned integer 𝑅 = 255).
5.3 Relative Error (RE)
Relative error is defined as the absolute error divided by the true value.
𝑅𝐸 = 𝑥 − 𝑥0
𝑥
𝑊𝑒𝑟𝑒, 𝑥 = 𝑡𝑟𝑢𝑒 𝑣𝑎𝑙𝑢𝑒 𝑜𝑓 𝑎 𝑞𝑢𝑎𝑛𝑡𝑖𝑡𝑦, 𝑥0 = 𝑜𝑏𝑠𝑒𝑟𝑣𝑒𝑑 𝑣𝑎𝑙𝑢𝑒 𝑜𝑓 𝑡𝑒 𝑞𝑢𝑎𝑛𝑡𝑖𝑡𝑦, 𝑥 − 𝑥0 = 𝑎𝑏𝑠𝑜𝑙𝑢𝑡𝑒 𝑒𝑟𝑟𝑜𝑟.
6. Proposed Algorithm
The proposed algorithm contains many mathematical operations and can better be explained in following steps:
Step 1: Let the Noisy Image is denoted by 𝐼𝑁 . Now firstly we convert the multiplicative noise into additive noise by taking the 𝑙𝑜𝑔 of the image as shown below
𝐼𝐿= 𝑙𝑜𝑔 𝐼𝑁
Step 2: Now calculate the 2D Discrete Wavelet Transform (DWT) of 𝐼𝐿 and collect the coefficients of
𝐿𝐿, 𝐿𝐻, 𝐻𝐿 𝑎𝑛𝑑 𝐻𝐻 bands.
Step 3: Estimate the noise variance 𝜎𝑛2 from the noisy wavelet coefficients using following formula
𝜎 𝑛2=
𝑚𝑒𝑑𝑖𝑎𝑛 𝑦𝑖
0.6745 , 𝑦𝑖 ∈ 𝐻𝐻
𝜎𝑦2= 1
𝑀 𝑦𝑖2
𝑦𝑖∈𝑁 𝑘
, 𝑀 𝑖𝑠 𝑡𝑒 𝑠𝑖𝑧𝑒 𝑜𝑓 𝑁 𝑘
𝑊𝑒𝑟𝑒 𝑁(𝑘) 𝑛𝑒𝑖𝑔𝑏𝑜𝑟𝑜𝑜𝑑 𝑐𝑜𝑒𝑓𝑓𝑖𝑐𝑖𝑒𝑛𝑡𝑠.
Step 5: Estimate the marginal variance wavelet coefficients 𝜎2 as shown below
𝜎 2= 𝜎
𝑦2− 𝜎 𝑛2 +
Step 6: Now calculate the wavelet coefficients for denoised image using following formula
𝑤1=
𝑦12+ 𝑦12− 3𝜎𝑛
2 𝜎
+ 𝑦12+ 𝑦22
𝑦1
Step 6: Now only use above calculated 𝑤1if the following condition satisfy
𝑤1> 𝐴𝑣𝑔(𝑁 𝑘 )
Step 7: Apply Soft or Hard Thresholding according to selection.
Step 8: Calculate the inverse wavelet transforms of the filtered wavelet coefficients and then take the exponent to reconstruct the denoise image.
𝐼𝐷 = exp 𝐼𝐷𝑊𝑇 𝐼𝑤
𝑤𝑒𝑟𝑒 𝐼𝐷 𝑖𝑠 𝑡𝑒 𝑑𝑒𝑛𝑜𝑖𝑠𝑒𝑑 𝑖𝑚𝑎𝑔𝑒 𝑎𝑛𝑑 𝐼𝑤 𝑖𝑠
𝑓𝑖𝑙𝑡𝑒𝑟𝑒𝑑 𝑤𝑎𝑣𝑒𝑙𝑒𝑡 𝑐𝑜𝑒𝑓𝑓𝑖𝑐𝑖𝑒𝑛𝑡𝑠 𝑜𝑓 𝑖𝑚𝑎𝑔𝑒.
7. Simulation Results
This section presents the experimental evaluation of the proposed algorithm and relative comparison with other algorithms.
Figure 2: Images used in experiments 1. Nimes 2. Cameraman 3. Field.
Table 1. Relative error comparison for various Methods
Image Look
s Proposed
CBR[ 1]
SBT[ 16] Nimes 1 0.212 0.292 0.312 Camerama
n 13 0.070 0.087 0.104
Fields 10 0.040 0.055 0.058
Table 2. Performance evaluation of the proposed algorithm for images distorted by speckle noise of variance 0.05.
Image Threshold type
PSNR(dB) Noisy
PSNR(dB) Filtered Cameraman Soft 18.67 24.25 Cameraman Hard 18.66 24.34 Fields Soft 18.90 24.40 Fields Hard 18.94 24.34
Table 3. Performance evaluation of the proposed algorithm for images distorted by speckle noise of variance 0.1.
Image Threshold type
PSNR(dB) Noisy
PSNR(dB) Filtered Cameraman Soft 15.75 22.85 Cameraman Hard 15.78 23.11 Fields Soft 16.15 23.09 Fields Hard 16.11 23.19
8. Conclusion
References
[1] Vishal M. Patel, Glenn R. Easley and Rama Chellappa “Component Based Restoration of Speckled Images”, 2011 18th IEEE International Conference on Image Processing.
[2] Banazier A. Abrahim, Yasser Kadah “Speckle Noise Reduction Method Combining Total Variation and Wavelet Shrinkage for Clinical Ultrasound Imaging”, 2011 IEEE.
[3] Gabriele Moser and Sebastiano B. Serpico “Generalized Minimum-Error Thresholding for Unsupervised Change Detection from SAR Amplitude Imagery”, IEEE Transactions on Geoscience and Remote Sensing, Vol. 44, No. 10, October 2006.
[4] Gabriele Moser, Josiane Zerubia and Sebastiano B. Serpico “SAR Amplitude Probability Density Function Estimation Based on a Generalized Gaussian Model”, IEEE Transactions on Image Processing, Vol. 15, No. 6, June 2006.
[5] Levent Sendur and Ivan W. Selesnick “Bivariate Shrinkage Functions for Wavelet-Based Denoising Exploiting Interscale Dependency”, IEEE Transactions on Signal Processing, Vol. 50, No. 11, November 2002.
[6] Lionel Bombrun and Jean Marie Beaulieu “Fisher Distribution for Texture Modeling of Polarimetric SAR Data”, IEEE Geoscience and Remote Sensing Letters 5, 3 (2008) 512-516.
[7] Leonardo Torres, Antonio C. Medeiros and Alejandro C. Frery “Polarimetric SAR Image Smoothing with Stochastic Distances”.
[8] Abraao D. C. Nascimento, Renato J. Cintra and Alejandro C. Frery “Hypothesis Testing in Speckled Data with Stochastic Distances”, IEEE Transactions on Geoscience and Remote Sensing.
[9] Fang Qiu, Judith Berglund, John R. Jensen Pathik Thakkar and Dianwei Ren “Speckle Noise Reduction in SAR Imagery Using a Local Adaptive Median Filter”, GIScience and Remote Sensing, 2004, 41, No. 3, pp. 244-266.
[10] Levent Sendur and Ivan W. Selesnick “Bivariate Shrinkage With Local Variance Estimation”, IEEE Signal Processing Letters, Vol. 9, No. 12, December 2002.
[11] Juan Liu and Pierre Moulin “Information– Theoretic Analysis of Interscale and Intrascale Dependencies between Image Wavelet Coefficients”, ICIP 2000.
[12]http://eeweb.poly.edu/iselesni/WaveletSoftware/ denoise2.html
[13] J.S. Lee “Speckle Suppression and Analysis for Synthetic Aperture Images”, IEEE Transactions on Geoscience and Remote Sensing. V. 25 n. 5, pp 636-643.
[14] L.J. Porcello, N.G. Messy et. al. “Speckle Reduction in Synthetic Aparture Radar”, Journal of Optical Socity of America” V. 66 n, 11. pp.
[15] G. V. April and E.R. Harvey (1991) “Speckle Statistic in Four Look Synthetic Aperture Radar Imagery”. Optical Engineering v.30 n. 4 pp 375-381.
![Table 1. Relative error comparison for various Methods Image Look s Proposed CBR[1] SBT[16] Nimes 1 0.212 0.292 0.312 Camerama n 13 0.070 0.087 0.104 Fields 10 0.040 0.055 0.058](https://thumb-us.123doks.com/thumbv2/123dok_us/8097250.2145789/4.918.180.362.357.425/table-relative-comparison-various-methods-proposed-camerama-fields.webp)
