Patient Characteristics Associated with
Return Visits to a
Pediatric Emergency Department
By
Hallam Gugelmann
A Master’s Paper submitted to the faculty of the University of North Carolina at Chapel Hill,
in partial fulfillment of the requirements for the degree of Master of Public Health in
the Public Health Leadership Program
Chapel Hill, North Carolina 2008
Advisor:
Second Reader:
Table of Contents
Abstract 2
Introduction 3
Methods 4
Study design, setting and population 4
Key outcome measures and Independent variables 4
Statistical analysis 4
Results 5
Primary variable: Insurance type 5
Additional variable analysis 6
Condition-related Variables 10
Discussion 14
Primary Variable of Interest and Outcome 14
Additional Variables 14
Condition-related Variables 16
Shortcomings of this study 18
Conclusions 18
Acknowledgements 19
Addenda 20
References 39
Abstract
Title: Patient Characteristics Associated with Return Visits to a Pediatric Emergency Department
Author: Hallam Gugelmann
Objectives: The primary objective of this study is to identify and quantify the patient characteristics associated with 72-hour pediatric return visits to a tertiary care center’s emergency department. The hypothesis was that 72-hour return visits would be increased in patients with public insurance or no health insurance when compared to those individuals with private insurance.
Methods In order to attain the study’s state objectives, the principal investigator of this study undertook a retrospective review of the hospital’s centralized billing
database, specifying only the date range (1/1/2005 through 12/1/2007) and the age range (birth through 18 years of age) in the data extraction request. Data were collated by medical record number and date of visit, and time differences between each visit were calculated in order to identify all 72-hour return visits. Statistical analyses were then conducted, using Microsoft Excel to collate data and Stata version10.0 to perform logistic regression analyses.
Results Out of a total of 39,481 recorded patient visits, 1,392 (3.5% of all pediatric visits) were 72-hour return visits. The primary variable of insurance type was not related to the outcome of 72-hour return visit in a statistically significant manner. Of additional variables analyzed, race, age, distance to the emergency department, weekly and annual timing of visits, visit acuity and post-assessment disposition were all significantly correlated to the outcome of 72-hour return visit, as assessed by logistic regression.
Conclusions Although long thought to be a predictor of emergency department utilization and 72-hour return visits, insurance status does not appear to determine 72-hour return visits in a statistically significant manner. The additional variables of race and seasonal timing of visits, however, were found to relate to the outcome of 72- hour return visit in a statistically significant manner. Research is needed to further substantiate this relationship at other institutions and to identify means of
addressing disparities in emergency department use among pediatric patients.
Introduction
Although it has long been a quality measure of adult emergency departments (EDs), the
72-hour return visit (RV) analysis appears infrequently in pediatric ED (PED) research. Reasons
for investigating 72-hour RVs in adult EDs—including potential increased risk of medical
errors,1 as a target for quality improvement and improved patient care,2-7 and as a means of
identifying high-risk ―tracer‖ conditions8 —have not been analyzed with equal rigor in the
pediatric setting. While the most recent studies of both general EDs and PEDs indicate
same-facility 72-hour return visits only account for 2.5-3.5% of emergency department visits,1,9 this
percentage constituted approximately 650,000 ED cases in the US in 2000.10
Analysis of patient demographics is an important use of ED return visit data, as these
studies have the potential to reveal the type of patients most in need of additional medical
attention. Although a 2003 study of PEDs provides insight into diagnostic and institutional
factors associated with 48-hour PED RVs,1 this study does not include several descriptors of
pediatric patients who return to the PED within 72 hours, including patient insurance status,
reported interaction with primary care physicians, distance from the emergency department or
race, all of which are RV characteristics used in adult analyses. Despite myriad changes in the
insurance status of children throughout the country, the correlation between insurance status and
emergency department 72-hour RV has remained relatively under-analyzed since 1996.11 In adult
literature, a large body of research illustrates the correlation between lack of access to a primary
care provider, ED use and return visits,12-16 a phenomenon that has not been extensively
analyzed recently in pediatric populations.
We studied patient and selected system characteristics associated with 72-hour RVs to a
pediatric ED by insurance status. The primary objective of this study was to assess, by insurance
paucity of published analyses of 72-hour return visits in pediatric EDs, a secondary objective of
this study was to further define the frequency and characteristics of RVs in a PED as contrasted
to relatively well-defined adult ED RV statistics. This analysis provides insight into potential
etiologies underlying 72-hour RVs. Our hypothesis was that publicly-insured and uninsured
pediatric patients were more likely to return to the PED within 72 hours of their initial
presentation when compared to individuals with private insurance.
Methods
Study design, setting and population
We performed a retrospective review of the hospital’s centralized billing database and
electronic medical records to analyze characteristics of patients under 18 years of age seen in the
pediatric emergency department of a tertiary care academic university hospital. Our analysis
compared the records of patients who presented to the pediatric ED and returned within 72 hours
between the dates of 1/1/2005 through 12/1/2007 to the rest of the pediatric ED population seen
during that time. This study was approved by the Institutional Review Board at the University of
North Carolina at Chapel Hill.
Key outcome measures and independent variables
The main outcome of interest was return to the ED within 72 hours of initial presentation.
Independent variables identified from the centralized database include: patient age and gender,
insurance type, distance to pediatric ED (as measured by distance from ED to city of primary
billing address), chief complaint by diagnostic category, race, disposition (discharged, admitted,
left against medical advice, etc.), and diagnostic codes.
Statistical analysis
All data were entered into databases in both Microsoft Excel (Microsoft Office Excel;
2003) and STATA 10.0 (College Station, Texas: StataCorp, 2007); statistical analyses were
patients with only one visit within the 72-hour timeframe, all 72-hour RVs, and a set of the
patient-specific visits preceding the 72-hour RVs (pRVs). The primary outcome of 72-hour RV
was compared to non-RV patients with odds ratios using logistic regression in STATA. All tests
were two-tailed; p<0.005 was considered statistically significant.
Results
In the 36 months analyzed (1/ 2005 – 12/2007), 39,481 encounters with patients 18 years
of age or younger were recorded in the hospital database. A total of 1,392 72-hour RVs to the
emergency department were documented, representing a monthly mean of 39 ± 7 RVs. Overall,
however, minimum and maximum values for monthly RVs were between 23 and 55 RVs. These
RVs represented 3.53 ± 0.7% of pediatric ED visits. No patient visits were excluded from
analysis in this document.
Primary variable: Insurance type
Public insurance was the predominant payment type recorded in the database; 57.3% of
all non-RVs were classified as having public insurance. Private insurance was found in 26.9% of
these visits, while 13.0% of visits were recorded as self-pay visits. A total of 2.8% of non-RVs
and 2.6% of RVs recorded did not contain insurance information. Although these numbers
differed slightly between the general population and 72-hour RV patients, logistic regression
analysis revealed that there was no statistically significant difference in the distributions of
insurance types between all pediatric ED visits and 72-hour RV visits (p = 0.093). These results
Graph 1. Insurance types of non-RV and RV pediatric ED patients. 13 % 3 % 59 % 24 % 14 % 3 % 57 % 27 % 0 % 10 % 20 % 30 % 40 % 50 % 60 % 70 %
Public Private Self-Pay Unknow n
Pe rce n t o f p a ti e n t p o p u la ti o n
Distances from presenting ED: All non-RV patients and 72-hour RV patients
0% 5% 10% 15% 20% 25% 30% 35%
0 to 10 10 to 20 20 to 30 30 to 40 40 to 50 50 to 60 60 to 70 70+
Distance (miles) Pe rce n t o f Pa ti e n t C a te g o ry
Non-RV patients RV patients
Additional variable analysis
Age: Return visit patients were slightly younger than other patients; the mean age for non-RV patients was 7.3 ± 6 years, while the mean age for RV patients was 6.67 ± 6 years.
Logistic regression analysis indicated that this difference was statistically significant (p ≤
0.0001). These values were re-coded into three-year intervals; the resulting logistic regression
model was again statistically significant (p<0.0001), and it showed a statistically significant
relationship between patients of ages 3-6, 6-9, 9-12 and 12-15 years of age when compared to
patients 0-3 years old. The logistic regression model showed a decreased odds of returning to the
ED within 72 hours for all of these age ranges when compared to the 0-3 year old patient
population (p-values all <0.002).
Gender: Of non-RV patients, 45.9% were female, while 48.0% of RV patients were female; logistic regression indicates that males did not have a statistically significant increased
Race: Statistics regarding race were also reported in the hospital database. Of non-RV patients, 43.9% were classified Caucasian; the next largest groups were African-American
(28.3%) and Hispanic (21.0%). Of 72-hour RV patients, 38.5% were Caucasian and 29.5% were
African-American; Hispanics comprised 26.3% of this population. (Graph 2)
Graph 2. Pediatric patient race: non-RV ED patients and 72-hour RV patients.
0 5 10 15 20 25 30 35 40 45 50
Caucasian African-American Hispanic Other
Pe
rce
n
t
o
f
Pa
ti
e
n
ts
Distances from presenting ED: All non-RV patients and 72-hour RV patients
0% 5% 10% 15% 20% 25% 30% 35%
0 to 10 10 to 20 20 to 30 30 to 40 40 to 50 50 to 60 60 to 70 70+
Distance (miles)
Pe
rce
n
t
o
f
Pa
ti
e
n
t
C
a
te
g
o
ry
Non-RV patients RV patients
Logistic regression showed that race was a significant predictor of 72-hour RV. Hispanic
patients had 1.4 times the odds of returning within 72 hours when compared to Caucasian
patients (p<0.001), while African-American patients had 1.2 times higher odds of returning to
the ED within 72 hours when compared to Caucasian pediatric patients (p=0.01). No other races
were individually associated with increased odds of returning to the ED within 72 hours,
although the overall logistic regression analysis for race indicated that it was a statistically
significant predictor of 72-hour RV (p<0.001).
regression was used to compare the distance from the ED among 72-hour RV patients and the
rest of the pediatric ED population found a statistically significant correlation between distance
and odds of returning within 72 hours (p<0.001); RV patients had higher odds of living closer to
the ED than non-RV patients. (Graph 3)
Graph 3. Distances from primary billing address to presenting ED, Non-RV compared to 72-hour RV patients.
0% 5% 10% 15% 20% 25% 30% 35%
0 to 10 10 to 20 20 to 30 30 to 40 40 to 50 50+
Distance (miles) Pe rce n t o f Pa ti e n t C a te g o ry
Distances from presenting ED: All non-RV patients and 72-hour RV patients
0% 5% 10% 15% 20% 25% 30% 35%
0 to 10 10 to 20 20 to 30 30 to 40 40 to 50 50 to 60 60 to 70 70+
Distance (miles) Pe rce n t o f Pa ti e n t C a te g o ry
Non-RV patients RV patients
Timing of Visits: Timing of RVs was characterized with several types of time measurement, and included a discussion of non-RV encounters, 72-hour RVs, and
patient-specific visits preceding 72-hour RVs (pRVs). Time of day was analyzed using both shift and
hourly categories. The shift analysis involved grouping visits into three shifts: first shift
(8am-3:59pm), second shift (4pm-11:59pm), and third shift (midnight-7:59am).
Of non-RV visits, 49% occurred during second shift, while 40% were first shift visits. In
contrast, 72-hour RVs were more likely to occur during first shift (52%) than second shift (37%),
while visits preceding 72-hour RVs were similar to non-RV visits, i.e. more likely to occur
Logistic regression analysis found that 72-hour RVs had 1.7 times the odds of occurring
during first shift than during second shift (p<0.001), and 1.5 times the odds of occurring during
first shift than during third shift (p<0.001). Overall, the logistic regression analysis for shift time
showed a high correlation between time of presentation and RV or other visit status.
The timing of previous presentations was not significantly different from the timing of
non-RV presentations in general, and this value was also not correlated with the outcome of
72-hour RV in a statistically significant manner.
The hourly analysis of time of presentation was conducted using x-y plots and a 2-point
moving average. Gross observation of the resulting trendlines reveals that 72-hour RVs peaked
between 9am and noon, while non-RV visits were more likely to occur between 5pm and 9pm.
Timing of RVs was also measured using weekday of presentation. Non-RV pediatric ED
visits tended to occur more frequently on weekends and Mondays; non-repeat visits as a
percentage of total visits were greater than 15% on these days, while other weekdays’ patient
loads totaled between 13 and 14% of total visits. A similar pattern was observed for RVs,
although a higher percentage of these visits occurred on Sundays and Mondays (19% and 17%,
respectively) when compared to non-RV patients. The 72-hour RVs occurred more frequently on
Friday and Saturday (18% and 20%, respectively) when compared to the other two types of
visits. Logistic regression analysis found a statistically significant relationship between day of
the week and 72-hour RV (p<0.001). In this analysis, RV patients had statistically significantly
lower odds of presenting to the ED on any weekday except Monday when compared to non-RVs.
Logistic regression analysis of patient-specific visits preceding 72-hour RVs (pRVs) also found a
statistically significant relationship; this analysis revealed that pRVs had 1.5 and 1.4 times the
Seasonal Variation: Seasonal variation in the number of pediatric patients presenting to the ED was seen throughout the course of the timeframe analyzed, with peaks in the pediatric ED
patient load occurring approximately between October and May of each year. The database
showed seasonal variability in all visits and a marked monthly variation in the percentage of
RVs; the latter values were found within a range from 2.17% to 4.93% of all pediatric visits.
Maximal peaks in the number of 72-hour RVs were typically seen in June or July of each year,
demonstrating that—grossly assessed—seasonal variability in 72-hour RVs as a percentage of
the total pediatric ED population does not coincide with the seasonal variability seen in the
general pediatric population. (Graph 4)
Graph 4. Total monthly pediatric ED visits and monthly percentages of 72-hour return visits.
0 200 400 600 800 1,000 1,200 1,400 0 1 -2 0 0 5 0 2 -2 0 0 5 0 3 -2 0 0 5 0 4 -2 0 0 5 0 5 -2 0 0 5 0 6 -2 0 0 5 0 7 -2 0 0 5 0 8 -2 0 0 5 0 9 -2 0 0 5 1 0 -2 0 0 5 1 1 -2 0 0 5 1 2 -2 0 0 5 0 1 -2 0 0 6 0 2 -2 0 0 6 0 3 -2 0 0 6 0 4 -2 0 0 6 0 5 -2 0 0 6 0 6 -2 0 0 6 0 7 -2 0 0 6 0 8 -2 0 0 6 0 9 -2 0 0 6 1 0 -2 0 0 6 1 1 -2 0 0 6 1 2 -2 0 0 6 0 1 -2 0 0 7 0 2 -2 0 0 7 0 3 -2 0 0 7 0 4 -2 0 0 7 0 5 -2 0 0 7 0 6 -2 0 0 7 0 7 -2 0 0 7 0 8 -2 0 0 7 0 9 -2 0 0 7 1 0 -2 0 0 7 1 1 -2 0 0 7 1 2 -2 0 0 7 Date Pa ti e n ts se e n 0 % 1 % 2 % 3 % 4 % 5 % 6 %
Monthly Pediatric ED visits and Return Visits as a Percent of Monthly Visits
0 200 400 600 800 1,000 1,200 1,400 0 1 -2 0 0 5 0 2 -2 0 0 5 0 3 -2 0 0 5 0 4 -2 0 0 5 0 5 -2 0 0 5 0 6 -2 0 0 5 0 7 -2 0 0 5 0 8 -2 0 0 5 0 9 -2 0 0 5 1 0 -2 0 0 5 1 1 -2 0 0 5 1 2 -2 0 0 5 0 1 -2 0 0 6 0 2 -2 0 0 6 0 3 -2 0 0 6 0 4 -2 0 0 6 0 5 -2 0 0 6 0 6 -2 0 0 6 0 7 -2 0 0 6 0 8 -2 0 0 6 0 9 -2 0 0 6 1 0 -2 0 0 6 1 1 -2 0 0 6 1 2 -2 0 0 6 0 1 -2 0 0 7 0 2 -2 0 0 7 0 3 -2 0 0 7 0 4 -2 0 0 7 0 5 -2 0 0 7 0 6 -2 0 0 7 0 7 -2 0 0 7 0 8 -2 0 0 7 0 9 -2 0 0 7 1 0 -2 0 0 7 1 1 -2 0 0 7 1 2 -2 0 0 7 Date Pa ti e n ts se e n 0 % 1 % 2 % 3 % 4 % 5 % 6 %
Visits per month RVs as a Percent of Monthly Visits
3-month moving average of total visits 3-month moving average of RVs
Condition-related Variables
patients, RV patients and for those visits preceding the return visit. Significant portions of these
data were incomplete: 12% of all non-RVs, 22% of RVs, and 14% of pRVs did not contain
diagnostic data.
The most common ICD-9 category observed in this patient population was that of
―Symptoms, signs and ill-defined conditions‖, which accounted for 30%, 44% and 44% of the
non-repeat visits, 72-hour RVs, and visits preceding 72-hour RVs, respectively. Logistic
regression analyses were not run on these data because diagnoses were not recorded in the
database for a significant percentage of patient visits. (Table 1)
Table 1. Diagnoses of pediatric ED patients as a percentage of visits within each category.
ICD-9 Classification Non-RVs RVs pRVs
Symptoms, signs, and ill-defined conditions 29.97 % 43.97 % 43.97 %
Injury and poisoning 19.04 % 9.69 % 9.69 %
Diseases of the respiratory system 9.62 % 9.29 % 9.29 %
External causes of injury 8.61 % 4.13 % 4.13 %
Diseases of the sense organs 5.12 % 4.16 % 4.16 %
Infectious and parasitic diseases 4.84 % 5.37 % 5.37 %
Mental disorders 4.83 % 2.75 % 2.75 %
Diseases of the digestive system 4.34 % 3.26 % 3.26 % Endocrine, nutritional/metabolic diseases, immunity disorders 2.25 % 2.09 % 2.09 % Diseases of the skin and subcutaneous tissue 2.23 % 4.79 % 4.79 % Diseases of the muskuloskeletal system and connective tissue 2.21 % 2.22 % 2.22 % Diseases of the genitourinary system 2.00 % 2.28 % 2.28 %
Other* 4.94 % 6.01 % 6.01 %
*―Other‖ denotes diseases of the nervous system, diseases of the blood and blood-forming organs, congenital anomalies, perinatal conditions, neoplasms, complications of pregnancy and the ICD-9 supplemental classification. Each of these categories contributed to <2% of the visits in each category. RV: hour return visits. RV: 72-hour return visits. pRV: patient-specific visits preceding RV.
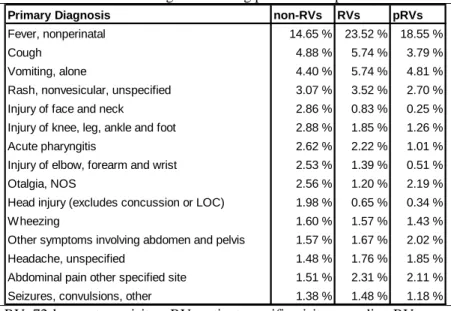
Of those patient visits for which a diagnosis was recorded, the most common diagnosis
was non-perinatal fever. Other common diagnoses included cough, vomiting without
complications, nonvesicular rashes, injuries of the head and lower extremity, acute pharyngitis
To assess similarities
between initial and RV
diagnoses, all diagnoses were
first grouped into ICD-9
categories and an Excel
spreadsheet was used to
compare initial and subsequent
diagnosis. Using this method, it
was ascertained that 63.8% of
72-hour RVs resulted in the same diagnosis as that given during the initial presentation.
Acuity: Visit acuity was scored on a 0-5 scale by ED physicians according to hospital practice at the time of the patient’s initial assessment. Mean acuity scores were 3.32 ± 1, 3.34 ± 1
and 3.29 ± 0.9 for non-RV patients, hour RV patients and patient-specific visits preceding
72-hour RVs, respectively. Logistic regression analyzing return to the ED within 72 72-hours and
reported acuity found that, overall, acuity level was significantly correlated with likelihood of
72-hour RV (p<0.0001). Although logistic regression analyses of acuity revealed that, when
compared with patients with an acuity level of 3, those individuals with the lowest (0) and
highest (5) acuity levels had greater odds (1.3 and 1.2 times the odds, respectively) of returning
within 72 hours, these results were not statistically significant.
Disposition: Patient post-ED dispositions were grouped into five general categories: admitted to the hospital, discharged to home, left against medical advice (AMA), left without
being seen by a physician, and other, which included patients who were transferred to other
institutions or died while in the emergency department.
Table 2. Most common diagnoses among pediatric ED patients.
Primary Diagnosis non-RVs RVs pRVs
Fever, nonperinatal 14.65 % 23.52 % 18.55 %
Cough 4.88 % 5.74 % 3.79 %
Vomiting, alone 4.40 % 5.74 % 4.81 %
Rash, nonvesicular, unspecified 3.07 % 3.52 % 2.70 %
Injury of face and neck 2.86 % 0.83 % 0.25 %
Injury of knee, leg, ankle and foot 2.88 % 1.85 % 1.26 %
Acute pharyngitis 2.62 % 2.22 % 1.01 %
Injury of elbow, forearm and wrist 2.53 % 1.39 % 0.51 %
Otalgia, NOS 2.56 % 1.20 % 2.19 %
Head injury (excludes concussion or LOC) 1.98 % 0.65 % 0.34 %
Wheezing 1.60 % 1.57 % 1.43 %
Other symptoms involving abdomen and pelvis 1.57 % 1.67 % 2.02 %
Headache, unspecified 1.48 % 1.76 % 1.85 %
The majority of all patients were discharged to home or home health care after their
initial ED presentation. Among non-72-hour RV patients, 81% were discharged, 16% were
admitted, 0.6% left AMA, 1% left without being seen, and 1% fell into the ―other‖ category. Of
these, 11 patients died while in the emergency department.
Of 72-hour RV patients, 22% were admitted, and 75% were discharged to home. Among
patient-specific visits preceding 72-hour RVs, 91% were discharged to home. Naturally, far
fewer (3%) had been admitted to the hospital; the fact that this group returned to the ED within
72 hours indicates strong selection for non-admitted patients. In this group, 3% left the ED
without being seen by a physician, a level twice that of the non-RV population. This group also
had twice the percentage of patients who left AMA when compared to non-RV patients.
Logistic regression analysis of disposition revealed a statistically significant overall
correlation between disposition and 72-hour RV status (p<0.0001). Within this analysis, the most
statistically significant difference was in admissions; 72-hour RV patients had 1.5 times the odds
of being admitted to the hospital when compared to non-RV patients (p<0.001). Other
disposition categories did not relate to 72-hour RV in a statistically significant manner.
The logistic regression analysis of patient-specific visits preceding 72-hour RVs also
showed a statistically significant relationship between disposition status and visits preceding
RVs (p<0.0001). Admission status was statistically related to pre-RV status, presumably for the
reasons detailed above. The odds of patients leaving AMA or without being seen by a physician
were significantly related to subsequent RV; patients who ultimately returned within 72 hours
had 2.3 times the odds of leaving AMA (p<0.001) and 2.1 times the odds of leaving without
Table 3. Disposition of pediatric ED patients.
n % n % n %
Discharged to home 30,695 80.6% 1,046 75.1% 1,261 90.6% Admitted to the hospital 6,147 16.1% 307 22.1% 46 3.3% Left without being seen 559 1.5% 15 1.1% 45 3.2%
Other* 478 1.3% 19 1.4% 21 1.5%
Left AMA 210 0.6% 5 0.4% 19 1.4%
non-RVs RVs pRVs
Disposition
*―Other‖ denotes patients transferred to another institution and patients who died in emergency department. AMA: against medical advice, RVs: 72-hour return visits, pRVs: patient-specific visits preceding 72-hour RVs.
Discussion
Primary Variable of Interest and Outcome
This study represents the first attempt to characterize the relationship between insurance
status and 72-hour RVs in a pediatric ED population. Ultimately, logistic regression found no
statistically significant difference between the type of insurance of non-RV and RV patients. The
hypothesis that public insurance or no insurance increases the likelihood of 72-hour RV cannot
be proven; in this study, insurance status was not correlated in a statistically significant manner
with the outcome of 72-hour RV.
Additional Variables
Race: One of the most statistically significant predictors of 72-hour RV was non-Caucasian race, and Hispanic or African-American race in particular. Explanations for
differential medical compliance and access to primary care among African-American
populations are the subject of several recent studies. One potential reason for this difference is
race-specific distrust of the US medical system, a concern expressed by Armstrong et al. in
2008.17 Reasons for increased RVs in Hispanic patients are, in some ways, easier to identify.
Language barriers in this population frequently result in miscommunication regarding both
symptoms and treatments, both of which could result in increased RVs. In addition, cultural
the increased likelihood that this population would rely more heavily on the pediatric ED for
care, resulting in increased RVs. In addition, recent immigrants to the US may have decreased
access to primary care providers, and thus be more reliant on emergency services.
Age: The analysis of age statistics reveals a trend similar to that observed by Alessandrini et al.,1 namely that younger patients are more likely to return to the ED within 72 hours of their
initial presentation. Potential reasons for the increased likelihood of RV include parental anxiety,
rapid progression of condition, and the provider’s level of comfort in appropriate diagnoses and
treatment for younger pediatric patients. Another possible reason for increased RV is provider
call-backs; given the potential rapidity of clinical progression in younger children, providers may
be more inclined to call these individuals back to the ED for monitoring.
Timing of Visits: The timing analysis revealed that RVs are more likely to occur during first shift, i.e. during the middle of the day. Hourly timing analyses found that RV patient visits
peaked earlier in the day than the non-RV population’s visits, indicating perhaps parental
perceptions of acuity or ED call-back timing. Weekday analysis of pRVs found that those visits
ultimately culminating in 72-hour RV were more likely to occur on Fridays and Saturdays. This
observation brings up concerns regarding ED staffing and—possibly—the level of resident
oversight on these days.
One of the most striking conclusions from the timing analysis, however, is the difference
between seasonal peaks in pediatric ED attendance and the number of RVs seen (Graph 4). In
effect, RVs peak during times when clinic visits are lower than during the rest of the year. This
stands in direct opposition to the observations of Alessandrini et al.,1 who found that RV levels
increased during times of increased pediatric ED usage. One possible explanation for the
the system and begin seeing patients in the pediatric ED, oversight by attending physicians may
be stretched beyond its capabilities, resulting in diagnostic and treatment oversights culminating
in 72-hour RVs.
Another possible explanation involves the type of complaint seen during summer months.
If patients seen during the higher peaks of ED usage are more likely to have respiratory tract
infections and other seasonal concerns, it is possible that diagnoses during the summer are
related to different activities, including injuries requiring multiple visits.
Access to primary care and specialty clinic follow-up during the summer may also be an
issue. If many clinics in the area of the ED are not staffed at full capacity during the summer, it is
plausible that follow-up visits in outpatient clinics may not be accessible during summer months,
resulting in increased 72-hour RVs.
Gender: The male predominance in both the non-RV and RV pediatric population corresponds with past research into the type of patients presenting for emergency services. The
difference was not large enough, however, to provide conclusive evidence that gender was a
predictor of 72-hour RV.
Distance to ED: Mean distances between RV patients’ primary billing address and the ED were lower than those of non-RV patients. While this observation may indicate that distance
from the ED represents a barrier to care for ED patients, the more general conclusion is that
increasing proximity to the ED increases the likelihood of RVs. In this case, however, distance
may be a proxy for other confounding variables. For example, if families of children with
chronic conditions are more likely to live near a tertiary care center, then these individuals will,
presumably, have higher 72-hour RV rates when compared to individuals living further away.
Diagnoses: Diagnosis was not a key focus of this analysis, and one of the major shortcomings of the database analyzed is the availability of diagnoses for each patient. At the
same time, however, the predominance of non-perinatal fevers in the RV population was higher
in RV patients, despite only a modest increase in this diagnosis’ frequency for pRV cases. While
this fact may represent progression of the condition seen in the pRV, it may also be a
manifestation of parental concerns as a driving force behind 72-hour RVs that could, potentially,
be addressed in an outpatient setting if available.
ICD-9 classification of diagnoses revealed a higher percentage of RVs and pRVs
presenting within the category of symptoms and signs of ill-defined conditions. This may be
more a reflection of the nature of emergency medicine than having bearing on RVs and
non-RVs; almost all of the diagnoses in this category are either ―transient‖, ―not otherwise specified‖
or ―unknown etiology‖. The concordance between ICD-9 categories of pRVs and RVs is also not
especially striking, given the broad scope of the predominant ICD-9 category.
Acuity: Acuity was, overall, a significant predictor of 72-hour RV. A higher percentage of RVs was classified with acuity levels of 3 and 5 than non-RVs, although these differences
were not statistically significant. Mean acuity levels were not higher for 72-hour RVs when
compared to non-RVs, possibly indicating that RVs could have been handled in an outpatient
setting as opposed to the pediatric ED.
Disposition: In direct contrast to the lack of differences in acuity levels, 72-hour RV patients had 1.5 times the odds of being admitted when compared to non-RV patients. The
differences between acuity and disposition are somewhat perplexing, although the timing of the
acuity score for RVs could help to explain the perceived difference in severity of illness. For
the case with the patient indicated that a prior visit had taken place, then acuity and need for
admission would be unrelated, and the former could be low while despite the patient’s admission
to the hospital.
Shortcomings of this study
There are several important shortcomings in this study. First, this database is primarily
kept for billing purposes, and is not necessarily an entirely reliable repository of non-financial
information. That being said, the database is fully integrated with the hospital’s charting records,
so that while not all of the data were collated for the purposes of clinical interaction, it is
reasonable to assume that they are a credible reflection of the original clinical information.
The nature of RVs in this study is not defined; RVs are not classified into spontaneous (or
patient-driven) returns, ED call-backs, or similar characteristics. Without this information, it is
extremely difficult to draw meaningful conclusions regarding the etiology for callbacks. The
results are thus restricted to a descriptive analysis of the data, and causal relationships can only
be educated guesses.
Conclusions
This analysis presents a set of conclusions regarding insurance status and 72-hour RVs
that has not be analyzed in a pediatric emergency population to date. While the significant
variability between emergency departments precludes making policy or institutional decisions
about the topic prior to a more full assessment of the relationship in a variety of settings, this
research illustrates the need for further evaluations of the reasons underlying 72-hour RVs
among pediatric ED users.
The additional variables analyzed in this study provide a great deal of insight into the
issue of recidivism in pediatric emergency settings. The statistically significant relationship
be a proxy for other characteristics of patient care, such as distrust of the medical system or
providers’ preconceived notions regarding access to primary care or adherence to treatment
regimens.
This study duplicates one element of the analysis provided by Alessandrini et al., namely
that 72-hour RVs in the pediatric emergency population are similar to those seen in adult ED
literature. The differences between seasonal patterns in the pediatric ED population may be an
indication of systemic rather than diagnosis-related concerns that are driving RVs. Further
research into the etiology of a summer peak in RVs is warranted. It is possible that additional
measures should be taken to relieve excessive caseloads on inexperienced house staff, or to
increase surveillance of their actions during the first two to three months of their residency.
Acknowledgements
The author gratefully acknowledges Dr Margaret Gourlay and Mr. Sergio Rabinovich for
their expert advice in producing this manuscript. I also thank Cathy Zimmer of the Odum
Institute for her advice, and Dr Joanne Garrett for her excellent biostatistics course and the
―predxcat‖ and ―predxcon‖ Stata modules. Lastly, I would like to thank my wife, Lily
Pemberton, for her patience and recommendations throughout the process of this research.
Addenda
Addendum: Expanded Introduction
The 72-hour return visit (RV) rate is a traditional assessment tool of adult emergency
departments (EDs), however this measure appears infrequently in pediatric ED research.
Literature in adult ED populations describes a variety of reasons for analysis of RVs. The
uses described above (medical errors,1 quality and patient care improvement,2-7 and as a source
of ―tracer conditions‖8
) illustrate only a small section of an extensive body of literature. At
times, the additional conditions indicate potentially significant lapses in doctor/patient
communication, including several studies from the 1980s indicating that return visits may be an
indication that initial treatment was inadequate,18 that discharge instructions were poorly
communicated,19 or that appropriate follow-up was either unavailable or not arranged.20
Other studies have shown that a lack of continuity of care, as illustrated by repeat visits to
ED, can be problematic, especially for patients with chronic conditions 21 A large body of
literature has indicated that the majority of short-term repeat hospital visits may be medically
unnecessary,13,22-27 a question that could only be completely resolved in the setting of this study
via extensive chart review, with a verification process using multiple experts in the field of
pediatric emergency medicine to ascertain the benefit of subsequent visits.
Most intriguing for this document, however, are those studies among adult ED recidivists
indicating that these patients represent a high-risk population being subjected to high-risk visits5,6
Adult patients who return to the ED within 72 hours of their initial presentation are typically
described as a high-risk population, providing further justification for efforts aimed at decreasing
returns.5,6
Actual data pertaining to the emergency department 72-hour RV rate present an
institution by RVs. Current studies show that although return visits can decrease productivity and
quality of care, same-facility 72-hour return visits only account for 2.5-3.5% of general
emergency department visits over time.9 It is interesting to note, however, that these studies
account for the percentage of RVs as part of the total number of visits without an accompanying
analysis of the amount of time spent on the subsequent visits. While the few studies that have
handled this issue in pediatric EDs indicate similar return visit rates,1 these studies also do not
analyze the amount of time and resources spent on each individual patient visits, and the question
of the true burden of ED recidivism on the whole system remains unanswered.
Although studies have focused on RVs as a quality improvement tool, a majority have
found that progression of disease, and not medical errors, is the cause of most RVs.2,5 Clearly,
this observation merits a discussion of publication bias. In their 2005 review of publication bias,
Dubben and Beck-Bornholdt28 described the phenomenon in which positive results have a better
chance of being published, are published earlier, and are published in journals with higher
―impact factors‖, all of which can lead to an overestimation of their effects. In this case,
publication bias could assume the form of an ED being more likely to see negative results
relating to RVs as a target for practice or system changes, while positive results—including the
progression of disease leading to the return visit—are preferentially published. Clearly, the
resulting body literature could thus be biased.
Despite the relatively low burden of RVs in an individual institution, research has
documented that almost one-third of unscheduled RV cases could be avoided5,6 , including
patients who are discharged again after reevaluation and patients admitted on return. RVs have
also been targeted in an effort to prevent misuse or overuse of already overcrowded EDs.1,4,5,7 In
approximately 70% of 72-hr return visits to US EDs were for follow-up services, which could
possibly have occurred in a PCP setting.29 An essential question raised by this conclusion—and
the primary justification for conducting the present study—is the question of how insurance
status influences the use of non-ED facilities for follow up services.
The low percentage of total ED visits represented by returns indicates that decreasing this
percentage probably won’t affect the overall caseload of a single facility significantly. Viewing
ED return visits as a result—not a cause—of inappropriate care or inappropriate use of facilities
can provide insight into quality and inefficiency of care provided. For example, studies
classifying ED returns as either ―avoidable‖ or ―unavoidable‖ have allowed analysts to
retrospectively identify means of improving care and changing medical practice.2
Past Research and Shortcomings: One of the most important uses of ED return visit data
lies in analyses of patient demographics, which can reveal the type of patients most in need of
additional medical support. Although a study conducted in 2004 analyzed 48-hour pediatric ED
return visits in the context of diagnosis and institutional factors (e.g. scheduled returns,
call-backs and unscheduled returns),1 its authors excluded several essential descriptors of pediatric
patients who return to the ED within 72 hours. This study assessed diagnoses at time of
discharge, age, admission statistics, nursing triage category, date and time of RV and whether
RVs were scheduled. Its authors did not include information pertaining to patient insurance
status, distance from the emergency department or race.
A 1996 study of pediatric patients in general EDs stratified return visits by location and
income level using census tract data presents several of the patient characteristics that have yet to
be fully characterized in pediatric ED users.11 In this study’s population, pediatric patients from
more affluent tracts. In addition, the authors’ data indicated that almost 50% of pediatric ED
patients had either public or no insurance, indicating that insurance status could be one of the
most significant predictors of return visits.
What This Paper Intends to Do: The primary research question of this study is: Among
public insurance users, privately-insured and uninsured patients from birth until 18 years of age,
what patient characteristics are associated with 72-hour return visits in an academic pediatric
emergency department?
Methods for systematic literature search
To identify articles pertaining to pediatric emergency medicine, we used the following
MeSH terms in the MEDLINE/PubMed database to identify articles published between January
1960 and February 2008 in the field of pediatric emergency medicine: "hospitals, pediatric"
AND ("emergencies" OR "emergency service, hospital" OR "emergency treatment" OR
"emergency medicine"). We further qualified this sequence by adding the search terms ―AND
return‖, ―AND recidivism‖, ―AND 72 hour‖ and ―AND 48 hour‖ (independently) to further
identify articles related to pediatric ED return visits. We also performed an expanded
MEDLINE/PubMed search of published literature on the subject using the search terms
―pediatric‖ AND ―emergency‖ AND ―return‖. We reviewed English language abstracts in
peer-reviewed journals for relevant articles from both search techniques. Articles were included if
they reported descriptive analyses of pediatric return visits in US hospitals. Given the narrow
area of focus, all population sizes were considered, and the timeframe of RVs was not specified
in these criteria.
Searching with the MeSH sequence and ―return‖ yielded 17 results, 16 of which were
terms ―recidivism‖, ―72 hour‖ and ―48 hour‖ did not yield relevant additional articles. The
expanded MEDLINE/PubMed search yielded a total of 102 articles, 82 of which were excluded.
After abstract review using the criteria described above, a total of 1 additional article was found;
thus, a total of 2 articles were included for review in the study. (Note that, for purposes of
identifying research and analysis techniques, I included a Canadian paper on 72-hour RVs,
which I identified using the above criteria.)
Systematic Review
The literature search described above identified three studies of return visit patients in
pediatric emergency departments. The most relevant of the three articles reviewed was published
in 2004 by Alessandrini et al.1 Given the lack of published research on the topic of RVs in
PEDs, the authors of this article determined to identify the incidence of 48 RVs, types of RVs
and associated factors. The authors conducted a retrospective study of patients seen in the ED of
an urban tertiary care teaching hospital in 1998; in their methods section, they describe first
identifying 48-hour RVs from a computerized log in which basic demographic data as well as
chief complaint, nursing triage category, discharge diagnosis and admission status. Although it is
not entirely clear from the authors’ study protocol, the authors state later in the article that no
chart review was performed, rather that they accessed the computer log database and extracted
data from it. This includes identification of certain visit characteristics, including whether the
visit was unscheduled, scheduled, patient was called back or left without being seen. There is no
information as to whether this information was verified by each physician or merely recorded by
one investigator.
The authors also analyzed data to determine what visits occurred on weekends and 7
interest was RV within 48 hours of initial presentation. The authors sought to determine
associations between this outcome and a variety of variables, including diagnosis, day/shift/date
of presentation, age and sex. Diagnoses were grouped first into 28 different final diagnoses
(based on whether the diagnosis had occurred more than 5 times in the dataset), then into four
categories: respiratory-related, infectious, trauma and miscellaneous.
The authors found a total RV rate of 3.5%, noting that 79% were unscheduled, 17%
scheduled, and 4% called back to the ED. Infectious disease, respiratory disease and trauma were
the most common RV diagnoses. In the 1,893 48-hour RVs identified (out of 54,784 visits), RV
patients were more likely to be younger than 2 years old, to be admitted to the hospital, and to be
triaged as acute; relative risks for these groups were 1.3, 1.3 and 1.1, respectively. The mean age
of patients with RVs was 4.6 years, with a median of 2 years. Nearly 50% of RV diagnoses were
infectious; more than half of these were fever or viral illness or head and neck infections
(pharyngitis, otitis media). Asthma and reactive airway disease was the most common respiratory
diagnosis; burns were the most common trauma diagnosis. In their analysis of the timing of RVs,
the authors found that RV timing reflected the timing of visits by the total ED population; in
other words, their analyses of shift, weekend and holiday-related RVs revealed a temporal
association between the RV patients and increased PED visits in general.
RVs in particular were, overall, related to the initial presentation; only 4% were for
unrelated complaints; interestingly, however, there was no difference in the proportion of
patients with high acuity at the initial visit and the RV. RV patients younger than 1 year of age
were more likely to be called back by the physician than older patients; 38% of total call-backs
The authors also detected seasonal variation in RVs—with an increase in RVs during
winter months—even when controlling for baseline patient volume. The authors had two
hypotheses about this observation: the first was that RVs increase with the increase in infectious
diseases in winter months. The second hypothesis was that, in times when ED volume increases,
the ED is more hectic and less patient/parent teaching takes place at discharge. The authors were
careful to note that an attending physician saw every patient, ruling out concerns regarding
unsupervised house staff.
Alessandrini et al.1 noted several differences between their study data and those
associated with adult ED RV literature. One adult study identifies musculoskeletal trauma as the
most common reason for RV, with toxicology and cardiovascular disease representing the
highest percentage of avoidable returns. 5 This study has several limitations. The authors’
decision not to perform a chart review and to rely on computer log databases raises the question
of accuracy in the computer log. There are several potential sources for bias in a computerized
database, including potential for the influence of billing, e.g. increased reimbursement for certain
ICD-9 diagnostic codes or acuity levels. This problem could have been resolved, to a great
extent, by reviewing charts for a randomly selected group of individuals within the sample in
order to get an idea of overall accuracy.
The second article identified was published in 2006 by Goldman et al. 30 Although this
study was conducted in Canada, I have included it for analysis due to the extremely limited
amount of research on the subject, and to further assess analysis techniques that might be
pertinent for my own research. The authors of this study reviewed records of patient visits to a
acuity; they excluded individuals who left without being seen, left against medical advice, or
were admitted to the hospital.
Goldman et al. found a 5.2% 72-hour RV, with 25% of patients returning within 72 hours
under the age of 1 year, and with increasing likelihood of RV with decreasing age. In addition,
the higher the initial visit acuity, the more likely the patient was to return within 72 hours. The
authors also found a temporal element, with an increased likelihood of 72-hour RV correlated
with the busiest ED hours (8pm until midnight).
The authors reported their results as odds ratios, a different approach from Alessandrini et
al., and possibly more appropriate in the case of a retrospective study. They also detected no
seasonal variation in either univariate or multivariate analyses, although there were lower RV
rates during spring and fall when compared to winter and spring. Goldman et al. note that the
strongest influence on 72-hour RVs is patient age—an observation seen in other analyses—and
attributed by the authors to underdeveloped communication skills.
Of note, the authors excluded 7,241 patients from the database for analysis. The reasons
for exclusion included that patients left without being seen, left against medical advice, were
admitted, were transferred, or did not have a recorded disposition. The authors do not specify
numbers of patients in each of these categories, allowing the possibility of significant
underreporting of the true number of RVs seen. The authors cite the inability to discern why
patients are returning to the ED so soon after discharge as a limitation of their study. Many of the
differences between the results of Goldman et al. and Alessandrini et al.’s studies might be
attributed to differences between the Canadian and US health systems.
The third article I analyzed is LeDuc et al.’s 2006 analysis of PED recidivism,31
in which
associated with 3-month and 48-hour return visits. The authors looked at a sample of 932
patients and analyzed the prevalence of visits within the previous three months and 48 hours.
Four percent of their sample had presented for a short-term preceding ED admission.
Seventy percent of the 48-hour RV patients had a primary care provider and insurance coverage,
and age, health insurance and symptom severity were not related to RV status. The most frequent
cause of 48-hour RV in this population was lack of availability of a primary care provider at the
time of the visit, confirmed by higher frequency of visits during evening and weekend hours.
The authors report, based on their analysis, that traditional determinants of ED utilization
(listing insurance and chronicity of symptoms) are not reliable predictors of RVs, while risk
factors of age, race and diagnosis were significantly associated with return visits. They did
identify certain specific diseases or conditions that warranted focused attention, including
neurological disease, infections and parasitic diseases. Their results in the 48-hour patients RVs
aren’t especially reliable, however, due to the fact that they identified and reviewed charts for
only 38 patients who returned to the PED within 48 hours.
Inclusion/Exclusion Checklist
This checklist is adapted from Cook et al.32
Citation
Level of review: Title Abstract Article Date of review: / /
Reviewer: Hallam Gugelmann
Selection Criteria Met
Population: Does the study specifically address pediatric (≤18yrs) patients? yes no Setting: Does the study take place in an emergency department setting? yes no Outcome: Does the study include a discussion of return visits to the ED? yes no
Action: Include Exclude
Reasons for exclusion:
Quality scoring checklist
0=poor, 1=fair, 2=good, 3=excellent
Authors, Year
Source Population Description
Study Population Representative
of Source?
Adequate data collection?
Data collectors identified?
Appropriate analysis?
Adequate result reporting?
Overall quality
score (max:18) Alessandrini,
Lavelle, Grenfell, Jacobstein, Shaw; 2004
2 2 3 2 2 3 14
Goldman et al. 2006
2 1 1 1 2 2 9
LeDuc et al. 2006
2 2 1 1 1 1 8
Statistical Analysis
Past authors analyze emergency department RV data using a variety of methods.
Alessandrini et al.1 used Pearson’s chi-square (χ2) or relative risks (with Cornfield 95%
confidence intervals) for categorical data, and either Student’s t-tests or the Mann-Whitney U
Statistic (Wilcoxon rank-sum) for continuous data. All of these tests were 2-tailed, with a p-value
cutoff of <0.05 for consideration of statistical significance. On further analysis of their work,
these authors described univariate statistics using percentages to obtain an overall understanding
of their study population.
The authors describe their study as a ―retrospective cohort analysis‖. Cohort studies
involve the identification of a disease- (or outcome-) free group of people (a cohort) who are
grouped according to exposure to a potential cause of the disease or outcome in question.33 In
other words, cohort studies involve identification of population by exposure and subsequent
measurement of outcome. The measurement involved is incidence, and the measure of
association is the risk ratio.
For the purposes of RV analysis, the exposure is visiting the ED, and the outcome is 72-hour
After reviewing the data involved in this study, we decided that the dataset was large enough
to conduct logistic regression as described in the ―Methods‖ section above.
Addendum to Results
Overview: For the purposes of both the above manuscript and the current addendum, the data
extracted from the patient database is organized according to the ―Outline of Manuscript
Results‖ box below. Given that these sections are represented in abbreviated format in the
manuscript’s ―Results‖ section, this addendum will serve as a supplement to the information
presented above.
1. Descriptive Statistics ● Patient characteristics:
Primary variable: Insurance Type: Insurance
type was initially recorded in 114 separate payer
types. Google searches served to identify which of
these could be classified as private or public (either
federal, state or military-funded) insurance types.
The data were then simplified and recoded into the four main insurance types (those listed above,
with the addition of a category for ―unknown‖ status).
Age: Patient age at the time of presentation was initially presented in months. These data
were converted to years, then grouped by year (0-1 year old, 1-2 years, etc.). Dummy variables
were generated for each year in Stata and the logistic regression model was run. It is important to
note that although the results were statistically significant, increasing the number of variables
included in the model increases the likelihood that a statistically significant relationship will be
found. These data were then recoded into 3-year intervals (0-3, 3-6, etc.) and the logistic
regression model was re-run. Again, the overall result was statistically significant, and showed Outline of Manuscript Results
1. Descriptive Statistics ● Patient characteristics
Primary variable: Insurance Age
Gender Race
Distance to ED ● Timing-related statistics
● Diagnosis or condition-related data 2. RV-specific analyses
● Timing-related statistics
that patients between the ages of 3-6, 6-9, 9-12 and 12-15 had statistically significantly lower
odds of returning to the ED within 72 hours when compared to patients of age 0-3.
Gender: [see manuscript section]
Race: [see manuscript section and Shortcomings section]
Distance to ED: The database includes billing addresses for almost all of the patients
presenting to the ED during the timeframe analyzed. Using billing address as a proxy, I was
interested in ascertaining whether living closer to the ED might have bearing on 72-hour RV
rates. This involved measuring the distances between the 1,173 recorded city of residence and
the ED using GoogleMaps, then re-coding the database to present distances instead of city of
residence. These distances were then divided into 10-mile increments from 0 miles to the final
category of 50+ miles; these data were used in the logistic regression model to identify a
relationship.
● Timing-related characteristics
Shift analysis: Data related to timing of patient visits and return visits were first
categorized into eight-hour shifts as a means of grossly assessing the most common times of
presentation for individual visit types. Individual RV patients’ preceding visits were included in
the analysis in order to identify a causal relationship between time of presentation and visits
resulting in 72-hour RVs. These results are presented in Addendum Graph 1.
Advanced timing analysis: In order to further characterize the relationship between
timing with RV status in the patient population, data were also analyzed by grouping numbers of
pediatric ED patients by the hour in which they presented to the ED. Because analysis of 24
separate data points using logistic regression is not meaningful (i.e., compounding of potential
graphically using simple x-y plots and a 2-point moving average of times of presentation.
(Addendum Graph 2)
Weekday analysis: The timing assessment of the dataset included an assessment of all
visits, 72-hour RVs and visits preceding 72-hour RVs by weekday of presentation. This involved
converting the date of arrival to a weekday, then combining all values for each weekday into a
single category. The resulting 7 categories were then graphed with Excel and analyzed using
logistic regression in Stata. (Addendum Graph 3)
Seasonal Variation: [see manuscript]
● Condition-related analyses
Diagnoses: Diagnoses were recorded in the database in the form of ICD-9 codes in any of
ten final diagnosis categories and one ED admission diagnosis. The difficulty in this analysis lay
in the extreme variability of the diagnosis recorded: where some patients would have more than
5 diagnoses in the dataset, others would only have 1, or—in some cases—none. This fact made it
extremely difficult to ascertain what the most prevalent diagnoses were, or even the percentage
of patients for whom no diagnosis was recorded. Ultimately, I decided to identify a single
diagnosis for each individual visit; if no ED admitting diagnosis was available, I used the first
available value for any of the supplemental diagnoses. Despite using this approach, a significant
portion of these values were not available, as described above. This is discussed in detail in the
Discussion section.
Acuity: It is important to note that acuity was estimated by physicians in the ED, and that
a rigorous, pre-defined rubric for determining this value is not currently in use in the population
being analyzed.
Disposition: Disposition was originally recorded in 19 categories, and values for this
Addendum: Additional Graphs and Tables
Addendum Table 1. Summary of recorded insurance status of pediatric ED visits: All non-72-hour return visits compared to RVs.
Non-RV Patients RV Patients
n % n %
Private 10,293 27.0 % 340 24.4 %
Public 21,795 57.2 % 816 58.6 %
Self-Pay 4,915 12.9 % 200 14.4 %
Unknown 1,086 2.9 % 36 2.6 %
38,089 1,392
RV: 72-hour return visits.
Addendum Graph 1. Time of presentation of pediatric patients in the ED by visit type: Non-return visits, hour return visits, and visits preceding 72-hour returns.
0 % 10 % 20 % 30 % 40 % 50 % 60 %
Shift 1 (8am-3:59pm) Shift 2 (4pm-11:59pm) Shift 3 (midnight-7:59am)
Timing (by shift)
Pe
rce
n
ta
g
e
o
f
to
ta
l
vi
si
ts
0 % 10 % 20 % 30 % 40 % 50 % 60 %
Shift 1 Shift 2 Shift 3
Timing (by shift)
Pe
rce
n
ta
g
e
o
f
to
ta
l
vi
si
ts
Addendum Graph 2. Timing of all visits and RVs by hour. 0 % 1 % 2 % 3 % 4 % 5 % 6 % 7 % 8 % 9 % 12-1am
2-3am 4-5am 6-7am 8-9am 10-11am
12-1pm
2-3pm 4-5pm 6-7pm 8-9pm 10-11pm Timing (hourly) Pe rce n ta g e o f to ta l vi si ts
Timing of pediatric patient visits to the ED
0 % 1 % 2 % 3 % 4 % 5 % 6 % 7 % 8 % 9 % 12-1am
2-3am 4-5am 6-7am 8-9am 10-11am
12-1pm
2-3pm 4-5pm 6-7pm 8-9pm 10-11pm
Timing (by shift)
Pe rce n ta g e o f to ta l vi si ts
non-RV patients RV patients
2-point moving average of RVs 2-point moving average of non-RV patients
Addendum Graph 3. Timing of visits by weekday: Non-RV patients, 72-hour RV patients, and visits resulting in 72-hour RV.
2 % 4 % 6 % 8 % 10 % 12 % 14 % 16 % 18 % 20 % Pe rce n ta g e o f to ta l vi si ts p e r ca te g o ry 0 % 2 % 4 % 6 % 8 % 10 % 12 % 14 % 16 % 18 % 20 %
Monday Tuesday Wednesday Thursday Friday Saturday Sunday
Timing (by weekday)
Pe rce n ta g e o f to ta l vi si ts p e r ca te g o ry 0 % 5 % 10 % 15 % 20 % 25 %
Monday Tuesday Wednesday Thursday Friday Saturday Sunday
Timing (by weekday)
Pe rce n ta g e o f to ta l vi si ts p e r ca te g o ry
Addendum Graph 4. Physician-reported pediatric ED patient acuity and visit type: Non-return visits, RVs and patient-specific visits preceding RVs.
0 % 5 % 10 % 15 % 20 % 25 % 30 % 35 % 40 % 45 % 50 %
0 1 2 3 4 5
Acuity Pe rce n ta g e o f p a ti e n ts 0 % 5 % 10 % 15 % 20 % 25 %
Monday Tuesday Wednesday Thursday Friday Saturday Sunday
Timing (by weekday)
Pe rce n ta g e o f to ta l vi si ts p e r ca te g o ry
all patients RV patients preceding visit
Addendum to Discussion
Primary outcome and variable of interest
Accepting the results of the primary outcome at face value, this study weakens
popularly-held notions regarding ED use among publicly-insured pediatric patients. These results may also
reflect shortcomings of the entire medical system in the US; i.e., regardless of insurance type,
individuals are equally likely to not have appropriate access to non-ED follow-up with a
physician.
The statement presented above regarding inter-institutional differences is especially
important when considering these results. Although RVs as a percentage of total pediatric ED
visits are similar to those seen in both adult and pediatric literature,1 further analyses of the type
of patients seen in pediatric EDs would need to be conducted and compared to the institution
presented in this analysis to assess similarities and differences between patient types at different
Another conclusion, however, is that another variable is a more significant predictor of
72-hour RV than insurance status. Given the lack of research on the topic of 72-hour return rates
among pediatric ED patient populations, the additional variables assessed in this study could
provide a great deal of insight into the question of what factors cause patients to return to the ED
within 72 hours.
Possible explanations for the negative primary variable and outcome relationship
Reasons for the lack of statistically significant differences between these groups can be
classified into three groups: data or statistical concerns, ED system concerns, and patient-related
issues.
There are several data-related or statistical pitfalls that could produce falsely negative
results. Differentially missing data is a common concern for systematic bias in descriptive
studies, however a similar portion of data are missing for both categories in this sample. Also,
each group is only missing 3% of insurance type values for each group; these missing values are
unlikely to constitute a large enough group of individuals to significantly affect the observed
outcome. Small sample sizes can also result in non-representative results; in this case, however,
the large sample size of the study population would tend to increase the likelihood of detecting a
statistically significant difference between the RV and non-RV populations, even where no
clinically significant differences may exist. Another possibility is that data are being excluded
from the database differentially. For example, if certain patient types are more likely to be
admitted to a fast-track ward than to the general or pediatric ED, those patients’ 72-hour RVs
may be excluded from the database entirely.
The actions of ED care providers—classified here as system-related concerns—could
high-acuity patients are more likely to have a certain insurance type, and if these individuals are
more likely to be admitted directly to the hospital instead of first passing through the ED, then
the result would be a flattening of the effect of insurance type on RV status. This study does not
address the issue of ED callbacks; if the ED staff are more likely to call back individuals with
private insurance for follow-up, then the number of RVs in this group would increase relative to
those of the other insurance groups. The issue of access to other treatment locales is also a
concern. If publicly-insured or self-pay patients are more likely to be referred to a less costly
treatment facility instead of being asked to return to the ED, then the number of RVs to the
pediatric ED for these two groups would decline when compared to privately insured patients.
Patient-related issues are a critical element in the current study, and may significantly
affect the outcome of this analysis. If the institution studied attracts a population that, as a whole,
has little access to primary care, then the role of insurance status would be decreased in 72-hour
RV measurements. Another possibility is that patients with a certain insurance type are more
likely to present to the current institution initially, however these individuals may then decide to
switch to another institution within 72 hours of their initial presentation. In this scenario, 72-hour
References
(1) Alessandrini EA, Lavelle JM, Grenfell SM, Jacobstein CR, Shaw KN. Return visits to a pediatric emergency department. Pediatr.Emerg.Care 2004 Mar;20(3):166-171.
(2) Pierce JM, Kellerman AL, Oster C. "Bounces": an analysis of short-term return visits to a public hospital emergency department. Ann.Emerg.Med. 1990 Jul;19(7):752-757.
(3) Depiero AD, Ochsenschlager DW, Chamberlain JM. Analysis of pediatric hospitalizations after emergency department release as a quality improvement tool. Ann.Emerg.Med. 2002 Feb;39(2):159-163.
(4) Hu SC. Analysis of patient revisits to the emergency department. Am.J.Emerg.Med. 1992 Jul;10(4):366-370.
(5) Keith KD, Bocka JJ, Kobernick MS, Krome RL, Ross MA. Emergency department revisits. Ann.Emerg.Med. 1989 Sep;18(9):964-968.
(6) Kelly AM, Chirnside AM, Curry CH. An analysis of unscheduled return visits to an urban emergency department. N.Z.Med.J. 1993 Aug 11;106(961):334-336.
(7) Lerman B, Kobernick MS. Return visits to the emergency department. J.Emerg.Med. 1987 Sep-Oct;5(5):359-362.
(8) Gordon JA, An LC, Hayward RA, Williams BC. Initial emergency department diagnosis and return visits: risk versus perception. Ann.Emerg.Med. 1998 Nov;32(5):569-573.
(9) McCusker J, Healey E, Bellavance F, Connolly B. Predictors of repeat emergency department visits by elders. Acad.Emerg.Med. 1997 Jun;4(6):581-588.
(10) Ly N, McCaig LF. National Hospital Ambulatory Medical Care Survey: 2000 outpatient department summary. Adv.Data 2002 Jun 4;(327)(327):1-27.
(11) Zimmerman DR, McCarten-Gibbs KA, DeNoble DH, Borger C, Fleming J, Hsieh M, et al. Repeat pediatric visits to a general emergency department. Ann.Emerg.Med. 1996
Nov;28(5):467-473.