I. Abstract
Questions about the neutrino’s mass and nature have developed into an important area of
modern physics research. While neutrino oscillations have shown that neutrinos have non-zero mass,
their absolute mass has yet to be determined. Additionally, since they possess no charge, it is possible
that neutrinos are Majorana particles, meaning that they are indistinguishable from their antiparticle.
The MAJORANA DEMONSTRATOR (MJD) aims to probe the neutrino’s absolute mass, and its
Majorana nature by searching for neutrinoless double-beta decay (0υββ). Backgrounds from alpha
particles potentially pose a problem to this experiment. Alpha particles are produced from elements in
the 238-uranium (238U) and 232-thorium (232Th) decay chains, and although alpha particle energies are
typically higher than the 0υββ Q-value, they can lose energy before entering the active mass of the
detector, and deposit energy near the 0υββ Q-value.Initially, the dependence of alpha rates on detector
geometry is explored. Then, two studies conducted on data collected by MJD are presented, one
looking for correlations between observed alpha rates and detectors’ processing history and
manufacturing date, and the other looking for alpha-alpha and beta-alpha coincidence events in the 238U
and 232Th decay chains. No correlation is found between a detector’s processing history and its alpha
rate, but a detector’s age shows a weak negative correlation with alpha rate, suggesting the decay of
plated out radon progeny. Results of the coincidence study do not provide strong evidence of the
presence of 232Th or 238U signatures in MJD data.
II. Introduction A. Neutrinoless Double-Beta Decay
The observation of neutrino oscillations has shown that neutrinos are not massless, but there is
still much we do not know about them. Two of the most important characteristics of neutrinos currently
under investigation are their absolute mass, and whether they are a Majorana fermion. In order to be a
antiparticles with opposite charge, such as the positron. Since neutrinos carry no electric charge, it is
possible that they could be Majorana fermions. If true, this would imply lepton number violation[1], and
could provide possible scenarios to account for the matter-antimatter asymmetry in the universe[2,3}.
The only viable method of determining whether neutrinos are their own antiparticle is the
observation of neutrinoless double-beta (0νββ) decay. In normal beta decay, a nucleon decays, emitting
an electron and a neutrino. Some atoms are energetically forbidden from undergoing single beta decay,
but have been observed to undergo two neutrino beta decay, like 76-germanium (76Ge), which has a
Q-value of 2039 keV. Two neutrino beta decay (2νββ) simply refers to a process in which two beta decays
happen simultaneously in the same nucleus, emitting two electrons and two neutrinos. In 2νββ decay,
the energy of the reaction is shared between the emitted electrons and neutrinos, resulting in a broad
spectrum of electron energies. If the neutrino is indeed its own antiparticle, then 0νββ decay would also
be possible. In this process, two nucleons decay as in 2νββ, but no neutrinos are emitted. This is
because the antineutrino emitted by one nucleon is absorbed by the other nucleon. For 0νββ decay, the
entire decay energy is carried off by the two electrons, leading to a single detectable energy of 2039
keV. Observation of this process would be direct evidence that the neutrino is its own antiparticle.
B. The MAJORANA DEMONSTRATOR
The MAJORANA Collaboration aims to probe the Majorana nature of the neutrino using the
MAJORANA DEMONSTRATOR (MJD). MJD is an array of 44.1 kg of high purity germanium (HPGe)
detectors, located 4850 feet underground at the Sanford Underground Research Facility (SURF). The
goal of this experiment is to demonstrate that a low enough background level can be achieved to justify
building a tonne-scale experiment. The detectors used in MJD are p-type point contact (PPC) detectors,
which have several useful characteristics. The electrical field and corresponding weighting potential in
PPC detectors results in relatively long drift times for holes created throughout the bulk of these
discrimination between the signal shapes of single-site and multi-site events. 0νββ decay is a single-site
event, so the use of PPC detectors enables one to cut out background multi-site events and focus on the
signal of interest. Of the detectors used, 27.9 kg are enriched, meaning that they have been enriched to
88% in 76Ge. The remaining detectors are natural, composed only of natural germanium (7%). In the
DEMONSTRATOR, the HPGe detectors are used as both the source and detector for 0νββ decay.
For 76Ge, the region of interest (ROI) for 0νββ decay is 2039 +/- 2 keV. In order to detect this
decay, which has an estimated half live of greater than 1025 years, the level of background in the 0νββ
ROI must be as low as possible. The goal of MJD is to achieve a background level of 3 counts per
tonne of material per year, in the ROI. MJD implements several measures to reduce background,
focusing on using ultra-clean materials, shielding, and pulse shape analysis cuts of data. The detectors
are assembled into detector units (DU), which are built using electroformed copper and PTFE
components inside a nitrogen purged glovebox. The detector units are then combined into strings
consisting of stacks of 3 – 4 detectors. Seven strings are placed within an electroformed copper
cryostat, named a module, which is then placed inside a shield of low-background copper. MJD
operates two modules. The ultra-clean materials used in MJD have much lower levels of inherent
radiation, specifically of the radioactive elements 232Th and 238U. These two elements are a large source
of background because their decay chains, shown in Appendix 1, contain many radioactive elements
that emit alpha and beta particles, and gamma rays. In particular, gammas from 208-thallium (208Tl) are
a source of background in MJD that must be controlled. They may enter the detector, Compton scatter,
then exit the active mass. This can produce single site events with energy inside the 0νββ ROI, which
would be indistinguishable from a true 0νββ signal.
Outside the copper cryostat and copper shield, there is a shield of low-background lead (Pb).
This protects the detectors from external gammas and x-rays that would obscure the sought after 0νββ
from the lab. Finally, cosmic ray muons are detected using plastic scintillator veto panels outside the
radon enclosure and neutrons are absorbed using a layer of polyethylene. The placement of the
experiment 4850 feet underground also greatly reduces cosmic ray background. Once data are
collected, pulse shape analysis (PSA) and pulse shape simulations (PSS) are used to better understand
and cut out events that are not of interest, such as multi-site events.
C. Alpha Particle Backgrounds
Alpha particles are a source of background in MJD. These particles are produced with energies
ranging from 3.9 to 8.8 MeV. While this is above the 0νββ Q-value, it is possible for alpha particles to
lose energy before entering the detector, then to deposit energy within the ROI in the active region.
This energy loss can occur in the parts surrounding the detector, known as the external bulk, or in the
dead layer of the detector itself.
HPGe detectors have three
types of surfaces, the n+ contact, p+
contact, and the passivated surface.
The n+ and p+ contacts are used for
biasing and signal connection. The
n+ layer is composed of diffused
lithium ions, with a thickness of 0.5-1mm, and the p+ layer is composed of implanted boron ions, with
a thickness of approximately 0.5μm. This layer is inactive, meaning that energy deposited in this layer
is not observed in the detector signal. The n+ layer is too thick for alpha particles to penetrate, so a
detector’s susceptibility to alpha background depends on the surface area of its p+ layer and passivated
surface, both of which are thin enough for alphas to penetrate. For the two types of cylindrical PPC
detectors that MJD uses, the n+ contact covers most of the detector, leaving only a small circular region
surface, which is alpha-susceptible. A side view of MJD detectors is shown in Figure 1. This smaller
alpha-susceptible surface area gives the PPC detectors another advantage over n-type detectors.
Additionally, this small region also limits the directions that alphas originating away from the
detector’s surface can be incident from.
D. 238U and 232Th Decay Chains
Alphas originating from radon (Rn) progenies are especially important to consider because of
the possibility of radon plate out onto surfaces on and around detectors when these materials are
exposed to air containing radon. Two of the most common isotopes of radon are 222Rn, part of the 238U
decay chain, and 220Rn, part of the 232Th decay chain. Both of these isotopes eventually decay into a
stable form of lead (Pb), but along the way they decay into radioactive forms of Pb, polonium (Po), and
bismuth (Bi), transitions that emit alpha particles of various energies. These radon progeny can attach
or implant onto detector surfaces, and become sources of alpha backgrounds[4]. As an example, consider
the decay chain of 222Rn, which eventually arrives at 210Pb. 210Pb decays to 210Bi, then to 210Po, which
emits a 5.3 MeV alpha[4]. The 22 year long half life of 210Pb means that if this isotope was implanted
onto any surface near a detector, it would be a long lived source of alpha background[4, 5]. It is in order
to mitigate these effects that the parts used in MJD are stored in nitrogen purged dryboxes before use,
and detector strings and cryostats are built within nitrogen purged gloveboxes. See Appendix 2 for
related work at UNC.
E. Estimating Potential Surface Alpha Backgrounds
In [6], a charged-ion interaction model was used to characterize the energy loss of alphas
traversing a HPGe detector’s surface and to estimate the potential backgrounds from alpha particles
deposited on the surface of detectors. Using this model, along with a nuclear physics simulation
was determined to be 1.47±0.004(stat)−+0.20 0.10
(sys)×10−5 [6]. The alpha background rate was calculated
using the following formula:
Rα= k
M
∫
S A(⃗r)ϵ(⃗r)Ω(⃗r)dS (1)where M is the mass of the detector in kg, A is the surface alpha activity in Bq/cm2, ε is the previously
determined efficiency, and Ω is the solid angle of the alpha susceptible area with which the area
element dS has direct line of sight, in this case the p+ area. The coefficient
k=3.154×10¹⁰ kg∗s
tonne∗year changes the background rate from counts per kilogram-second into
counts per tonne-year. When only considering surface decays, the formula simplifies to:
Rα=k S
M Aavgϵ (2)
where S is the susceptible surface area, and Aavg is the average surface activity rate. The background
rate on the p+ contact of the natural detectors used in MJD was calculated using a mass of 0.579 kg and
a surface area of 0.2 cm2, resulting in a value of R=1.57 −+0.17
0.16
×105Aavg , where the average activity
depends on the surface alpha activity in the current location. The results of this calculation are shown
for various detectors and exposure activities in Table 1.
Source Background Rate (counts in ROI/t-y)
P-PC (Natural) N-type
Clean room 0.16 70
MJ BG model 0.08 35
Activity (Bq/cm2)
1.0 x 10⁻⁶ 5.0 x 10⁻⁷
Table 1: The estimated surface alpha background count rate for natural P-PC detectors, like those used in MJD, and for typical n-type detectors, calculated in [6]. These rates are based on two assumed alpha surface-activity levels, that of a class-100 clean room used in the Borexino experiment[4], and that of the MJD background
These results indicate that the alpha backgrounds in the ROI for the natural MJD detectors
should be negligible, under these exposure assumptions. However, as will be discussed in Section III,
the enriched MJD detectors have a much larger passivated surface, and this study will be extended.
F. MJD Data Set 1
This investigation into alpha background will focus on MJD’s data set 1 (DS1). Data taking for
DS1 took place from December 31st 2015, to April 14th 2016. This time span is 104 days, but this is not
the value used as the livetime in calculations of rates. Some data were rejected due to high external
radon presence, commissioning tests, or calibration runs. Table 2 shows the breakdown of how data are
classified in DS1.
The livetime used for spectral analysis in DS1 is 54.73 days. Table 3 shows the total active mass
of DS1, along with that of the enriched and natural detectors separately. Event counts are converted
into rates by dividing the number of counts by the active mass and livetime, resulting in rates of
counts/kg/day.
The analysis of DS1 data is done using what are termed skim files. After data are taken in MJD,
the data are processed using the germanium analysis toolkit (GAT), and stored in what are called
gatified files. These are very large files and have many parameters for analysis. Skim files are compact
versions of these files that hold fewer parameters and have much smaller file sizes, but tag events based
on analysis and cuts that have been applied to the raw data. These files are analyzed in ROOT, a C++
framework for analyzing nuclear and particle physics data. Through this framework, skim files can be
Total 104.68 days
Total Acquired 97.52 days
Physics 54.73 days
High Radon 7.32 days
Disruptive Commissioning Tests 28.61 days
Calibration 6.86 days
Down time 7.16 days
Table 2: DS1 run times[7].
Active Mass (Total) 12.43 +/- 0.2 kg
Active Mass (Enriched) 11.31 +/- 0.17 kg
Active Mass (Natural) 1.12 +/- 0.04 kg
analyzed by applying cuts. Cuts use the parameters stored in the data files to eliminate or focus on
certain data.
G. The DCR Cut
In addition to preventative measures to reduce alpha backgrounds, like using ultra-clean
materials and assembly, a method for singling out alpha events in MJD data has been developed. This
method is based on a phenomenon known as delayed charge recovery (DCR) that has been observed in
HPGe PPC detectors. In these detectors, when an event occurs close to the passivated surface, it is
possible for the ionized charge to drift along the detector surface, rather than through the detector bulk,
towards the point contact. Monte Carlo simulations of hole drift in HPGe crystals have shown that
charges move 10 to 100 times slower when drifting along the surface[8]. This slow drifting leads to
identifiable characteristics in the alpha associated signal, leading to a change in the slope of the signal’s
tail. This different slope can be used as a means to cut, or conversely to focus on, only DCR signalsin
MJD data[9]. The range of typical alpha particles in germanium is less than 20μm, so almost all external
detectable alphas will occur on the passivated surface or pass through the surface, making them much
more likely to induce DCR signals than other interactions[10].
In Section III the observed alpha rates in DS1, as determined by the DCR cut will be compared
to expected rates using the model discussed in Section II-E. Then in Section IV an investigation will be
conducted using MJD data and the DCR cut, along with detector records, to look at the dependence of
alpha rates for individual detectors on detector unit components, and whether high alpha rates can be
attributed to a detector’s processing history or age. Finally, in Section V, the presence of coincidence
events in MJD data will be investigated as possible indicators of 238U or 232Th progeny.
III. Estimation of Potential Alpha Rates in PPC Detectors
Building upon the work in [6], the expected surface alpha background rates are calculated for
Using equation (2), and the detector characteristics given in Table 4 along with the previously
calculated efficiency for surface alpha decay to deposit energy in the 0νββ ROI, the surface alpha
background rates were calculated to be R=2.896±0.009×10⁶A
avg counts/tonne/year for natural
PPC detectors, and R=1.305±0.027×10⁷Aavg counts/tonne/year for enriched PPC detectors. Using
those activity dependent formulas, the background rates for each type of detector at two different
surface alpha activity levels were calculated, and are shown in Table 5.
The surface alpha background rate calculated using the combined surface area of the passivated
and p+ surface is 18.1 times larger than the background rate calculated in [6] for the same surface alpha
activity. This difference is due to the fact that the combined passivated surface and p+ surface of the
natural PPC detectors is approximately 18 times larger than the p+ surface alone. Enriched detectors
were not considered in [6], so there is no value to compare the 6.525 counts/t-y to. Both of these
background rates are much lower than 35 counts/t-y alpha background of typical n-type detectors, but
they are still significant considering the MJD background goal of 3 counts/tonne/year in the 0νββ ROI.
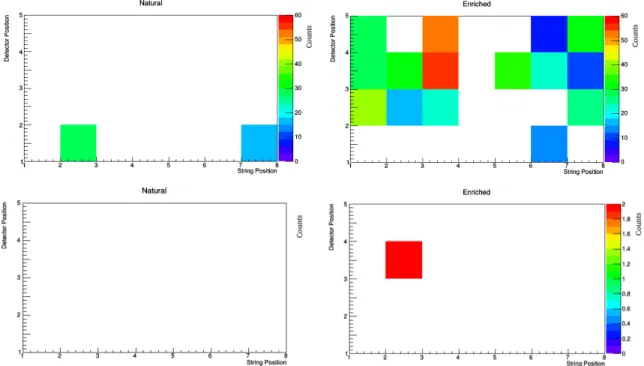
Plots of DCR events per detector were produced using data from MJD’s DS1. These are
displayed in Figure 2. Using DS1 data and the DCR cut, the actual alpha rates for MJD detectors were
Detector Mass (kg)
Natural PPC 0.621 3.897
Enriched PPC 0.847 23.85
Surface Area (cm2)
Total (Passivated + p+)
Table 4: The average mass and combined passivated and p+ surface area for the natural and enriched detectors used in MJD.
Source Background Rate (counts in ROI/t-y)
Natural Enriched
Clean room 2.896 13.05
MJ BG model 1.448 6.525
Activity (Bq/cm2)
1.0 x 10⁻⁶
5.0 x 10⁻⁷
calculated. Table 6 compares the observed alpha rates in DS1 to the calculated surface alpha
background rates in the 4 keV 0νββ ROI.
There were no DCR events within the 0νββ ROI detected by natural detectors in DS1, and only
2 detected by enriched detectors. These values were converted into the units counts/kg/day by dividing
the number of events detected by the livetime of DS1, 54.73 days, and their corresponding active
masses, in Table 3. The rates listed in Table 5 were converted from counts/tonne/year into
counts/kg/day by dividing the rate by the constant k, then multiplying that value by 86400, the number
of seconds in a day. Comparing the values predicted by the surface alpha model and the observed
Detector Surface alpha background rate (counts/kg/day) Observed DS1 Alpha Rate (counts/kg/day)
Natural 0
Enriched
3.967 x 10⁻⁶
1.787 x 10⁻⁵ 3.231 x 10⁻³
Table 6: This table compares the surface alpha background rates in the 0νββ ROI to the observed alpha rates in MJD's DS1.
values, the observed rate in natural detectors is lower, as it is 0. This is to be expected, as there are only
2 active natural detectors in DS1, and the probability of them detecting a DCR event within a 4 keV
ROI is small within the 54.73 day livetime. The enriched detectors found 2 DCR events within the
ROI, resulting in a rate of 3.231∗10−3 counts/kg/day, two orders of magnitude higher than the
predicted 1.787∗10−5 counts/kg/day. Because the substantial energy degradation of alphas
originating on the passivated surface was not assumed in [6], it is not useful to directly compare the
values determined there and those calculated here. The MAJORANA background model predicts a
contribution of 1.370 * 10-7 counts/kg/day in the ROI from surface alphas[11], four orders of magnitude
lower than the observed alpha rate in DS1. The DCR cut is very efficient, and in this study, the DCR
cut was used to single out alpha events. Use of the cut in the opposite way, to cut out only DCR events,
allows MJD to eliminate the higher than expected background from alpha events.
IV. Investigation of Individual Detector Rates A. Hot Detectors
Currently, MJD has collected five sets of data, DS0 through DS4. Using this data, the rate of
DCR (alpha) events for each detector in each data set was calculated[12]. In looking at the distribution of
rates across all the detectors, shown in Figure 3, detectors with alpha rates greater than 0.2 counts/day
were designated “hot” detectors. It was found that of the detectors classified as hot, almost all of them
were consistently hot in each data set that they operated in[12]. This suggests that there is something
unique about these detectors, how they were handled during fabrication, or the materials surrounding
them, that is producing a relatively high number of events that are tagged by the DCR cut. The intent is
to test the hypothesis that there may be a correlation between the processing history of these hot
For the two types of cylindrical PPC
detectors that MJD uses, the n+ contact covers
most of the detector, leaving only a small
circular region of p+ where the point contact is
made, and the bottom of the detector where
there is a passivated surface, which is
alpha-susceptible. This helped narrow the choice of
materials to investigate for correlations between
alpha rates and hardware processing. Along
with the detector crystals themselves, the pieces of
hardware that are investigated here include the contact
pins, center bushings, crystal mounting plates, and crystal
insulators, all of which, because of their location within
the detector unit, have line of sight to the alpha
susceptible surface. An MJD detector unit is displayed in
Figure 4.
B. Methods
A spreadsheet was created listing each detector and its corresponding alpha rate by data set,
along with an average alpha rate across all data sets. Then, columns were created corresponding to each
of the pieces of hardware of interest and the detector crystals. In this investigation, the primary focus
was on the amount of time that these pieces of hardware were stored, between various stages in their
manufacture, and the assembly of their corresponding detector unit. Time is a useful variable to
consider because it can shed light on the presence of radon or its progeny at different stages of detector
unit processing, by comparing these elements’ half-lives to patterns seen in alpha rates. Any
Figure 3[12]: The distribution of alpha rates of MJD detectors.
Number of channels is equivalent to number of detectors. Detectors with rates above 0.2 counts/day are designated as hot.
correlations found among these variables could suggest that alpha emitting isotopes were present in the
location of their storage or manufacture. The variables being tested for each piece of hardware are
listed below. In addition to these variables, the date of crystal manufacture is investigated, along with
the amount of time the detector spent between its removal from the manufacturer’s cryostat
(de-cryostating) and its assembly into a detector unit.
Contact Pin: Days between tin dipping and DU build (Stored in dry box). Center Bushing: Days between leaching and DU build (Stored in dry box). Crystal Mounting Plate: Days between etching and DU build (Stored in dry box). Crystal Insulators: Days from outgassing to DU build (Stored in dry box).
De-cryostat Date: Days between detector de-cryostating and DU build (Varying storage). Total Age: Days between the detectors manufacture and DU build (Varying storage).
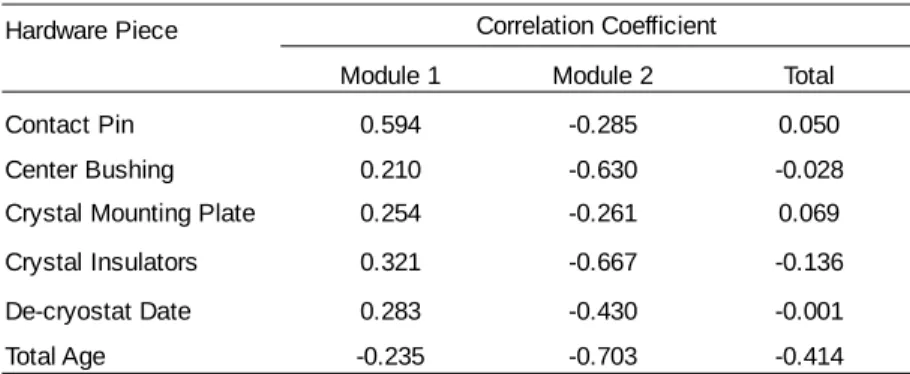
The correlation coefficient (R) between each detectors values for these variables and each detector’s
average alpha rate was calculated, and alpha rate was plotted over each of these variables. Results are
shown in Table 7 with plots for contact pins in Figure 5, center bushings in Figure 6, crystal mounting
plates in Figure 7, crystal insulators in Figure 8, detector de-cryostating in Figures 9 and 10, and
detector total age in Figures 11 and 12.
Hardware Piece Correlation Coefficient
Module 1 Module 2 Total
Contact Pin 0.594 -0.285 0.050
Center Bushing 0.210 -0.630 -0.028
Crystal Mounting Plate 0.254 -0.261 0.069
Crystal Insulators 0.321 -0.667 -0.136
De-cryostat Date 0.283 -0.430 -0.001
Total Age -0.235 -0.703 -0.414
Figure 5: Contact Pin. This figure shows the plots of alpha rate over amount of time that a contact pin spent between its tin dipping and the day its detector unit was assembled. The left plot represents the contact pins from detectors in module 1, and the right represents the contact pins from detectors in module 2.
Figure 6: Center Bushing. This figure shows the plots of alpha rate over amount of time that a center bushing piece spent between its leaching and the day its detector unit was assembled. The left plot represents the center bushings from detectors in module 1, and the right represents the center bushings from detectors in module 2.
Figure 9: Detector De-cryostat. This figure shows the plots of alpha rate over amount of time that a detector spent between its de-cryostating and the day its detector unit was assembled, for natural detectors. The left plot represents the detectors in module 1, and the right represents the detectors in module 2.
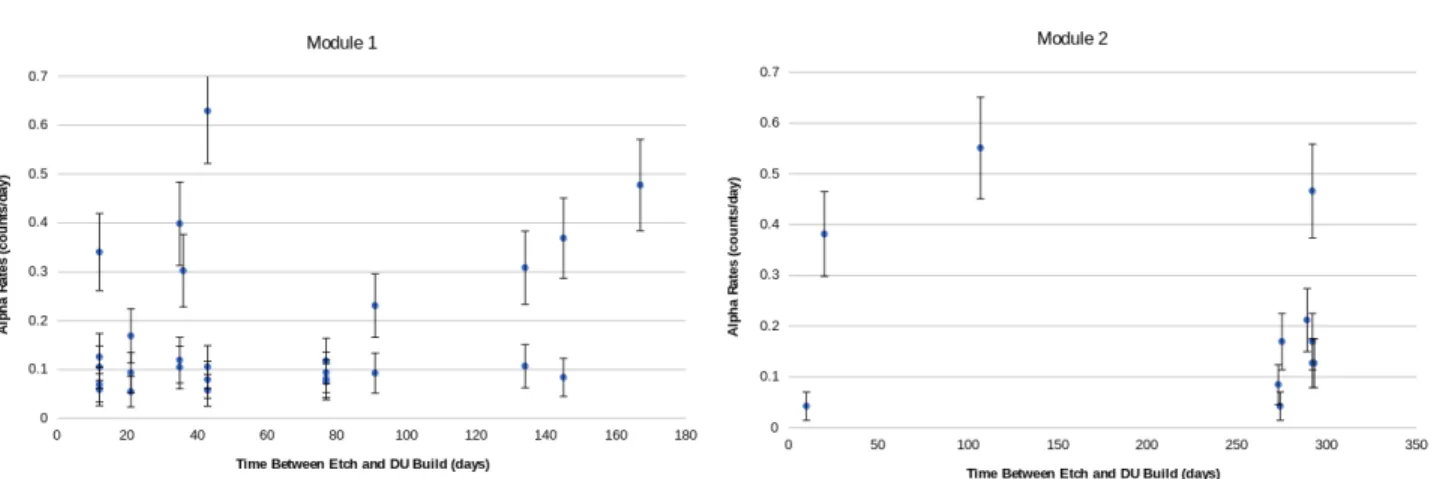
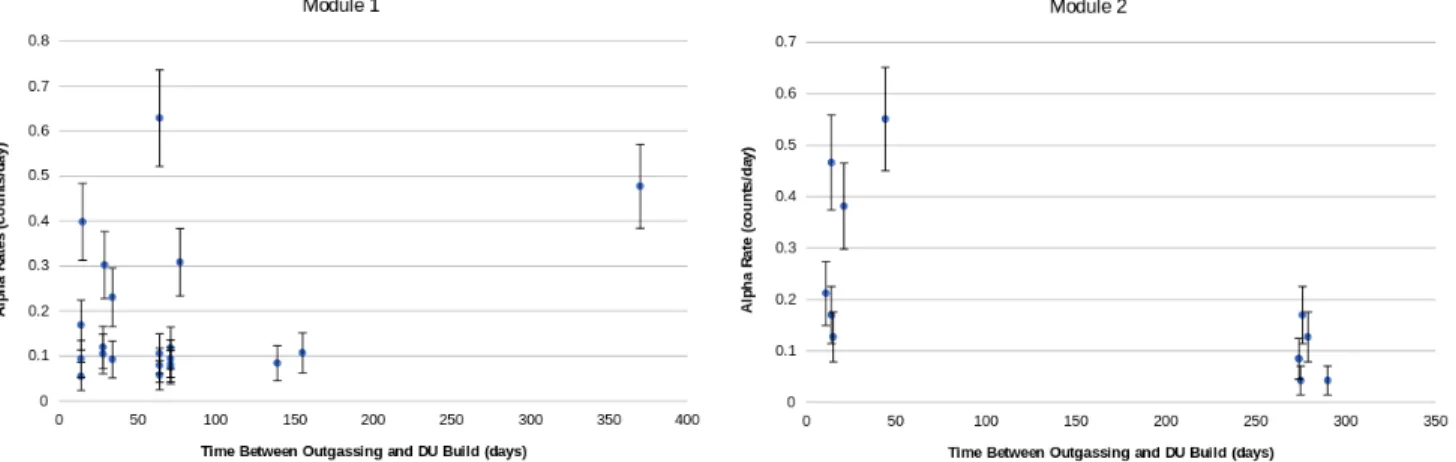
Figure 8: Crystal Insulator. This figure shows the plots of alpha rate over amount of time that a crystal insulator spent between its etch and the day its detector unit was assembled. The left plot represents the crystal insulators from detectors in module 1, and the right represents the crystal insulators from detectors in module 2.
C. Results
The correlation coefficient R measures the strength of the linear relationship between the two
variables used in its calculation[13]. If any of the variables investigated here had any influence on
detected alpha rate, one would expect an R value close to either 1 or -1, indicating that the longer a
piece was stored between a certain processing event and detector unit build, the higher alpha rate
observed in that detector, or an inverse relationship, respectively. In the R values calculated by module
in Table 7, there are a few values that stand out, namely the contact pins in module 1, the center
bushings in module 2, the crystal insulators in module 2, and the total age of detectors in module 2.
Alone, these would merit a further look into possible radon or radon decay products in proximity to Figure 11: This figure shows the alpha rates for natural detectors in MJD plotted against that detector's total age, the time period between its manufacture and its detector unit assembly.
these hardware pieces. Positive correlations would indicate radon or its decay products near the part’s
storage location, as its alpha rate increases the longer it was there. A negative correlation would
indicate radon or its decay products in the location that the processing occurred, for example where the
outgassing of module 2 crystal insulators occurred. After this processing occurred, the longer the piece
was stored, the longer the alpha emitters that plated out on the piece would have to decay away, so that
there is less alpha emitting material on the piece during MJD operation. If either of these situations
were the case, the correlation in each module should be similar, under the assumption that the hardware
used in each module was exposed to the same conditions during processing and storage. Table 7 shows
that this is not the case. For each variable investigated, except the detectors total age, the sign of the R
value is different in module 1 than it is in module 2, and for each one, the R value in module 1 is
positive and in module 2 is negative. Considering all detectors, module 1 and module 2 combined, no
variable exhibited even a slight linear correlation of either sign, except detector’s total age, with R =
-0.414.
A table listing each detector used in this investigation along with their total ages is available in
Appendix 3. Considering the detector’s total age, both module 1 and module 2 detectors showed a
negative correlation between that detector’s observed alpha rate and the time between its manufacture
and its use. The total R value for detectors in both modules shows a weak negative correlation, meaning
the longer a detector spent between its manufacture and its assembly into a detector unit, the lower the
alpha rate it measured in operation. Of the two types of detectors used, the natural detectors were all
manufactured over a period of 909 days from the years 2009 to 2011, whereas the enriched detectors
were manufactured over a period of 843 days over the years 2012 to 2015. The R values for the natural
and enriched detectors separately were calculated and are shown in Table 8.
Table 8: The correlation coefficients between total detector age and observed alpha rates,
Correlation Coefficient Module 1 Module 2 Total
Natural 0.127 0.838 0.244
For the natural detectors, module 1 has a very weak positive correlation, while module 2 has a
strong positive correlation, which could indicate that the natural detectors used in module 2 may have
been exposed to radon decay products during storage. The enriched detectors in module 1 show no
correlation, but in module 2 they show a strong negative correlation, which could indicate that alpha
emitting isotopes plated out onto these detectors decayed away during storage. The correlation
coefficients for both natural and enriched detectors in both modules show very weak linear correlations,
in opposing directions. When considering all detectors together, they exhibit a slightly stronger
negative correlation, -0.414, between age and alpha rate. If there was a source of alpha emitting
material that implanted onto the detectors at their manufacture location, the stronger negative
correlation when considering both enriched and natural detectors together may be due to the decay of
this material over the large time period between the dates of their manufacture. Table 9 lists the
standard deviation between detector ages for both natural and enriched, both on the scale of 200 days.
On the other hand, the difference between the average manufacture date of the natural and enriched
detectors is 1400 days. Looking at the decay chains for 222Rn and 220Rn, every alpha decay has a
half-life of 4 days or less, except 210Po and 210Pb, a long lived source of 210Po. In the 222Rn decay chain, 210Po
alpha decays into 206Pb with a half-life of 140 days. The standard deviation in age of both types of
detectors is slightly less than two 210Po half-lives . Assuming an initial mass M of 210Po plated out on
the detector, after two half-lives, the mass of 210Po left would be approximately M
4 . On the other
Natural Enriched
Standard Deviation in Age (days) 250.0 205.3
Average Manufacture Date 01/04/10 11/04/13
hand, the difference in the average dates of manufacture of natural and enriched detectors is 1400 days,
or ten 210Po half-lives. This time period corresponds to a decrease in 210Po mass from M to M
1024 . If
detectors were exposed to radon during the manufacturing process and 210Po plated out onto the
detectors’ surfaces, most of the 210Po would have decayed from the natural detectors by the time the
enriched detectors were being manufactured, resulting in lower alpha rates for those detectors during
operation, and the observed negative correlation when looking at all detectors together. However, that
explanation assumes that all detectors were exposed to the same conditions during manufacture.
Enriched and natural detectors were manufactured by different companies at different locations,
making it unlikely that they were exposed to the same levels of radon and its products during
manufacture. Additionally, if any 210Pb were implanted onto the detectors, more 210Po would continually
be produced while the original mass was decaying.
The relatively weak R values shown by the hardware pieces investigated, along with the change
in sign of the R value from module 1 to module 2, indicates no clear correlations. The total age of the
detectors, defined as the time between its manufacture and its assembly into a detector unit, showed a
slight negative correlation between age and alpha rate. This could be explained by the introduction of
an alpha emitting material during manufacture, which decays over time before the detector is placed
into the detector unit, as discussed above with 210Po. Confirmation of this hypothesis would require
measurements over a longer time period, as well as a direct comparison between detectors known to
have been exposed to radon and its decay products and those used in MJD. Finally, analysis of DCR
data could be done using fits other than a linear correlation, such as an exponential fit. In the case of an
alpha emitter decaying, its mass decreases exponentially with time, so an exponential fit of the data
V. Coincidence Events A. Coincidence Events
A method of identifying the presence of, and distinguishing between, 238U and 232Th is the
presence of coincidence events. A coincidence event is a decay that is followed almost immediately by
another decay. These events occur when after one decay, the product of that decay decays again with a
very short half life. These events are seen in both 238U and 232Th chains, in both cases in the decay of Bi
to Pb, an example of a beta-alpha coincidence. In the 238U chain, 214Bi beta decays to 214Po, which then
alpha decays to 210Pb with a half life of 164μs. In the 232Th chain, 212Bi decays to 212Po, which in turn
alpha decays to 208Pb with a half life of 0.3μs[14]. In these cases, one would expect to see a beta event,
followed by an alpha event only microseconds later. The presence of these beta-alpha coincidences in
MJD data could indicate the presence of 238U or 232Th at some time during the MJD production process,
and the difference in half life between each can be used to distinguish between them.
B. Methods
In order to search MJD data for beta-alpha coincidences, an iterator in ROOT was used to
iterate over every event in MJD’s DS1, and a data structure was created to store information about each
event as the iteration occurred. This data structure, EventBuffer, stores information about the fifty most
recent events, specifically their date, time, energy, the run that they occurred on, and the detector that
detected them. Using the ROOT iterator along with the EventBuffer data structure, a script was created
to identify coincidence events. For each event in DS1 within a specified energy range, this script
checks whether that event is a DCR event, and then looks through all the prior events stored in the
EventBuffer for coincidence events.
The way that the script determined whether to count an event as a coincidence was by
occurred at a short enough time before the alpha to be considered a coincidence. In this case, the time
requirement was a difference in time between the alpha and earlier event of 36 ms. This time was
chosen because it encompasses many half-lives of the beta-alpha coincidence elements of interest, 214Po
from the 238U chain, and 212Po from the 232Th chain, but still maintains a small window in which to
search for only coincidence events.
C. Results
The statistics found from the coincidence scripts are shown in Table 10. Figure 13 shows the
distribution of time spans between the original alpha event and the coincidence event that preceded it.
Figure 14 shows a plot of the energy spectrum of coincidence events compared to all DCR events, and
all DS1 events.
Figure 14: This plot displays the energy spectrums of all DS1 events, DCR events in DS1, and the DCR-associated coincidence events found in DS1.
Figure 13: This displays the distribution of time spans between coincidence events and their corresponding DCR event.
Table 10: Listed here are the number of total, DCR, and coincidence events in MJD's DS1 in the energy range 400 to 6000 keV.
Total Events in DS1 5761
Total DCR Events in DS1 916
Total Events With a Coincidence 50
DCR Events With a Coincidence 7
Table 10 reveals that in the energy range 400 to 6000 keV, DCR events make up 15.9% of all
events detected in DS1. Of those DCR events, only 7 were found to have at least one coincidence
event, an event prior to them that occurred within the 36 ms time restriction. DCR events with a
coincidence make up 14% of all the events found in DS1 to have at least one coincidence. There were
11 coincidence events in total that were associated with a DCR event, meaning that some of the 7 DCR
events had multiple events prior to them within the time restriction. In the case when a DCR event has
multiple coincidences, only one of those prior events could possibly be due to an actual beta-alpha or
alpha-alpha coincidence event. Figure 14 reveals that a majority of the DCR events in DS1 are located
at lower energies, with a drop off at 3000 keV. This is similar for coincidence events, they are all
present at energies under 3000 keV. This is important because the 4 keV 0νββ ROI is located in the
region 2037 to 2041 keV, where DCR events make up a majority of the events detected, and above the
region of 2νββ events, which make up a majority of the DS1 events under 1500 keV.
More than half of the coincidence events occur under 1000 keV, in the approximately 200 keV
region from 600 keV to 800 keV. This cluster of coincidence events around that energy region could be
a indicator of 232Th. This is because in the beta-alpha decay scheme laid out above for 232Th, 212Bi beta
decays to 212Po, which then alpha decays to 208Pb soon after. The Q-value of the beta decay in that case
is 2252 keV, but since the average detected energy of beta particles is one third of their Q-value[15], one
would expect to detect a value around 750 keV for that decay, on average. In Figure 13, the time
between each detected coincidence event and its associated DCR event are plotted. The distribution of
times is fairly regular, with a slight majority under 18 ms. This plot does not provide any evidence
towards the possibility of 232Th being the source of the coincidences, as 212Po’s half-life is 0.3 μs. If
those coincidences were all from 232Th, their time distribution would be concentrated near zero on that
plot. Further evidence against the hypothesis that these coincidences are due to 212Po is a comparison of
coincidences is 7
916=0.008 coincidences per DCR event, and the rate of non-DCR coincidences is
43
4845=0.009 coincidences per non-DCR event. These rates are very close, which suggests that the
DCR coincidence events are not due to 212Po, but are simply accidental coincidences, independent
events that both happen to occur within the time restriction. If the DCR coincidences were due to 212Po,
one would expect the rate of DCR coincidences to be higher than that of non-DCR coincidences.
This study would benefit from expansion to data sets beyond DS1. Inclusion of all 5 currently
available data sets would shed more light on the characteristics of DCR events and coincidences events,
simply by greatly increasing the sample size. This would provide statistics more representative of MJD
data as a whole.
VI. Conclusion
In this investigation into alpha background in MJD, three main areas were analyzed. The first
was the dependence of observed alpha rate on alpha susceptible surface area, which was analyzed by
comparing natural and enriched detectors. Both the calculation and the observed results confirm that a
greater alpha susceptible surface area leads to higher alpha rates, although the observed rates are much
higher than the calculated rates. This is most likely due to the fact that the degree of energy degradation
on the passivated surface that is seen in MJD was not taken into account in the calculations. Next, an
investigation into the possible causes for high alpha rates in some MJD detectors was conducted by
looking for correlations between the amount of time that certain hardware had been stored and the
alpha rates of the detectors they’re associated with. No strong correlation was found for any pieces of
hardware, although a slightly negative correlation between the total age of the detector and its alpha
rate was found. This may support the hypothesis that radon decay products plated out on detector
investigated, and the possibility of 232Th or 238Usignatures in the energy spectrum of coincidence events
was explored. The cluster of coincidence events around 750 keV, the expected average beta particle
energy for 212Bi, may indicate the presence of 232Th, although the distribution of time spans for the
coincidence events, and a comparison of DCR and non-DCR coincidence rates, did not provide
information to support this.
VII. Acknowledgments
I would like to thank John Wilkerson for his support throughout this project, and for providing
both guidance and independence when necessary. Also, I would like to thank Matthew Busch for his
assistance in the lab, and guidance in designing the LN purge system. Thanks to Jamin Rager, Tom
Gilliss, and Anna Reine for answering my questions, and the entire UNC ENAP group for making my
VIII. Appendices Appendix 1
Appendix 2
On site at SURF, after the electroformed copper pieces to be used in construction of MJD are
machined, they are stored in nitrogen purged dryboxes. Additionally, all assembly of components used
in MJD occurs in nitrogen purged gloveboxes. When assembly takes place, one of these gloveboxes
can achieve a particle count on the scale of 10 particles per cubic foot, for 0.3μm particles. The use of
nitrogen as a purge gas is essential to creating a low radon environment. Nitrogen is also inert, so it will
not react with anything within the chambers. Purging these chambers with nitrogen displaces dust,
water, air, and any other undesirable materials, such as radon, that would normally be present.
In the purge system in use at SURF, the purge gas used is boiloff from liquid nitrogen (LN)
dewars. It is beneficial to use a liquid nitrogen source because the difference in boiling point between
nitrogen and radon guarantee a nitrogen source that is radon free. Nitrogen’s boiling point is 77.36 K,
Element Type of Decay Half-life
Uranium 238 Alpha
Thorium 234 Beta 24.5 days
Protactinum 234 Beta 1.14 minutes
Uranium 234 Alpha
Thorium 230 Alpha
Radium 226 Alpha 1590 years
Radon 222 Alpha 3.825 days
Polonium 218 Alpha 3.05 minutes
Lead 214 Beta 26.8 minutes
Bismuth 214 Beta 19.7 minutes
Polonium 214 Alpha
Lead 210 Beta 22 years
Bismuth 210 Beta 5 days
Polonium 210 Alpha 140 days
Lead 206 Stable
4.5 x 10⁹ years
2.33 x 10⁵ years 8.3 x 10⁴ years
1.5 x 10⁻⁴ seconds
Table 11: The decay series of 238-uranium.
Element Type of Decay Half-life
Thorium 232 Alpha
Radium 228 Beta 5.75 years
Actinium 228 Beta 6.13 hours
Thorium 228 Alpha 1.91 years
Radium 224 Alpha 3.66 days
Radon 220 Alpha 55.6 seconds
Polonium 216 Alpha 0.15 seconds
Lead 212 Beta 10.64 hours
Bismuth 212 Alpha (36%) 60.6 minutes
Beta (64%)
Polonium 212 Alpha
Thallium 208 Beta 3.07 minutes
Lead 208 Stable
14.1 x 10⁹ years
0.305 x 10⁻⁶ seconds
whereas radon’s is 211.35 K. While the liquid nitrogen boils off and is directed to the dryboxes and
gloveboxes, any radon remains in the dewar in liquid form.
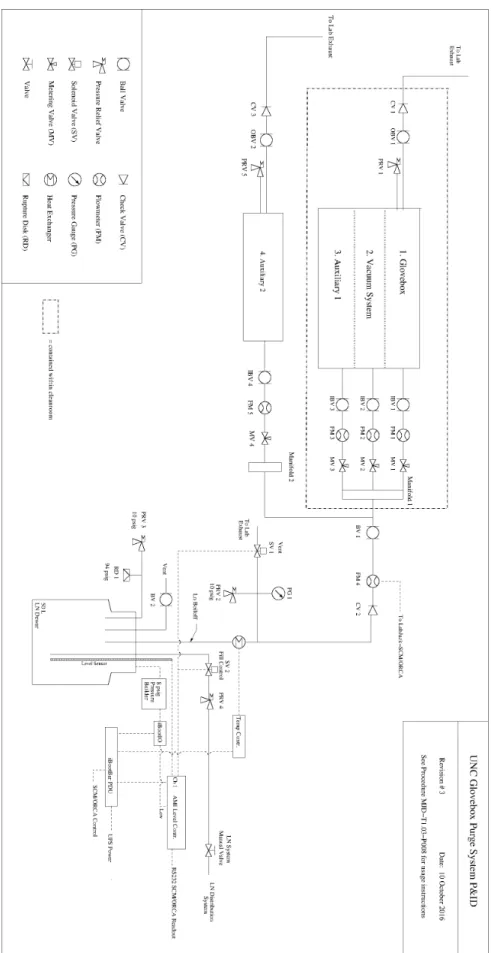
The liquid nitrogen purge system implemented at SURF supplies several chambers with purge
gas, and is sourced from a set of two 180 liter LN dewars. The level of LN in each dewar is monitored,
and a system is in place which automatically switches which dewar is used as the supply depending on
how much LN each contains. It is desirable to implement a simpler, smaller scale LN purge system at
the University of North Carolina at Chapel Hill (UNC), where current upgrades of cables and
connectors for the MAJORANA DEMONSTRATOR is underway, so that components can be assembled
under conditions similar to those at SURF. Using the schematic and parts list for the LN purge system
at SURF as a reference, a purge system for use at UNC was designed. This system uses one 180 liter
dewar of LN as its source. From this dewar, LN flows into a customized 50 liter dewar, which has been
modified to allow for its use with a level probe and vacuum jacketed vapor withdrawal line. The flow
from the source dewar into the customized dewar is controlled by an AMI Level Controller. This device
tracks the level of LN in the 50L dewar, and opens or closes the line between this dewar and the source
when certain setpoints are reached. The level controller also operates a pressure builder, which is
activated when pressure within the 50L dewar is too low. From the 50L dewar, LN boiloff is routed
through a heat exchanger, which brings it closer to room temperature, and is then sent to the chambers
which it is purging. Flow into each chamber is controlled by flowmeters placed right before the inlet
into each chamber. After flowing through the chamber, the purge gas is vented through the lab exhaust.
A schematic for this purge system was produced using the xfig drawing program, and is shown below
in Figure 15.
This design is a simplification on that used at SURF in the following ways. Only one source
dewar is used, so there is no switching system in place to alternate the source between multiple dewars.
dewar and 50L dewar. At SURF, the 180L dewars supply LN for multiple purposes, so the level
controller controls multiple valves, and has two responses for a HIGH level reading in the 50L dewar.
At the lower HIGH setpoint, the level controller closes a valve that only blocks the 50L dewar. At the
higher, emergency HIGH setpoint, the level controller shuts off the LN source completely. Finally, the
system planned for use at UNC is designed only to purge up to three chambers, whereas the system at
SURF can purge up to nine chambers.
After completion of the design and schematic, a bill of materials was created, and a failure
modes analysis review meeting was held. In this meeting, all conceivable modes of failure for the UNC
purge system were discussed and given a rating based on their likelihood and severity. Parts for
Appendix 3
Detector Serial Number Total Age (Days) Detector Serial Number Total Age (Days)
B8474 1794 P42662C 321
B8480 1937 P42698A 405
B8455 1817 P42538B 1047
B8470 1750 P42573A 695
B8463 1770 P42575B 599
B8465 1757 P42661A 446
B8469 1750 P42573B 652
B8477 1916 P42574C 587
B8482 1821 P42661B 398
B8487 1524 P42574A 597
B8459 2104 P42662A 398
B8481 2336 P42574B 573
B8576 2008 P42662B 378
B8594 1986 P42537A 650
B8595 2003 P42665B 686
B8461 2422 P42664B 484
B8607 1971 P42748B 425
B8456 2433 P42748A 426
B8621 1960 P42749A 695
B8466 2376 P42749B 694
B8473 2363 P42853A 385
B8487 1932 P42853B 204
B8619 1972 P42712A 570
B8717 1607 P23517A 907
P42698B 249 P42909B 249
P42575A 534 P42909C 249
P42661C 336 P42665C 879
P42538A 600 P42712B 789
P42664A 321 P42909A 246
P42665A 294
IX. References
[1] J. Schechter and J. W. F. Valle, “Neutrinoless double-β decay in SU(2)×U(1) theories,” Physical
Review D, vol. 25, no. 11, pp. 2951–2954, 1982
[2] M. Fukugita and T. Yanagida, “Barygenesis without grand unification,” Physics Letters B, vol. 174,
no. 1, pp. 45–47, 1986.
[3] P. Di Bari, “An introduction to leptogenesis and neutrino properties,” Contemporary Physics, vol.
53, no. 4, pp. 315–338, 2012.
[4] M. Leung, The Borexino Solar Neutrino Experiment: Scintillator Purification and Surface
Contamination, Ph.D. Thesis, Princeton, 2006.
[5] L.C. Stonehill, Deployment and Background Characterization of the Sudbury Neutrino Observatory
Neutral Current Detectors, Ph.D. Thesis, University of Washington, 2005.
[6] R. A. Johnson, et al., Nucl. Instr. and Meth. in Phys. Research A 639, (2012) 51-58.
[7] C. Cuesta, Run selection and data cleaning of DS1 (P3KJR), (2016).
[8] P. Mullowney, et al., Nuclear Instruments and Methods in Physics Research A 662 (2012) 33–44.
[9] J. Gruszko, (2016), Delayed Charge Recovery Discrimination of passivated surface alpha events in
P-type point-contact detectors, University of Washington, Seattle, WA.
[10] Berger, M J, et al. 2005 ASTAR [Online] Available: http://physics.nist.gov/Star.
[11] C. Cuesta, et al., Background Model for the MAJORANA DEMONSTRATOR, (2016)
arXiv:1610.01146.
[12] J. Gruszko, Alpha Rate K-S Tests & Rates by Detector, MAJORANA COLLABORATION, (2017).
[13] Correlation Coefficient, MathBits, [Accessed Apr 1 2017],
https://mathbits.com/MathBits/TISection/Statistics2/correlation.htm
[14] R. B. Galloway, Uranium and thorium series determination in natural samples by a beta-alpha
[15] Radiation Safety Manual Radioisotopes, Environmental Health and Safety, [Mar 29 2017],
![Figure 3 [12] : The distribution of alpha rates of MJD detectors.](https://thumb-us.123doks.com/thumbv2/123dok_us/8333608.2211498/13.918.445.821.102.384/figure-distribution-alpha-rates-mjd-detectors.webp)