1
The Role of Fatty Acid Transport in Breast Cancer Growth, Progression, and Metastasis
By Jobin Chandi
Senior Honors Thesis Department of Nutrition
University of North Carolina at Chapel Hill April 20, 2020
Approved: ______________________ Stephen D. Hursting, PhD, MPH (Advisor)
2
Acknowledgements
I would like to thank Dr. Hursting and the members of the Hursting Lab for their countless support and counsel over the past two years. I would like to also acknowledge and thank Shannon McDonell for his continued guidance in teaching me all the aspects of researching techniques that I have come to learn. I would also like to thank Dr. Michael Coleman and Lydia Eisenbeis for their help and feedback in helping me write and complete my Honors Thesis. Lastly, a special thanks to our lab manager Erika Rezeli for helping maintain the lab and ordering reagents and supplies from Tissue Culture Facility in UNC Lineberger Comprehensive Cancer Center as well third party vendors listed in this thesis that were needed to complete my experiments.
3
Abstract
4
Table of Contents
1. Introduction
a. Breast Cancer Prevalence and Mortality
b. Fatty Acid Signaling and Obesity in Breast Cancer c. Leptin Signaling and Obesity in Breast Cancer d. Leptin and Fatty Acid Transport in Breast Cancer
e. FATP1 and Breast Cancer Metastasis
2. Goal and Hypotheses
3. Methods
4. Results
5. Discussion
6. Conclusion
5
Introduction
Breast Cancer Prevalence and Mortality
As the second leading cause of death worldwide and with incidence and mortality rising rapidly, cancer is one of the largest global public health concerns (1). Breast cancer is the most commonly diagnosed cancer among women and the second leading cause of cancer mortality in women (1). Breast cancer that has disseminated beyond the primary site of growth, a process known as metastasis, is largely responsible for the high rates of breast cancer mortality in women, as stage IV metastatic breast cancer has a 5-year survival rate of only 27% (2). Metastatic cancers in particular are largely responsible for global cancer mortality, as 90% of all cancer mortality occurs only after metastasis (3). There are several hypotheses to explain, in part, the metastatic process, such as cancer stem cells, metabolic reprogramming, or the epithelial to mesenchymal transition of cells, however, there is still significant uncertainty in the characterization of the drivers of metastatic disease (3). And while several therapeutic approaches such as chemotherapy, radiation, and endocrine therapy have reduced mortality rates over the past few decades, the wide range of breast cancer phenotypes has limited the effectiveness of these therapeutic strategies. Fatty Acid Signaling and Obesity in Cancer
6
breast cancer metastasis remain unclear, one potential candidate is fatty acid signaling and metabolism.
7
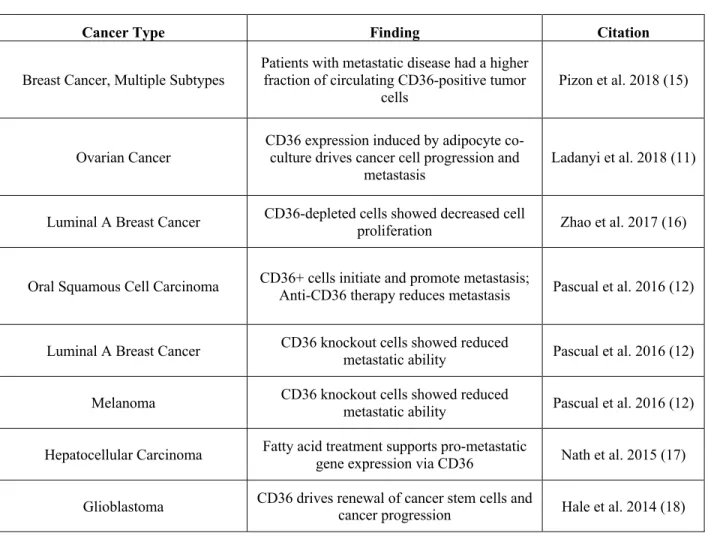
Table 1: Impact of Varying CD36 Expression on Multiple Cancer Types
Cancer Type Finding Citation
Breast Cancer, Multiple Subtypes Patients with metastatic disease had a higher fraction of circulating CD36-positive tumor cells
Pizon et al. 2018 (15)
Ovarian Cancer
CD36 expression induced by adipocyte co-culture drives cancer cell progression and
metastasis Ladanyi et al. 2018 (11)
Luminal A Breast Cancer CD36-depleted cells showed decreased cell proliferation Zhao et al. 2017 (16)
Oral Squamous Cell Carcinoma CD36+ cells initiate and promote metastasis; Anti-CD36 therapy reduces metastasis Pascual et al. 2016 (12)
Luminal A Breast Cancer CD36 knockout cells showed reduced metastatic ability Pascual et al. 2016 (12)
Melanoma CD36 knockout cells showed reduced metastatic ability Pascual et al. 2016 (12)
Hepatocellular Carcinoma Fatty acid treatment supports pro-metastatic gene expression via CD36 Nath et al. 2015 (17)
Glioblastoma CD36 drives renewal of cancer stem cells and cancer progression Hale et al. 2014 (18)
Leptin Signaling, Obesity, and Cancer
8
has been shown to induce epithelial-to-mesenchymal transition (EMT) via the ERK signaling pathway, demonstrating another potential mechanism through which leptin may act to increase metastatic potential among various cancer types (22). Despite substantial evidence of leptin’s role in activating various oncogenic pathways including angiogenesis, proliferation, and epithelial-mesenchymal transition, current research is still limited in describing leptin’s role in the obesity-cancer link (23).
Leptin and Fatty Acid Metabolism
9
Figure 1: Proposed mechanism of leptin-induced activation of CD36 in the obese state.
FATP1 and Breast Cancer Metastasis
10
Aims
This present study aims to further our understanding of the role of fatty acid transporters in breast cancer metastasis in an effort to provide future viable treatment strategies in preventing metastasis across multiple breast cancer subtypes. We propose to use our models of metastatic breast cancer in concert with lentiviral gene expression modulation to rigorously test the hypothesis that fatty acid transport is an important mediator in the breast cancer metastatic process. We plan to test this hypothesis by pursuing the following specific aims:
Aim 1. Establish the impact of leptin treatment on fatty acid transporter expression in both non-metastatic and metastatic breast cancer cell lines. Baseline expression of fatty acid transporters in the MMTV-Wnt1 metastatic murine breast cancer series will be determined using microarray data and will be validated with RT-qPCR. Cell lines will then be treated with leptin and changes to fatty acid transporter expression will be determined using RT-qPCR.
Aim 2. Modulate identified targets and establish the impact on metastatic potential in a metastatic breast cancer progression series.
Modulation will be performed using knockdown of targets identified in aim 1 and characterizing impact on metastatic potential through migration and invasion assays. Knockdown of our target will be carried out using lentiviral delivery of specific shRNA. Knockdown of gene targets will be validated using RT-qPCR. Manipulated cells will be assayed using classical metastatic phenotyping assays.
11
Materials and Methods
Cell line and culture conditions
For Aims 1 and 2, we used a metastatic progression series of four murine breast cancer cell lines, generated from the MMTV-Wnt1 model. Two non-metastatic breast cancer lines, E-Wnt (basal-like, ER+) and M-Wnt (claudin-low, TNBC) were grown directly from clones taken from an MMTV-Wnt1 tumor as previously described (28), while two metastatic lines, metM-Wntliver,
metM-wntLung, were derived from the liver and lung metastases following serial in vivo
transplantation of M-Wnt cells (29). Additionally, for leptin treatment assays, we used the E0771, MMTV-neu, 4T1, as well as the C3Tag series M6, and leptin knockdown (OBR3) and control scrambled (SCR5) lines of murine metM-WntLung (30, 37). Human lines including MDA-MB-468,
MDA-MB-231, MCF7, BT 549, and SKRB3 were also cultured. All cell lines were cultured in 10% FBS cell culture media (RPMI 1640, (-) Phenol Red, (+) L-Glutamine, 10% FBS, 50 μg/ml penicillin/streptomycin, 0.2 mM L-glutamine, 0.01M HEPES buffer).
In Vitro Leptin Treatment
12
samples using SimpliAmp Thermal Cycler (Thermo Fisher Scientific, Waltham, MA) at volume of 20 uL. Samples were then diluted 1:10 in RNAase-free H2O and analyzed using TaqMan
(Thermo Fisher Scientific, Waltham, MA) and SYBR Green (Thermo Fisher Scientific, Waltham, MA) primers and through RT-qPCR using the ViiA 7 Real-Time PCR System (Thermo Fisher Scientific, Waltham, MA). Gene expression results were normalized to β-actin, and relative expression was calculated using ∆∆CT. Primers used in SYBR Green experiments were designed
using PrimerBank (36). Genes analyzed included CD36, ACTB, SOCS3, FABP4, LEPR, ZEB1, and FATP1.
Lentiviral shRNA knockdown of FATP1
MMTV-Wnt1 progression series (E-Wnt, M-Wnt, Met-M-WntLung, Met M WntLiver) were seeded
in separate 96 well plates at 7,500 cells/well. After 24 hours, cells were transduced at 52,500 transduction units of the virus for the more concentrated wells (2x), and 26,250 transduction units for the 1x wells in a 96-well, using conditions determined previously: virus was added to cells kept in serum-free and antibiotic-free transduction medium with polybrene (10 ug/mL). After 24 hours, transduction medium was changed to polybrene-free and antibiotic-free Growth Medium (with 10% serum). After 24 hours, cells were trypsinized and expanded into a larger culture vessel with selection medium (containing the predetermined concentration of puromycin: 10ug/uL). Cells were then replaced with fresh selection medium after 24 hours. At day 7, cell lines were induced with shRNA expression in the experimental cells using the predetermined optimal doxycycline dose (1ug/mL) and then checked for transduction via TurboRFP expression 48 hours later. While E-Wnt and M-Wnt cells were selected using only puromycin selection, Met-M-WntLung and Met
M WntLiver cells were required to undergo FACS for a pure population of RFP-positive cells using
13 MTT Assays
Cells were seeded in 96-well plates at a density of 2,000 cells per well and incubated for 24 hours in 10% FBS cell culture media. Wells were replaced with 10% FBS cell culture media and 10% FBS cell culture media with doxycycline in ethanol (1ug/mL). Cells were incubated for 48 hours and stained with 100uL of MTT solution (1:10 dilution of 3-(4,5-dimethylthiazol-2-yl)-2,5-diphenyl tetrazolium bromide and 2% cell culture media) for an additional 2 hours, covered in foil
and incubated at 37°C. MTT reagent was removed, 100uL of DMSO was added, and the plates
were put on a plate shaker for 10 minutes. Cell viability was recorded using the Cytation 5 Cell
Imaging Reader (BioTek Winooski, VT) at 595 and 690nm.
Statistical Analysis
14
Results
CD36 is a Fatty Acid Transporter with Therapeutic Potential in Cancer
Given previous work regarding the role of CD36 in cancer metastasis in multiple human and murine cancer models, we analyzed publicly available data from The Cancer Genome Atlas (TCGA) to evaluate the relationship between CD36 expression and survival rates in a number of cancers (31). Although not statistically significant in breast cancer, TCGA data revealed a trend of higher CD36 expression leading to lower survival in cancer types (Figure 2).
Figure 2: Higher CD36 expression is associated with reduced survival rates in several human cancers. TCGA was queried for clinical survival data for patients in the top and bottom quartile of CD36 gene expression. Kaplan-Meier survival curves were plotted for multiple cancer types including A: Bladder Cancer (p=0.0314), B: Breast Cancer (p=0.117), C: Colon Cancer (p=0.08), D: Ovarian Cancer (p=0.184). B-D are cancers associated with obesity.
A
B
15
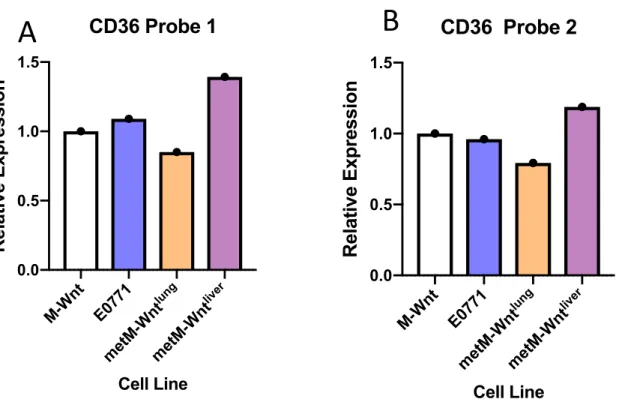
Following our findings in TCGA survival data, we decided to probe existing microarray gene expression databases to assess CD36 expression levels in several breast cancer cell lines and found higher expression of CD36 in the metastatic MetM-wntLiver relative to M-Wnt (probe 1: q=0.039,
probe 2: q=0.24). Based on variability in expression of CD36, we decided to further evaluate CD36 for its role in driving cancer metastasis.
Figure 3 A-B: Existing Microarray of two probes (A: P375146, B: P375138) of CD36 gene expression in Wnt progression series and E0771 cell lines. MetMwntLiver cell line showed higher
expression compared to baseline M-Wnt gene expression levels. All comparisons were adjusted for multiple comparisons.
CD36 Is Not Detectable in MMTV-Wnt1 Progression Series, and is Expressed Heterogeneously in Human Breast Cancer Lines
Given previous work on aberrant expression of CD36 in driving metastatic cancer models, we sought to establish baseline expression levels of CD36 in a triple negative in vitro murine
A
B
M-W nt E077 1 metM-W ntlung metM-W ntliver 0.0 0.5 1.0 1.5CD36 Probe 1
Cell Line Relative Expression M-W nt E077 1 metM-W ntlung metM-W ntliver 0.0 0.5 1.0 1.5
CD36 Probe 2
Cell Line
16
cancer model: the MMTV-Wnt1 (Wnt) series (MetMwntLiver, metMwntLung, M-Wnt, and E-Wnt).
Using RT-qPCR we could not find detectable expression levels of CD36 in the Wnt series, using both a SYBR Green-based method with primers validated on PrimerBank (36) as well as commercially validated TaqMan CD36 primer/probe assay (Figure 4A). Following our inability to detect CD36 in the Wnt series, we looked at mice macrophages to validate whether the SYBR Green and Taq-Man primers for CD36 were functioning as intended, or if there was a separate issue in our gene expression pipeline. We detected CD36 at appropriate levels in mice macrophages, with an average Ct value of ~20 and ∆Ct values of 3.25 when compared to robustly expressed housekeeping genes (Figure 4B).
17 M-W nt E-W nt metM-W ntlung metM-W ntliver 0 2 4 6 8 10 Relative Expression CD36 Cell line Baseline
n.d. n.d. n.d. n.d.
A
B
Repl icate 1 Repl icate 2 Repl icate 3 0 1 2 3 4CD36 in Macrophage
Cell Line
Delta CT
Figure 4 A-B: Baseline RNA levels of CD36 across Wnt series. RNA expression of CD36 was not able to be detected in the murine Wnt Progression series. n.d.; Not Detected. Figure 3B shows delta CT values comparing CD36 expression to housekeeping Gene RPL0 in mouse macrophages.
MCF7 BT549
MDA
MB 2
31 MDA 468 SKBR 3 -2 0 2 4 6 8 CD36 Relative Expression Baseline Cell line
18
Leptin Supplementation Does Not Induce Consistent Gene Expression Responses in Human or Murine Breast Cancer Lines
19
Figure 6: Map of CD36 Genomic Region with STAT3 binding sites identified in a human MCF10A cell line series. Genomic map reveals multiple STAT3 binding sites within the genomic promoter region of CD36 (32).
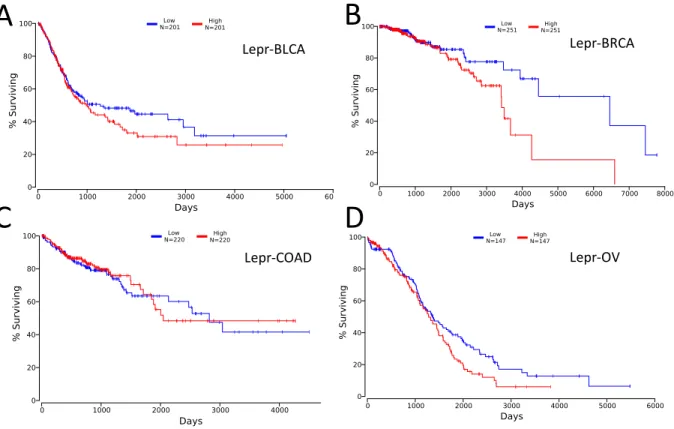
Figure 7: Higher Leptin receptor expression is associated with reduced survival rates in breast and ovarian cancers. TCGA was queried for clinical survival data for patients in the top and bottom quartile of LEPR gene expression. Kaplan-Meier survival curves were plotted for multiple cancer types including A: Bladder Cancer (p=0.033, B: Breast Cancer (p=0.04), C: Colon Cancer (p=0.742), D: Ovarian Cancer (p=0.05).
Lepr-BLCA
Lepr-COAD
Lepr-BRCA
Lepr-OV
A
B
20
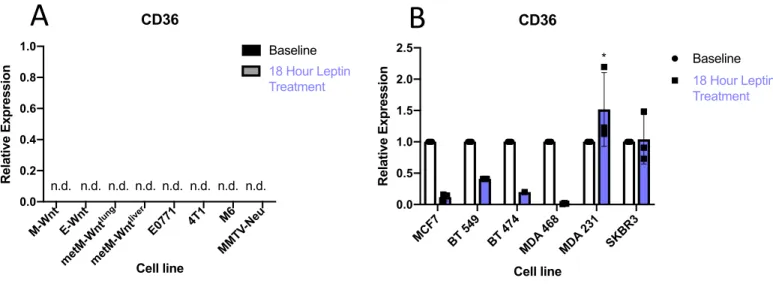
Figure 8 A-B: Relative Expression Levels After 18 Hour leptin supplementation. Cell lines were seeded in triplicate 10-cm plates and were supplemented with leptin (100 ng/mL) in 10% FBS culture media for 18 hours before being analyzed for RNA expression using RT-qPCR. Each leptin supplemented cell line was normalized to their own baseline RNA expression levels. MDA- MB-231 (p=0.044) showed higher expression with leptin treatment while MCF7, 549, BT-474, and MDA-468 all showed significantly lower expression of CD36 after 18 hours of leptin supplementation. (T-tests were conducted between cell line and its matched samples treated with leptin *; p<0.05).
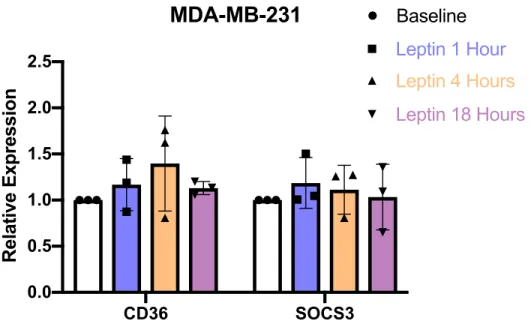
Although leptin treatment seemed to decrease expression of CD36 in many of the human cell lines tested, we did see significantly increased expression in MD-MB-231. As this is a highly metastatic TNBC human cell line, we decided to move forward and compare leptin treatment at 1, 4, and 18-hour time points to analyze temporal expression of CD36 to determine whether we were simply missing peak expression levels. Since many of the cell lines showed decreased expression of CD36, we believed at 18 hours there may be negative feedback in CD36 expression. Because of this, we decided to analyze SOCS3 expression as well. SOCS3 serves as a downstream regulating protein inhibiting JAK and pSTAT3 activation and is a classic marker of leptin signaling axis activation that acts to negatively regulate the system (19). As a result, we expected to see an increase in mRNA expression of SOCS3, indicating that leptin supplementation is inducing the
A
M-W nt E-W nt metM-W ntlung metM-Wntliver E077 1 4T1 M6 MMT V-N eu 0.0 0.2 0.4 0.6 0.8 1.0 Cell line Relative Expression CD36 Baseline 18 Hour Leptin Treatment
n.d. n.d. n.d. n.d. n.d. n.d. n.d. n.d.
MCF7 BT 549 BT 474 MDA 468 MDA 231 SKBR 3 0.0 0.5 1.0 1.5 2.0 2.5 Cell line Relative Expression CD36 Baseline 18 Hour Leptin Treatment *
21
pathway. However, leptin supplementation at 1, 4, and 18 hours did not significantly alter SOCS3 expression (Figure 9).
Figure 9: Expression levels of CD36 and SOCS3 at 1, 4, 18-hour time points. MDA MB 231 were seeded in triplicates for each duration and RNA expression levels were determined and normalized to baseline MDA MB 231 levels. Statistical testing revealed non-significant changes to CD36 expression and SOCS3 expression. (One-way ANOVA with Dunnett’s correction for multiple comparisons was used for data analysis of multiple groups *; p<0.05).
MDA-MB-231 did not show significant increase in CD36 expression at different durations of leptin treatments. Due to inconsistent RNA expression of CD36 under leptin treatment, we wanted to analyze RNA expressions of other fatty acid transporting genes, including FATP1 and FABP4. Similar to CD36, FATP1 contains STAT3 binding domains in its promoter region (25), and like CD36, FATP1 protein content increased in response to leptin treatment in HL-1 cardiomyocytes (34). FABP4 has been implicated in various carcinomas and was found previously to reduce leptin signaling in mice adipocytes (35). Additionally, we looked at expression of leptin receptor (LEPR) as well as ZEB1, a marker for EMT, because of previous work showing leptin’s ability in driving EMT transition in cancer models (22). To better understand the effects of leptin treatment on these genes in breast cancer, we utilized a panel of 10 murine breast cancer lines
CD36 SOCS3
0.0 0.5 1.0 1.5 2.0 2.5
Relative Expression
MDA-MB-231
Baseline22
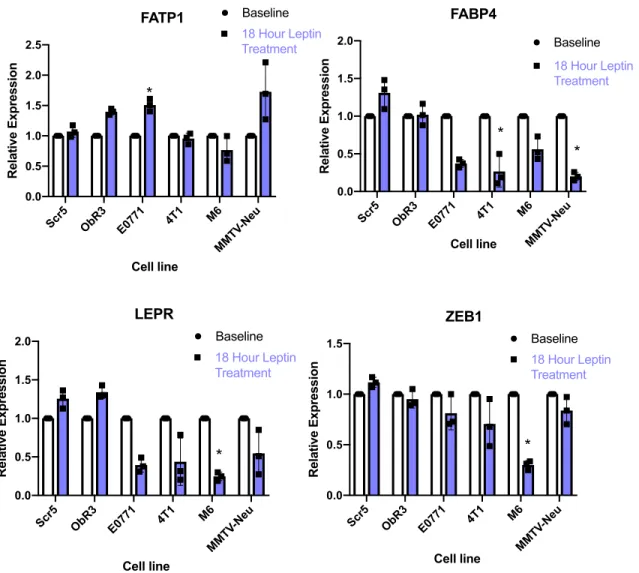
including the MMTV-Wnt1 progression series (Figure 10), as well as MMTV-neu (mouse-equivalent HER2) and the highly metastatic 4T1 (Figure 11). We found a heterogeneous expression response of both FABP4 and FATP1, as well as LEPR and ZEB1 when treated with leptin. We concluded that leptin supplementation at 100 ng/mL did not reliably induce fatty acid transporter expression in either murine or human breast cancer lines.
Figure 10: Differential expression with and without leptin supplementation of FABP4, FATP1, LEPR, and ZEB1 across MMTV-Wnt1 progression series. Cell lines showed heterogeneous expression with leptin supplementation across subtype and metastatic potential. (T-tests were conducted between cell line and its matched samples treated with leptin *; p<0.05).
M-W nt E-W nt metM-W ntlung metM-W ntliver 0.0 0.5 1.0 1.5 2.0 FATP1 Relative Expression Baseline 18 Hour Leptin Treatment Cell line * M-W nt E-W nt metM-W ntlung metM-W ntliver 0.0 0.5 1.0 1.5 Cell line Relative Expression FABP4 Baseline
18 Hour Leptin Treatment * * M-W nt E-W nt metM-W ntlung metM-W ntliver 0.0 0.5 1.0 1.5 LEPR Relative Expression Baseline 18 Hour Leptin Treatment Cell line * * M-W nt E-W nt metM-W ntlung metM-W ntliver 0.0 0.5 1.0 1.5 ZEB1 Relative Expression Baseline 18 Hour Leptin Treatment
23
FATP1 is Upregulated in Metastatic compared to Non-Metastatic Cell Lines
Revisiting our microarray analysis of breast cancer cell lines, we identified FATP1 as significantly upregulated in both of our metM-Wnt lines compared to the non-metastatic M-Wnt. Importantly, this relationship also held when comparing the non-metastatic M-Wnt to the metastatic E0771 (Figure 12). To validate our findings from the microarray, we cultured the Wnt progression series (M-Wnt, MetM-wntLiver, and metM-wntLung), in addition to the E-Wnt cell line
Scr5 ObR3 E0771 4T1 M6
MMT V-Neu 0.0 0.5 1.0 1.5 2.0 Cell line Relative Expression FABP4 Baseline 18 Hour Leptin Treatment
*
*
Scr5 ObR3 E0771 4T1 M6
MMT V-N eu 0.0 0.5 1.0 1.5 2.0 2.5 FATP1 Relative Expression Baseline
18 Hour Leptin Treatment
Cell line
*
Scr5 ObR3 E0771 4T1 M6
MMT V-N eu 0.0 0.5 1.0 1.5 2.0 LEPR Relative Expression Baseline
18 Hour Leptin Treatment
Cell line
*
Scr5 ObR3 E0771 4T1 M6
MMT V-Neu 0.0 0.5 1.0 1.5 ZEB1 Relative Expression Baseline 18 Hour Leptin Treatment
Cell line
*
24
in order to have two non-metastatic lines for comparisons. We isolated RNA from these cell lines to analyze FATP1 expression via RT-qPCR, and confirmed that FATP1 expression was elevated in both metastatic cell lines compared to the M-Wnt as well as E-Wnt cell lines (Figure 13).
Figure 12: Existing Microarray of two probes (A: P199905, B: P117477) of FATP1 gene expression MMTV-Wnt1 progression series and E0771 cell lines. MetMwntLiver and
metMwntLung cell lines showed higher expression compared to baseline M-Wnt gene expression
levels. All comparisons were made against M-Wnt q<0.0015.
M-W nt
E077 1
metM-W ntlung
metM-W ntliver 0
2 4 6 8
FATP1 Probe 1
Cell Line
Relative Expression
M-W nt
E077 1
metM-W ntlung
metM-W ntliver 0
1 2 3 4 5
FATP1 Probe 2
Cell Line
Relative Expression
25
Figure 13: Baseline RNA levels of FATP1 across in vitro MMTV-Wnt1 progression series. Each cell line was normalized to M-Wnt gene expression levels and 3 biological replicates were cultured 24 hours apart to determine baseline gene expression level. MetMwntLung showed higher
expression FATP1 compared to M-Wnt (p=0.0642) and MetMwntLiver showed significantly higher
expression of baseline FATP1 (p=0.0023). Comparisons between cell lines vs M-Wnt was made using a one-way ANOVA with Dunnett’s Correction *; p<0.05).
Successful Inducible Knockdown of FATP1 Does Not Change Baseline Expression
After validating higher expression of FATP1 in the metMwntLiver and metMwntLung lines,
we decided to modulate FATP1 to further investigate its role in breast cancer metastasis. We knocked down FATP1 using lentiviral delivery of a Tet-On/Off inducible shRNA in the Wnt progression series: metMwntLiver, metMwntLung, M-Wnt, and E-Wnt. Knockdown of FATP1 was
verified through RT-qPCR (Figure 14 A-B). Noticeably, while M-Wnt, metMwntLiver, and
metMwntLung cells showed similar knockdown with either a 1x or 2x dose of lentivirus, the E-Wnt
cell line showed improved knockdown with the 2x dose of virus. Additionally, we analyzed expression of FATP1 in Wnt series that received lentiviral transduction in the absence of doxycycline to verify that viral transduction did not affect baseline expression of FATP1. We were
M-W nt
E-W nt
metM-W ntlung
metM-W ntliver 0
5 10 15
FATP1
Relative Expression
Baseline
Cell line
26
able to confirm that viral transduction did not alter baseline expression in non-induced cells, and MetMwntLiver, metMwntLung displayed significantly higher expression of FATP1 when compared
to the non-metastatic M-Wnt and E-Wnt lines (Figure 14C). Following validation of FATP1 knockdown and results showing normal expression of FATP1 in the absence of shRNA induction, we began cell phenotyping assays to determine the effect of FATP1 modulation on metastatic breast cancer. Ewnt 0.0 0.5 1.0 1.5 Relative Expression FATP1 Control Cell line
KD Dose 1
KD Dose 2
M-W nt Ewnt metM-W ntlung metM-W ntliver 0 2 4 6 8 10 FATP1 Relative Expression Control Cell line
A
B
C
M-W nt metM-W ntlung metM-W ntliver 0.0 0.5 1.0 1.5 FATP1 Relative Expression Control Cell lineKD Dose 1 KD Dose 2
Figure 14: Knockdown of FATP1 Gene Expression. Cell lines were induced with shRNA expression in experimental cells using doxycycline (1ug/mL) for 48 hours and then isolated for RNA. Knockdown for M-Wnt, MetMwntLung, and metMwntLiver (A) demonstrated
similar knockdown regardless of viral dose, while E-Wnts showed increased knockdown with increased dose (B). Viral transduction in the Wnt progression series did not alter baseline expression (C), and MetMwntLiver, metMwntLung displayed
27
FATP1 Knockdown Decreases Proliferation Selectively in Metastatic Cell Lines
After confirming knockdown of FATP1 using lentiviral delivery of shRNA, we wanted to determine the impact of FATP1 knockdown on cell proliferation. To accomplish this, we used MTT cell proliferation assays (Figure 15). Cell proliferation was significantly reduced in the metMwntLung cells following FATP1 knockdown. Additionally, while non-significant, cell
viability was trending down in the metMwntLiver FATP1 knockdown (p=0.0685) and interestingly
was significantly increased in the M-Wnt line following FATP1 knockdown. Although these findings are promising, further metastatic assays need to be conducted to better characterize FATP1’s role in mediating cellular metastasis.
Figure 15: Relative Expression of Cell Proliferation in FATP1 Induced Knockdown. Cells were seeded in 96 well plates for 72 hours. Knockdown lines received dose of doxycycline (1ug/mL) 24 hours after seeding and cell proliferation was determined after 48 hours. Cell proliferation rates were normalized to each non-induced cell line. MetMwntLung showed significant
reductions in cell proliferation (p=0.003) and metMwntLiver showed slight reduction in cell
proliferation, but not statistically significant (p=0.0685). (T-tests were conducted between cell line and its matched sample induced by doxycycline *; p<0.05).
M-W nt
metM-W ntlung
metM-W ntliver 85
90 95 100 105 110
FATP1
Relative Expression
Cell line
Control
FATP1 Knockdown
*
28
Discussion
An emerging mechanism integral to the process of breast cancer metastasis is altered lipid metabolism, which is typically exacerbated in the obese state. While obesity has been recognized as a risk factor for breast cancer metastasis, the relationship between the two remains unclear (29). Leptin, when elevated in obesity, has been shown to be an important mediator in altering lipid metabolism and fatty acid transport (34). We aimed to further our understanding of the altered role of fatty acid transporters seen in the pro-metastatic environment of breast cancer, particularly in the leptin-high obese context. It was discovered that higher CD36 expression was associated with reduced survival rates in breast cancer from TCGA data sets (24). After probing existing microarrays of CD36, increased expression of the metastatic MetMwntLiver line was discovered
compared to the non-metastatic M-Wnt. Because of this, in addition to multiple previous studies showing the role of CD36 in various human and murine carcinomas (Table 1), we decided to further probe the role that CD36 might play in breast cancer metastasis.
29
epithelial cell lines, as well as experimental data in other cell types showing induction of CD36 via STAT3, we began supplementing cell lines with leptin (100 ng/mL) for 18 hours in hopes to induce the JAK-STAT3 signaling pathway and subsequently increase CD36 expression (25).
Following leptin supplementation in human cell lines, the more aggressive and invasive MDA-MB-231 were found to have significantly higher expression of CD36 and so we focused in on MDA-MB-231 cells to observe changes in RNA expression over time. In addition to CD36, SOCS3 expression was measured. SOCS3 serves as a downstream regulating factor of the JAK-STAT pathway preventing phosphorylation and activation of JAK-STAT3 (19). Since multiple human cell lines analyzed revealed reduction in CD36 expression following leptin treatment, we believed negative feedback of the JAK-STAT pathway through SOCS3 may have resulted in decreased CD36 expression when treated for 18 hours, so we selected 1, 4, and 18-hour time points of leptin treatment for further analysis of CD36 induction. MDA-MB-231 cells displayed no significant changes in expression of either CD36 or SOCS3 at the 1, 4, and 18-hour time points of leptin supplementation. Cells receiving leptin treatment showed no morphological changes or changes in visible cell death (data not shown), and data displayed was relative expression normalized to the reference gene, accounting for potential differences in cell count between conditions. Further experiments need to be conducted to determine whether the leptin dosage used was inadequate or not sustained long enough to induce the JAK-STAT3 pathway response. Using these and other measures could potentially better induce the JAK-STAT pathway and thus provide clearer insight into the relationship between CD36 and leptin, but are outside the scope of this research.
30
of murine lines (Figure 7). Although we were unable to induce CD36 expression through leptin in murine breast cancer lines, we evaluated expression of leptin receptor (LEPR), as well as an EMT marker ZEB1 previously shown to be increased in lung cancer cells induced by leptin in the ERK signaling pathway (22). Moreover, we looked at expression of FATP1 and FABP4, both previously implicated in cancer progression and metastasis, with FATP1, in particular, linked to higher leptin concentrations in HL-1 cardiomyocytes (34). Leptin supplementation did not induce higher expressions of either FATP1 or FABP4 in the majority of cell lines. E0771, however, did show higher expression of FATP1 when treated with leptin. Interestingly, the panel of murine breast cancer lines also did not show an increase in either LEPR or ZEB1 following leptin treatment, further indicating that our leptin supplementation did not seem to activate the JAK-STAT pathway.
Following our issues with reproducibly measuring CD36 expression and leptin signaling, we revisited our microarray analysis of fatty acid transporters and identified FATP1 as a potential mediator of pro-metastatic behavior in our Wnt progression series. In addition, the metastatic E0771 (a cell line derived from a spontaneous adenocarcinoma in a C57Bl/6 mouse) had increased FATP1 expression compared to the non-metastatic M-Wnt. Data from TCGA similarly showed decreased survival rate in patients whose breast tumors had increased expression of FATP1 (7). Given this data, in addition to work in melanoma showing that FATP1 deletion reduces invasion and growth (9), we sought to unravel FATP1’s role in breast cancer metastasis. In accordance with the microarray, we were able to confirm an increase in the metMwntLiver and metMwntLung FATP1
31
After confirming data that FATP1 was upregulated in several metastatic vs nonmetastatic cell lines, we modulated FATP1 to establish a better understanding of its role in cancer metastasis, using lentiviral transduction to induce knockdown of FATP1. We were able to successfully knockdown FATP1 under two different sets of viral doses for the M-Wnt, MetMwntLiver and
metMwntLung. E-Wnt cells received same viral doses but showed partial knockdown of FATP1
through viral transduction, which may be partly due to their epithelial-like characteristic, as these cells grow in sheets and theoretically display less available surface area than the other more mesenchymal-like lines. One option to improve transduction in the future could be a lentiviral spinfection, increasing contact surfaces between viral particles and the epithelial cells. As a result of a lack of incomplete knockdown of FATP1 in the E-Wnts, we moved to just look at M-Wnt, metMwntLiver and metMwntLung for our in vitro assays.
MTT assays revealed an association of decreased cell proliferation following FATP1 knockdown in metastatic cell lines. metMwntLiver and metMwntLung induced FATP1 KD cells
showed reductions in cell proliferation compared to control cells that were not induced. Knockdown of FATP1 in metMwntLung cells particularly showed significant reduction in cell
proliferation compared to control metMwntLung cells. Interestingly, FATP1 KD M-Wnt cells
32
33
Conclusion
34
References
1. Bray F, Ferlay J, Soerjomataram I, Siegel RL, Torre LA, Jemal A. Global cancer statistics 2018: GLOBOCAN estimates of incidence and mortality worldwide for 36 cancers in 185 countries. CA Cancer J Clin. 2018;68(6):394-424. doi:10.3322/caac.21492
2. Survival Rates for Breast Cancer. American Cancer Society. 2019 Sep 20. https://www.cancer.org/cancer/breast-cancer/understanding-a-breast-cancer-diagnosis/breast-cancer-survival-rates.htm
3. Seyfried, T. N., & Huysentruyt, L. C. (2013). On the origin of cancer metastasis. Critical reviews in oncogenesis, 18(1-2), 43–73. doi:10.1615/critrevoncog.v18.i1-2.40
4. Phan, L. M., Yeung, S. C., & Lee, M. H. (2014). Cancer metabolic reprogramming: importance, main features, and potentials for precise targeted anti-cancer therapies. Cancer biology & medicine, 11(1), 1–19. https://doi.org/10.7497/j.issn.2095-3941.2014.01.001
triple negative breast cancer. NPJ breast cancer, 3, 26. doi:10.1038/s41523-017-0027-5
5. Vucenik, I., & Stains, J. P. (2012). Obesity and cancer risk: evidence, mechanisms, and recommendations. Annals of the New York Academy of Sciences, 1271(1), 37–43. https://doi.org/10.1111/j.1749-6632.2012.06750.x
6. CDC. (2020, February 27). Adult Obesity Facts. Centers for Disease Control and Prevention; CDC. https://www.cdc.gov/obesity/data/adult.html
35
8. Park J, Morley TS, Kim M, Clegg DJ, Scherer PE. Obesity and cancer—mechanisms underlying tumour progression and recurrence. Nature Reviews Endocrinology. 2014;10(8):455-65. doi: 10.1038/nrendo.2014.94.
9. Omabe M, Ezeani M, Omabe KN. Lipid metabolism and cancer progression: The missing target in metastatic cancer treatment. Journal of Applied Biomedicine. 2015;13(1):47-59. doi: 10.1016/j.jab.2014.09.004.
10. Nath A, Chan C. Genetic alterations in fatty acid transport and metabolism genes are associated with metastatic progression and poor prognosis of human cancers. Sci Rep. 2016;6:18669. doi: 10.1038/srep18669. PubMed PMID: 26725848; PMCID: PMC4698658.
11. Ladanyi, A., Mukherjee, A., Kenny, H. A., Johnson, A., Mitra, A. K., Sundaresan, S., Nieman, K. M., Pascual, G., Benitah, S. A., Montag, A., Yamada, S. D., Abumrad, N. A., & Lengyel, E. (2018). Adipocyte-induced CD36 expression drives ovarian cancer progression and metastasis. Oncogene, 37(17), 2285–2301. https://doi.org/10.1038/s41388-017-0093-z
12. Pascual G, Avgustinova A, Mejetta S, Martin M, Castellanos A, Attolini CS, Berenguer A, Prats N, Toll A, Hueto JA, Bescos C, Di Croce L, Benitah SA. Targeting metastasis-initiating cells through the fatty acid receptor CD36. Nature. 2017;541(7635):41-5. doi: 10.1038/nature20791. PubMed PMID: 27974793.
13. Pizon M, Schott D, Pachamnn U, Pachmann K. Correlation of fatty acid receptor (CD36) positive circulating epithelial tumor cells (CETCs) with aggressiveness of breast cancer disease. Journal of Clinical Oncology . 2018 Jun 1. doi:10.1200/JCO.2018.36.15_suppl.e24032
36
15. Pizon M, Schott D, Pachamnn U, Pachmann K. Correlation of fatty acid receptor (CD36) positive circulating epithelial tumor cells (CETCs) with aggressiveness of breast cancer disease. Journal of Clinical Oncology . 2018 Jun 1. doi:10.1200/JCO.2018.36.15_suppl.e24032
16. Zhao, J., Zhi, Z., Wang, C., Xing, H., Song, G., Yu, X., … Di, Y. (2017). Exogenous lipids promote the growth of breast cancer cells via CD36. Oncology reports, 38(4), 2105–2115. doi:10.3892/or.2017.5864
17. Nath, A., Li, I., Roberts, L. R., & Chan, C. (2015). Elevated free fatty acid uptake via CD36 promotes epithelial-mesenchymal transition in hepatocellular carcinoma. Scientific reports, 5, 14752. https://doi.org/10.1038/srep14752
18. Hale, J. S., Otvos, B., Sinyuk, M., Alvarado, A. G., Hitomi, M., Stoltz, K., Wu, Q., Flavahan, W., Levison, B., Johansen, M. L., Schmitt, D., Neltner, J. M., Huang, P., Ren, B., Sloan, A. E., Silverstein, R. L., Gladson, C. L., DiDonato, J. A., Brown, J. M., McIntyre, T., Hazen, S. L., Horbinski, C., Rich, J. N., … Lathia, J. D. (2014). Cancer stem cell-specific scavenger receptor CD36 drives glioblastoma progression. Stem cells (Dayton, Ohio), 32(7), 1746-58.
19. Mullen, M., & Gonzalez-Perez, R. R. (2016). Leptin-Induced JAK/STAT Signaling and Cancer Growth. Vaccines, 4(3), 26. https://doi.org/10.3390/vaccines4030026
20. O'Flanagan, C. H., Bowers, L. W., & Hursting, S. D. (2015). A weighty problem: metabolic perturbations and the obesity-cancer link. Hormone molecular biology and clinical investigation, 23(2), 47–57. https://doi.org/10.1515/hmbci-2015-0022
37
22. Xu, M., Cao, F. L., Li, N., Gao, X., Su, X., & Jiang, X. (2018). Leptin induces epithelial-to-mesenchymal transition via activation of the ERK signaling pathway in lung cancer cells. Oncology letters, 16(4), 4782–4788. https://doi.org/10.3892/ol.2018.9230
23. Sánchez-Jiménez, F., Pérez-Pérez, A., de la Cruz-Merino, L., & Sánchez-Margalet, V. (2019). Obesity and Breast Cancer: Role of Leptin. Frontiers in oncology, 9, 596. https://doi.org/10.3389/fonc.2019.00596
24. Minokoshi, Y., Toda, C., & Okamoto, S. (2012). Regulatory role of leptin in glucose and lipid metabolism in skeletal muscle. Indian journal of endocrinology and metabolism, 16(Suppl 3), S562–S568. https://doi.org/10.4103/2230-8210.105573
25. Rozovski, U., Harris, D. M., Li, P., Liu, Z., Jain, P., Ferrajoli, A., Burger, J., Thompson, P., Jain, N., Wierda, W., Keating, M. J., & Estrov, Z. (2018). STAT3-activated CD36 facilitates fatty acid uptake in chronic lymphocytic leukemia cells. Oncotarget, 9(30), 21268–21280. https://doi.org/10.18632/oncotarget.25066
26. Hajri, T., et al. “CD36-Facilitated Fatty Acid Uptake Inhibits Leptin Production and Signaling in Adipose Tissue.” Diabetes, vol. 56, no. 7, 2007, pp. 1872–1880., doi:10.2337/db06-1699. 27. Zhang, M., Di Martino, J. S., Bowman, R. L., Campbell, N. R., Baksh, S. C., Simon-Vermot, T., Kim, I. S., Haldeman, P., Mondal, C., Yong-Gonzales, V., Abu-Akeel, M., Merghoub, T., Jones, D. R., Zhu, X. G., Arora, A., Ariyan, C. E., Birsoy, K., Wolchok, J. D., Panageas, K. S., Hollmann, T., … White, R. M. (2018). Adipocyte-Derived Lipids Mediate Melanoma Progression via FATP Proteins. Cancer discovery, 8(8), 1006–1025. https://doi.org/10.1158/2159-8290.CD-17-1371
38
progression in murine claudin-low and basal-like mammary tumor models. Cancer prevention research (Philadelphia, Pa.), 5(7), 930–942. https://doi.org/10.1158/1940-6207.CAPR-12-0034 29. O'Flanagan, C. H., Rossi, E. L., McDonell, S. B., Chen, X., Tsai, Y. H., Parker, J. S., …
Hursting, S. D. (201H7). Metabolic reprogramming underlies metastatic potential in an
obesity-responsive murine model of metastatic triple negative breast cancer. NPJ breast cancer, 3, 26.
doi:10.1038/s41523-017-0027-5
30.. Bowers, L. W., Rossi, E. L., McDonell, S. B., Doerstling, S. S., Khatib, S. A., Lineberger, C. G., Albright, J. E., Tang, X., deGraffenried, L. A., & Hursting, S. D. (2018). Leptin Signaling Mediates Obesity-Associated CSC Enrichment and EMT in Preclinical TNBC Models. Molecular cancer research : MCR, 16(5), 869–879. https://doi.org/10.1158/1541-7786.MCR-17-0508 31. Anaya J. 2016. OncoLnc: linking TCGA survival data to mRNAs, miRNAs, and lncRNAs. PeerJ Computer Science 2:e67 https://doi.org/10.7717/peerj-cs.67
32. Maximilian Haeussler, Ann S Zweig, Cath Tyner, Matthew L Speir, Kate R Rosenbloom, Brian J Raney, Christopher M Lee, Brian T Lee, Angie S Hinrichs, Jairo Navarro Gonzalez, David Gibson, Mark Diekhans, Hiram Clawson, Jonathan Casper, Galt P Barber, David Haussler, Robert M Kuhn, W James Kent, The UCSC Genome Browser database: 2019 update, Nucleic Acids Research, Volume 47, Issue D1, 08 January 2019, Pages D853– D858, https://doi.org/10.1093/nar/gky1095
33. Liang, Y., Han, H., Liu, L. et al. CD36 plays a critical role in proliferation, migration and tamoxifen-inhibited growth of ER-positive breast cancer cells. Oncogenesis 7, 98 (2018) doi:10.1038/s41389-018-0107-x
39
cardiomyocytes. Metabolism: Clinical and Experimental, 55(8), 1067–1075. https://doi.org/https://doi.org/10.1016/j.metabol.2006.03.020
35. Gan, L., Liu, Z., Cao, W., Zhang, Z., & Sun, C. (2015). FABP4 reversed the regulation of leptin on mitochondrial fatty acid oxidation in mice adipocytes. Scientific reports, 5, 13588. https://doi.org/10.1038/srep13588
36. Spandidos, A., Wang, X., Wang, H. et al. A comprehensive collection of experimentally validated primers for Polymerase Chain Reaction quantitation of murine transcript abundance. BMC Genomics 9, 633 (2008). https://doi.org/10.1186/1471-2164-9-633
37. Holzer, R.G., MacDougall, C., Cortright, G. et al. Development and Characterization of a Progressive Series of Mammary Adenocarcinoma Cell Lines Derived from the C3(1)/SV40 Large T-antigen Transgenic Mouse Model. Breast Cancer Res Treat 77, 65–76 (2003). https://doi.org/10.1023/A:1021175931177