ARTICLE
A Large-Scale Multi-ancestry Genome-wide Study
Accounting for Smoking Behavior Identifies
Multiple Significant Loci for Blood Pressure
Yun J. Sung,1,216,* Thomas W. Winkler,2,216 Lisa de las Fuentes,3,216 Amy R. Bentley,4,216
Michael R. Brown,5,216 Aldi T. Kraja,6,216 Karen Schwander,1,216 Ioanna Ntalla,7,216 Xiuqing Guo,8 Nora Franceschini,9 Yingchang Lu,10 Ching-Yu Cheng,11,12,13 Xueling Sim,14 Dina Vojinovic,15
Jonathan Marten,16 Solomon K. Musani,17 Changwei Li,18Mary F. Feitosa,6 Tuomas O. Kilpela¨inen,19,20 Melissa A. Richard,21 Raymond Noordam,22 Stella Aslibekyan,23 Hugues Aschard,24,25 Traci M. Bartz,26 Rajkumar Dorajoo,27 Yongmei Liu,28 Alisa K. Manning,29,30 Tuomo Rankinen,31
Albert Vernon Smith,32,33 Salman M. Tajuddin,34 Bamidele O. Tayo,35 Helen R. Warren,7,36 Wei Zhao,37 Yanhua Zhou,38 Nana Matoba,39 Tamar Sofer,40 Maris Alver,41 Marzyeh Amini,42
(Author list continued on next page)
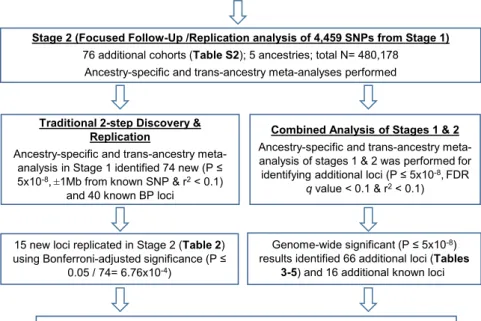
Genome-wide association analysis advanced understanding of blood pressure (BP), a major risk factor for vascular conditions such as coronary heart disease and stroke. Accounting for smoking behavior may help identify BP loci and extend our knowledge of its genetic architecture. We performed genome-wide association meta-analyses of systolic and diastolic BP incorporating gene-smoking interac-tions in 610,091 individuals. Stage 1 analysis examined18.8 million SNPs and small insertion/deletion variants in 129,913 individ-uals from four ancestries (European, African, Asian, and Hispanic) with follow-up analysis of promising variants in 480,178 additional individuals from five ancestries. We identified 15 loci that were genome-wide significant (p<53108) in stage 1 and formally
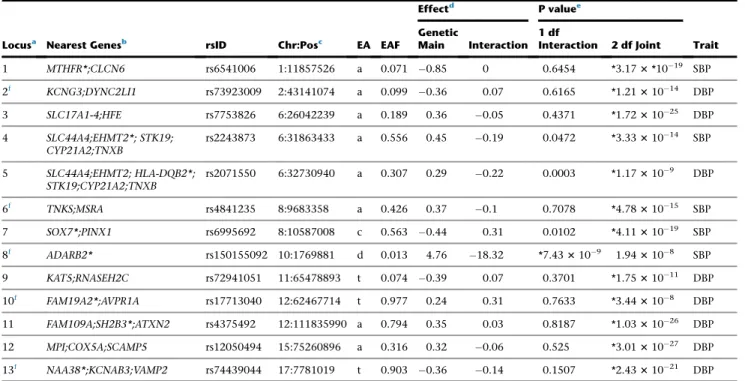
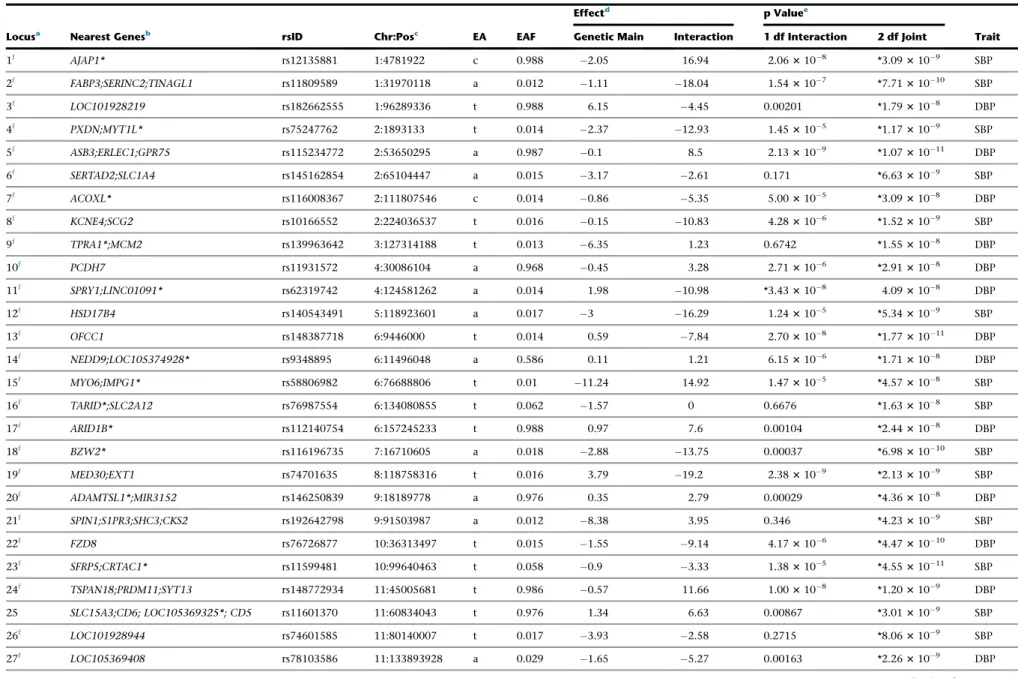
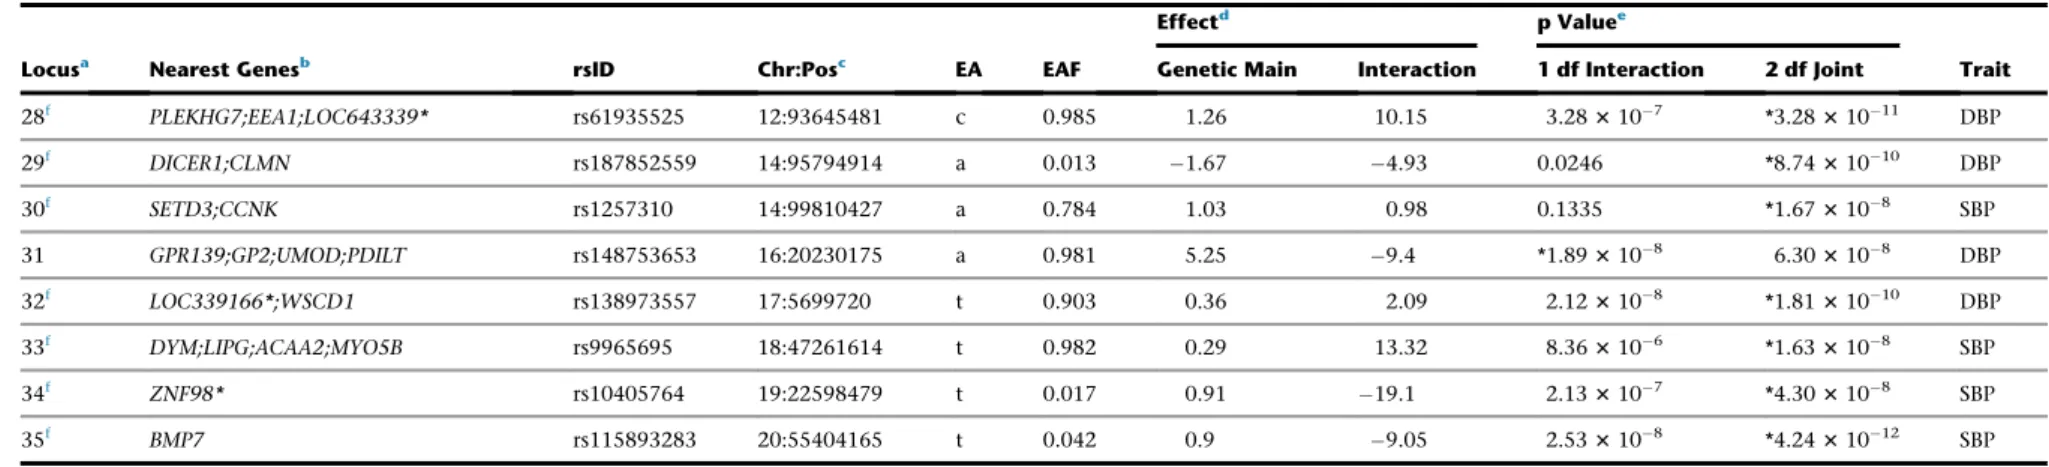
repli-cated in stage 2. A combined stage 1 and 2 meta-analysis identified 66 additional genome-wide significant loci (13, 35, and 18 loci in European, African, and trans-ancestry, respectively). A total of 56 known BP loci were also identified by our results (p<53108). Of the newly identified loci, ten showed significant interaction with smoking status, but none of them were replicated in stage 2. Several loci were identified in African ancestry, highlighting the importance of genetic studies in diverse populations. The identified loci show strong evidence for regulatory features and support shared pathophysiology with cardiometabolic and addiction traits. They also high-light a role in BP regulation for biological candidates such as modulators of vascular structure and function (CDKN1B,BCAR1-CFDP1,
PXDN,EEA1), ciliopathies (SDCCAG8,RPGRIP1L), telomere maintenance (TNKS,PINX1,AKTIP), and central dopaminergic signaling (MSRA,EBF2).
Introduction
The management of blood pressure (BP) is a major public health priority with implications for the prevention of coronary heart disease, heart failure, stroke, and other
vascular conditions. BP is partly under genetic control with moderately high heritability (30%–60%),1although only a small fraction of the heritability has been explained by variants identified through genome-wide association studies (GWASs).2 Specifically, the common variants
1Division of Biostatistics, Washington University School of Medicine, St. Louis, MO 63110, USA;2Department of Genetic Epidemiology, University of Re-gensburg, Regensburg 93051, Germany;3Cardiovascular Division, Department of Medicine, Washington University, St. Louis, MO 63110, USA;4Center for Research on Genomics and Global Health, National Human Genome Research Institute, NIH, Bethesda, MD 20892, USA;5Department of Epidemiology, Human Genetics, and Environmental Sciences, The University of Texas School of Public Health, Houston, TX 77030, USA;6Division of Statistical Geno-mics, Department of Genetics, Washington University School of Medicine, St. Louis, MO 63108, USA;7William Harvey Research Institute, Clinical Phar-macology, Queen Mary University of London, London EC1M 6BQ, UK;8Genomic Outcomes, Department of Pediatrics, LABioMed at Harbor-UCLA Med-ical Center, Torrance, CA 90502, USA;9Department of Epidemiology, University of North Carolina Gillings School of Global Public Health, Chapel Hill, NC 27514, USA;10Icahn School of Medicine at Mount Sinai, The Charles Bronfman Institute for Personalized Medicine, New York, NY 10029, USA;11Singapore Eye Research Institute, Singapore National Eye Centre, Singapore, Singapore 169856, Singapore;12Ophthalmology & Visual Sciences Academic Clinical Program (Eye ACP), Duke-NUS Medical School, Singapore, Singapore 169857, Singapore;13Department of Ophthalmology, Yong Loo Lin School of Med-icine, National University of Singapore, Singapore, Singapore 117597, Singapore;14Saw Swee Hock School of Public Health, National University Health System and National University of Singapore, Singapore, Singapore 117549, Singapore;15Department of Epidemiology, Erasmus University Medical Center, Rotterdam, the Netherlands;16Medical Research Council Human Genetics Unit, Institute of Genetics & Molecular Medicine, University of Edinburgh, Ed-inburgh EH4 2XU, UK;17Jackson Heart Study, Department of Medicine, University of Mississippi Medical Center, Jackson, MS 39213, USA;18Department of Epidemiology and Biostatistics, University of Giorgia at Athens College of Public Health, Athens, GA 30602, USA;19Section of Metabolic Genetics, Novo Nordisk Foundation Center for Basic Metabolic Research, Faculty of Health and Medical Sciences, University of Copenhagen, Copenhagen 2100, Denmark; 20Department of Environmental Medicine and Public Health, The Icahn School of Medicine at Mount Sinai, New York, NY 10029, USA;21Brown Founda-tion Institute of Molecular Medicine, University of Texas Health Science Center at Houston, Houston, TX 77030, USA;22Department of Internal Medicine, Section of Gerontology and Geriatrics, Leiden University Medical Center, Leiden 2300RC, the Netherlands;23Department of Epidemiology, University of Alabama at Birmingham, Birmingham, AL 35294, USA;24Department of Epidemiology, Harvard School of Public Health, Boston, MA 02115, USA;25Centre de Bioinformatique Biostatistique et Biologie Integrative (C3BI), Institut Pasteur, Paris 75015, France;26Cardiovascular Health Research Unit, Biostatistics
(Affiliations continued on next page)
The American Journal of Human Genetics102, 375–400, March 1, 2018 375
Mathilde Boissel,43Jin Fang Chai,44Xu Chen,45Jasmin Divers,28Ilaria Gandin,46Chuan Gao,47 Franco Giulianini,48Anuj Goel,49,50Sarah E. Harris,51,52Fernando Pires Hartwig,53
Andrea R.V.R. Horimoto,54Fang-Chi Hsu,28Anne U. Jackson,55Mika Ka¨ho¨nen,56,57
Anuradhani Kasturiratne,58Brigitte Ku¨hnel,59,60Karin Leander,61Wen-Jane Lee,62Keng-Hung Lin,63 Jian ’an Luan,64Colin A. McKenzie,65He Meian,66Christopher P. Nelson,67,68Rainer Rauramaa,69 Nicole Schupf,70Robert A. Scott,64Wayne H.H. Sheu,71,72,73,74Alena Stanca´kova´,75Fumihiko Takeuchi,76 Peter J. van der Most,42Tibor V. Varga,77Heming Wang,78Yajuan Wang,78Erin B. Ware,37,79
Stefan Weiss,80,81Wanqing Wen,82Lisa R. Yanek,83Weihua Zhang,84,85Jing Hua Zhao,64Saima Afaq,84 Tamuno Alfred,10Najaf Amin,15Dan Arking,86Tin Aung,11,12,13R. Graham Barr,87Lawrence F. Bielak,37 Eric Boerwinkle,88,89Erwin P. Bottinger,10Peter S. Braund,67,68Jennifer A. Brody,90Ulrich Broeckel,91 Claudia P. Cabrera,7,36Brian Cade,92Yu Caizheng,66Archie Campbell,93Mickae¨l Canouil,43
Aravinda Chakravarti,94The CHARGE Neurology Working Group, Ganesh Chauhan,95Kaare Christensen,96 Massimiliano Cocca,46The COGENT-Kidney Consortium, Francis S. Collins,97John M. Connell,98
Rene´e de Mutsert,99H. Janaka de Silva,100Stephanie Debette,101,102,103Marcus Do¨rr,81,104Qing Duan,105 Charles B. Eaton,106Georg Ehret,94,107Evangelos Evangelou,84,108Jessica D. Faul,109Virginia A. Fisher,38 Nita G. Forouhi,64Oscar H. Franco,15Yechiel Friedlander,110He Gao,84,111The GIANT Consortium,
(Author list continued on next page)
and Medicine, University of Washington, Seattle, WA 98101, USA;27Genome Institute of Singapore, Agency for Science Technology and Research, Singapore 138672, Singapore;28Division of Biostatistical Sciences, Department of Public Health Sciences, Wake Forest School of Medicine, Winston-Salem, NC 27157, USA;29Center for Human Genetics Research, Massachusetts General Hospital, Boston, MA 02114, USA;30Program in Medical and Population Genetics, Broad Institute of MIT and Harvard, Cambridge, MA 02142, USA;31Human Genomics Laboratory, Pennington Biomedical Research Center, Baton Rouge, LA 70808, USA;32Icelandic Heart Association, Kopavogur 201, Iceland;33Faculty of Medicine, University of Iceland, Reykjavik 101, Iceland; 34
Health Disparities Research Section, Laboratory of Epidemiology and Population Sciences, National Institute on Aging, NIH, Baltimore, MD 21224, USA;35Department of Public Health Sciences, Loyola University Chicago, Maywood, IL 60153, USA;36NIHR Cardiovascular Biomedical Research Unit, Barts and The London School of Medicine and Dentistry, Queen Mary University of London, London EC1M 6BQ, UK;37School of Public Health, Depart-ment of Epidemiology, University of Michigan, Ann Arbor, MI 48109, USA;38Department of Biostatistics, Boston University School of Public Health, Bos-ton, MA 02118, USA;39Laboratory for Statistical Analysis, Center for Integrative Medical Sciences, RIKEN, Yokohama 230-0045, Japan;40Department of Biostatistics, University of Washington, Seattle, WA 98105, USA;41Estonian Genome Center, University of Tartu, Tartu 51010, Estonia;42Department of Epidemiology, University of Groningen, University Medical Center Groningen, Groningen 9700 RB, the Netherlands;43CNRS UMR 8199, European Genomic Institute for Diabetes (EGID), Institut Pasteur de Lille, University of Lille, Lille 59000, France;44Saw Swee Hock School of Public Health, National University of Singapore, Singapore 117549, Singapore;45Department of Medical Epidemiology and Biostatistics, Karolinska Institutet, Stockholm 17177, Sweden;46Department of Medical Sciences, University of Trieste, Trieste 34137, Italy;47Department of Molecular Genetics and Genomics Program, Wake Forest School of Medicine, Winston-Salem, NC 27157, USA;48Division of Preventive Medicine, Department of Medicine, Brigham and Women’s Hospital, Boston, MA 02215, USA;49Division of Cardiovascular Medicine, Radcliffe Department of Medicine, University of Oxford, Oxford, Oxfordshire OX3 9DU, UK;50Wellcome Centre for Human Genetics, University of Oxford, Oxford OX3 7BN, UK;51Centre for Cognitive Ageing and Cognitive Epidemiology, The University of Edinburgh, Edinburgh EH8 9JZ, UK;52Medical Genetics Section, University of Edinburgh Centre for Genomic and Experimental Medicine and MRC Institute of Genetics and Molecular Medicine, The University of Edinburgh, Edinburgh EH4 2XU, UK;53Postgraduate Program in Epidemiology, Federal University of Pelotas, Pelotas, RS 96020220, Brazil;54Lab Genetics and Molecular Cardiology, Department of Cardiology, Heart Institute, University of Sao Paulo, Sao Paulo, Brazil;55Department of Biostatistics and Center for Statistical Genetics, University of Michigan, Ann Arbor, MI 48109, USA; 56Department of Clinical Physiology, Faculty of Medicine and Life Sciences, University of Tampere, Tampere 33014, Finland;57Department of Clinical Physiology, Tampere University Hospital, Tampere, Finland;58Department of Public Health, University of Kelaniya, Ragama, Sri Lanka;59Research Unit of Molecular Epidemiology, Helmholtz Zentrum Mu¨nchen, German Research Center for Environmental Health, Neuherberg 85764, Germany;60Institute of Epidemiology II, Helmholtz Zentrum Mu¨nchen, German Research Center for Environmental Health, Neuherberg 85764, Germany;61Institute of Envi-ronmental Medicine, Karolinska Institutet, Stockholm 17177, Sweden;62Department of Medical Research, Taichung Veterans General Hospital, Depart-ment of Social Work, Tunghai University, Taichung 40705, Taiwan;63Department of Opthalmology, Taichung Veterans General Hospital, Taichung 40705, Taiwan;64MRC Epidemiology Unit, University of Cambridge, Cambridge CB2 0QQ, UK;65Tropical Metabolism Research Unit, Tropical Medicine Research Institute, University of the West Indies, Mona JMAAW15, Jamaica;66Department of Occupational and Environmental Health and State Key Lab-oratory of Environmental Health for Incubating, School of Public Health, Tongji Medical College Huazhong University of Science and Technology, Wuhan, China;67Department of Cardiovascular Sciences, University of Leicester, Leicester LE3 9QP, UK;68NIHR Leicester Cardiovascular Biomedical Research Unit, Glenfield Hospital, Leicester LE3 9QP, UK;69Foundation for Research in Health Exercise and Nutrition, Kuopio Research Institute of Exercise Medicine, Kuopio 70100, Finland;70Taub Institute for Research on Alzheimer disease and the Aging Brain, Department of Epidemiology, Columbia University Mailman School of Public Health, New York, NY 10032, USA;71Endocrinology and Metabolism, Department of Internal Medicine, Taichung Veterans Gen-eral Hospital, Taichung 40705, Taiwan;72School of Medicine, National Yang-ming University, Taipei, Taiwan;73School of Medicine, National Defense Med-ical Center, Taipei, Taiwan;74Institute of Medical Technology, National Chung-Hsing University, Taichung 40705, Taiwan;75Institute of Clinical Medicine, Internal Medicine, University of Eastern Finland, Kuopio 70210, Finland;76Department of Gene Diagnostics and Therapeutics, Research Institute, National Center for Global Health and Medicine, Tokyo 1628655, Japan;77Genetic and Molecular Epidemiology Unit, Department of Clinical Sciences, Lund Uni-versity, Malmo¨, Ska˚ne 205 02, Sweden;78Department of Epidemiology and Biostatistics, Case Western Reserve University, Cleveland, OH 44106, USA; 79Institute for Social Research, Research Center for Group Dynamics, University of Michigan, Ann Arbor, MI 48104, USA;80Interfaculty Institute for Ge-netics and Functional Genomics, University Medicine and Ernst-Moritz Arndt University Greifswald, Greifswald 17487, Germany;81DZHK (German Cen-ter for Cardiovascular Research), partner site Greifswald, Greifswald 17475, Germany;82Division of Epidemiology, Department of Medicine, Vanderbilt University School of Medicine, Nashville, TN 37203, USA;83General Internal Medicine, GeneSTAR Research Program, Department of Medicine, Johns Hop-kins University School of Medicine, Baltimore, MD 21287, USA;84Department of Epidemiology and Biostatistics, Imperial College London, London W2 1PG, UK;85Department of Cardiology, Ealing Hospital, Middlesex UB1 3HW, UK;86McKusick-Nathans Institute of Genetic Medicine, Johns Hopkins Uni-versity School of Medicine, Baltimore, MD 21205, USA;87Departments of Medicine and Epidemiology, Columbia University Medical Center, New York, NY
(Affiliations continued on next page)
Bruna Gigante,61Misa Graff,9C. Charles Gu,1Dongfeng Gu,112Preeti Gupta,11Saskia P. Hagenaars,51,113 Tamara B. Harris,114Jiang He,115,116Sami Heikkinen,117Chew-Kiat Heng,118,119Makoto Hirata,120 Albert Hofman,15Barbara V. Howard,121,122Steven Hunt,123,124Marguerite R. Irvin,23Yucheng Jia,8 Roby Joehanes,125,126Anne E. Justice,9Tomohiro Katsuya,127,128Joel Kaufman,129Nicola D. Kerrison,64 Chiea Chuen Khor,27,130Woon-Puay Koh,44,131Heikki A. Koistinen,132,133Pirjo Komulainen,69
Charles Kooperberg,134Jose E. Krieger,54Michiaki Kubo,135Johanna Kuusisto,136Carl D. Langefeld,28 Claudia Langenberg,64Lenore J. Launer,114Benjamin Lehne,84Cora E. Lewis,137Yize Li,1Lifelines Cohort Study,138Sing Hui Lim,11Shiow Lin,6Ching-Ti Liu,38Jianjun Liu,14,27Jingmin Liu,139Kiang Liu,140 Yeheng Liu,8Marie Loh,84,141Kurt K. Lohman,28Jirong Long,82Tin Louie,40Reedik Ma¨gi,41
Anubha Mahajan,50Thomas Meitinger,142,143Andres Metspalu,41Lili Milani,41Yukihide Momozawa,144 Andrew P. Morris,50,145Thomas H. Mosley, Jr.,146Peter Munson,147Alison D. Murray,148Mike A. Nalls,149,150 Ubaydah Nasri,8Jill M. Norris,151Kari North,9Adesola Ogunniyi,152Sandosh Padmanabhan,153
Walter R. Palmas,154Nicholette D. Palmer,155James S. Pankow,156Nancy L. Pedersen,45Annette Peters,60,157 Patricia A. Peyser,37Ozren Polasek,158Olli T. Raitakari,159,160Frida Renstro¨m,77,161Treva K. Rice,1
Paul M. Ridker,48Antonietta Robino,162Jennifer G. Robinson,163Lynda M. Rose,48Igor Rudan,164 Charumathi Sabanayagam,11,12Babatunde L. Salako,152Kevin Sandow,8Carsten O. Schmidt,81,165 Pamela J. Schreiner,156William R. Scott,84,166Sudha Seshadri,126,167Peter Sever,168Colleen M. Sitlani,90
10032, USA;88Human Genetics Center, The University of Texas School of Public Health, Houston, TX 77030, USA;89Institute of Molecular Medicine, The University of Texas Health Science Center, Houston, TX 77030, USA;90Cardiovascular Health Research Unit, Medicine, University of Washington, Seattle, WA 98101, USA;91Section of Genomic Pediatrics, Department of Pediatrics, Medicine and Physiology, Medical College of Wisconsin, Milwaukee, WI 53226, USA;92Sleep Medicine and Circadian Disorders, Brigham and Women’s Hospital, Boston, MA 02115, USA;93Centre for Genomic & Experimental Medicine, Institute of Genetics & Molecular Medicine, University of Edinburgh, Edinburgh EH4 2XU, UK;94Center for Complex Disease Genomics, McKusick-Nathans Institute of Genetic Medicine, Johns Hopkins University School of Medicine, Baltimore, MD 21205, USA;95Centre for Brain Research, Indian Institute of Schience, Bangalore 560012, India;96The Danish Aging Research Center, Institute of Public Health, University of Southern Denmark, Odense, Denmark;97Medical Genomics and Metabolic Genetics Branch, National Human Genome Research Institute, NIH, Bethesda, MD 20892, USA; 98Ninewells Hospital & Medical School, University of Dundee, Dundee DD1 9SY, UK;99Department of Clinical Epidemiology, Leiden University Medical Center, Leiden 2300RC, the Netherlands;100Department of Medicine, University of Kelaniya, Ragama, Sri Lanka;101Inserm U1219 Neuroepidemiology, University of Bordeaux, Bordeaux, France;102Department of Neurology, University Hospital, Bordeaux, France;103Boston University School of Medicine, Boston, MA 02118, USA;104Department of Internal Medicine B, University Medicine Greifswald, Greifswald 17475, Germany;105Department of Genetics, University of North Carolina, Chapel Hill, NC 27514, USA;106Department of Family Medicine and Epidemiology, Alpert Medical School of Brown Univer-sity, Providence, RI 02860, USA;107Division of Cardiology, Department of Specialties of Medicine, Geneva University Hospital, Geneva 1211, Switzerland; 108Department of Hygiene and Epidemiology, University of Ioannina Medical School, Ioannina 45110, Greece;109Institute for Social Research, Survey Research Center, University of Michigan, Ann Arbor, MI 48104, USA;110Braun School of Public Health, Hebrew University-Hadassah Medical Center, Je-rusalem 91120, Israel;111MRC-PHE Centre for Environment and Health, Department of Epidemiology & Biostatistics, School of Public Health, Imperial College London, London, UK;112Department of Epidemiology, State Key Laboratory of Cardiovascular Disease, Fuwai Hospital, National Center for Car-diovascular Diseases, Chinese Academy of Medical Sciences and Peking Union Medical College, Beijing, China;113Department of Psychology, The Univer-sity of Edinburgh, Edinburgh EH8 9JZ, UK;114Laboratory of Epidemiology and Population Sciences, National Institute on Aging, NIH, Bethesda, MD 20892, USA;115Department of Epidemiology, Tulane University School of Public Health and Tropical Medicine, New Orleans, LA 70112, USA;116Department of Medicine, Tulane University School of Medicine, New Orleans, LA 70112, USA;117University of Eastern Finland, Institute of Biomedicine, Kuopio 70211, Finland;118Department of Paediatrics, Yong Loo Lin School of Medicine, National University of Singapore, Singapore 119228, Singapore;119Khoo Teck Puat – National University Children’s Medical Institute, National University Health System, Singapore 119228, Singapore;120Laboratory of Genome Tech-nology, Human Genome Center, Institute of Medical Science, The University of Tokyo, Minato-ku 108-8639, Japan;121MedStar Health Research Institute, Hyattsville, MD 20782, USA;122Center for Clinical and Translational Sciences and Department of Medicine, Georgetown-Howard Universities, Washing-ton, DC 20057, USA;123Cardiovascular Genetics, Department of Internal Medicine, University of Utah, Salt Lake City, UT 84108, USA;124Weill Cornell Medicine in Qatar, Doha, Qatar;125Hebrew SeniorLife, Beth Israel Deaconess Medical Center, Harvard Medical School, Boston, MA 02131, USA; 126Framingham Heart Study, National Heart, Lung, and Blood Institute, NIH, Bethesda, MD 20982, USA;127Department of Clinical Gene Therapy, Osaka University Graduate School of Medicine, Suita 5650871, Japan;128Department of Geriatric and General Medicine, Osaka University Graduate School of Medicine, Suita 5650871, Japan;129Epidemiology, Department of Occupational and Environmental Medicine Program, University of Washington, Seattle, WA 98105, USA;130Department of Biochemistry, National University of Singapore, Singapore 117596, Singapore;131Duke-NUS Medical School, Singapore 169857, Singapore;132Department of Health, National Institute for Health and Welfare, Helsinki 00271, Finland;133Department of Medicine and Abdom-inal Center: Endocrinology, University of Helsinki and Helsinki University Central Hospital, Helsinki 00029, Finland;134Fred Hutchinson Cancer Research Center, University of Washington School of Public Health, Seattle, WA 98109, USA;135Center for Integrative Medical Sciences, RIKEN, Yokohama 230-0045, Japan;136Institute of Clinical Medicine, Internal Medicine, University of Eastern Finland and Kuopio University Hospital, Kuopio 70210, Finland; 137Department of Medicine, University of Alabama at Birmingham, Birmingham, AL 35205, USA;138Lifelines cohort study, University of Groningen, Uni-versity Medical Center Groningen, Groningen 9700 RB, the Netherlands;139WHI CCC, Fred Hutchinson Cancer Research Center, Seattle, WA 98115, USA; 140Preventive Medicine, Northwestern University Feinberg School of Medicine, Chicago, IL 60611, USA;141Translational Laboratory in Genetic Medicine, Agency for Science, Technology and Research 138648, Singapore;142Institute of Human Genetics, Helmholtz Zentrum Mu¨nchen, German Research Center for Environmental Health, Neuherberg 85764, Germany;143Institute of Human Genetics, Technische Universita¨t Mu¨nchen, Munich 80333, Germany; 144Laboratory for Genotyping Development, Center for Integrative Medical Sciences, RIKEN, Yokohama 230-0045, Japan;145Department of Biostatistics, University of Liverpool, Liverpool L69 3GL, UK;146Geriatrics, Department of Medicine, University of Mississippi Medical Center, Jackson, MS 39216, USA; 147Mathematical and Statistical Computing Laboratory, Center for Information Technology, NIH, Bethesda, MD 20892, USA;148The Institute of Medical Sciences, Aberdeen Biomedical Imaging Centre, University of Aberdeen, Aberdeen AB25 2ZD, UK;149Data Tecnica International, Glen Echo, MD 20812, USA;150Laboratory of Neurogenetics, National Institute on Aging, Bethesda, MD 20892, USA;151Department of Epidemiology, Colorado School of Public
(Affiliations continued on next page) (Author list continued on next page)
Jennifer A. Smith,37Harold Snieder,42John M. Starr,51,169Konstantin Strauch,170,171Hua Tang,172 Kent D. Taylor,8Yik Ying Teo,14,27,173,174,175Yih Chung Tham,11Andre´ G. Uitterlinden,176
Melanie Waldenberger,59,60Lihua Wang,6Ya X. Wang,177Wen Bin Wei,178Christine Williams,6 Gregory Wilson,179Mary K. Wojczynski,6Jie Yao,8Jian-Min Yuan,180,181Alan B. Zonderman,182
Diane M. Becker,83Michael Boehnke,55Donald W. Bowden,155John C. Chambers,84,85Yii-Der Ida Chen,8 Ulf de Faire,61Ian J. Deary,51,113To˜nu Esko,41,183Martin Farrall,49,50Terrence Forrester,65
Paul W. Franks,77,184,185Barry I. Freedman,186Philippe Froguel,43,187Paolo Gasparini,46,188
Christian Gieger,59,189Bernardo Lessa Horta,53Yi-Jen Hung,190Jost B. Jonas,178,191Norihiro Kato,76 Jaspal S. Kooner,85,166Markku Laakso,136Terho Lehtima¨ki,192,193Kae-Woei Liang,72,194,195
Patrik K.E. Magnusson,45Anne B. Newman,180Albertine J. Oldehinkel,196Alexandre C. Pereira,54,197 Susan Redline,92Rainer Rettig,81,198Nilesh J. Samani,67,68James Scott,166Xiao-Ou Shu,82
Pim van der Harst,199Lynne E. Wagenknecht,200Nicholas J. Wareham,64Hugh Watkins,49,50
David R. Weir,109Ananda R. Wickremasinghe,58Tangchun Wu,66Wei Zheng,82Yoichiro Kamatani,39 Cathy C. Laurie,40Claude Bouchard,31Richard S. Cooper,35Michele K. Evans,34Vilmundur Gudnason,32,33 Sharon L.R. Kardia,37Stephen B. Kritchevsky,201Daniel Levy,126,202Jeff R. O’Connell,203,204
Bruce M. Psaty,205,206Rob M. van Dam,44,207Mario Sims,17Donna K. Arnett,208
Dennis O. Mook-Kanamori,99,209Tanika N. Kelly,115Ervin R. Fox,210Caroline Hayward,16Myriam Fornage,21 Charles N. Rotimi,4Michael A. Province,6Cornelia M. van Duijn,15E. Shyong Tai,14,131,207
Health, Aurora, CO 80045, USA;152Department of Medicine, University of Ibadan, Ibadan, Nigeria;153Institute of Cardiovascular and Medical Sciences, University of Glasgow, Glasgow G12 8TA, UK;154Internal Medicine, Department of Medicine, Columbia University, New York, NY 10032, USA; 155Department of Biochemistry, Wake Forest School of Medicine, Winston-Salem, NC 27157, USA;156Division of Epidemiology and Community Health, University of Minnesota School of Public Health, Minneapolis, MN 55454, USA;157DZHK (German Centre for Cardiovascular Research), partner site Mu-nich Heart Alliance, Neuherberg 85764, Germany;158Faculty of Medicine, University of Split, Split, Croatia;159Department of Clinical Physiology and Nu-clear Medicine, Turku University Hospital, Turku 20521, Finland;160Research Centre of Applied and Preventive Cardiovascular Medicine, University of Turku, Turku 20520, Finland;161Department of Biobank Research, Umea˚ University, Umea˚, Va¨sterbotten 901 87, Sweden;162Medical Genetics, IRCCS Burlo, Garofolo 34137, Italy;163Department of Epidemiology and Medicine, University of Iowa, Iowa City, IA 52242, USA;164Usher Institute of Population Health Sciences and Informatics, University of Edinburgh, Edinburgh EH8 9AG, UK;165Institute for Community Medicine, University Medicine Greifs-wald, Greifswald 17475, Germany;166National Heart and Lung Institute, Imperial College London, London W12 0NN, UK;167Department of Neurology, Boston University School of Medicine, Boston, MA 02118, USA;168International Centre for Circulatory Health, Imperial College London, London W2 1PG, UK;169Alzheimer Scotland Dementia Research Centre, The University of Edinburgh, Edinburgh EH8 9JZ, UK;170Institute of Genetic Epidemiology, Helm-holtz Zentrum Mu¨nchen, German Research Center for Environmental Health, Neuherberg 85764, Germany;171Chair of Genetic Epidemiology, IBE, Fac-ulty of Medicine, LMU Munich, Munich 81377, Germany;172Department of Genetics, Stanford University, Stanford, CA 94305, USA;173Life Sciences Insti-tute, National University of Singapore, Singapore, Singapore 117456, Singapore;174NUS Graduate School for Integrative Science and Engineering, National University of Singapore, Singapore 117456, Singapore;175Department of Statistics and Applied Probability, National University of Singapore, Singapore 117546, Singapore;176Department of Internal Medicine, Erasmus University Medical Center, Rotterdam, the Netherlands;177Beijing Institute of Ophthal-mology, Beijing Ophthalmology and Visual Science Key Lab, Beijing Tongren Eye Center, Capital Medical University, Beijing, China 100730, China; 178Beijing Tongren Eye Center, Beijing Tongren Hospital, Capital Medical University, Beijing 100730, China;179Jackson Heart Study, Department of Public Health, Jackson State University, Jackson, MS 39213, USA;180Department of Epidemiology, Graduate School of Public Health, University of Pittsburgh, Pittsburgh, PA 15261, USA;181Division of Cancer Control and Population Sciences, University of Pittsburgh Cancer Institute, Pittsburgh, PA 15232, USA;182Behavioral Epidemiology Section, Laboratory of Epidemiology and Population Sciences, National Institute on Aging, NIH, Baltimore, MD 21224, USA;183Broad Institute of the Massachusetts Institute of Technology and Harvard University, Boston, MA 02142, USA;184Harvard T.H. Chan School of Public Health, Department of Nutrition, Harvard University, Boston, MA 02115, USA;185Department of Public Health & Clinical Medicine, Umea˚ Uni-versity, Umea˚, Va¨sterbotten 901 85, Sweden;186Division of Nephrology, Department of Internal Medicine, Wake Forest School of Medicine, Winston-Salem, NC 27157, USA;187Department of Genomics of Common Disease, Imperial College London, London W12 0NN, UK;188Division Experimental Genetics, Sidra, Doha 26999, Qatar;189German Center for Diabetes Research (DZD e.V.), Neuherberg 85764, Germany;190Endocrinology and Metabolism, Tri-Service General Hospital, National Defense Medical Center, Taipei City, Taipei 11490, Taiwan;191Department of Ophthalmology, Medical Faculty Man-nheim, University Heidelberg, Mannheim 68167, Germany;192Department of Clinical Chemistry, Fimlab Laboratories, Tampere 33520, Finland; 193Department of Clinical Chemistry, Finnish Cardiovascular Research Center - Tampere, Faculty of Medicine and Lifes Sciences, University of Tampere, Tampere 33014, Finland;194Cardiovascular Center, Taichung Veterans General Hospital, Taichung 40705, Taiwan;195Department of Medicine, China Med-ical University, Taichung 40705, Taiwan;196Department of Psychiatry, University of Groningen, University Medical Center Groningen, Groningen 9700 RB, the Netherlands;197Genetics, Harvard Medical School, Boston, MA 02115, USA;198Institute of Physiology, University Medicine Greifswald, Greifswald 17495, Germany;199Department of Cardiology, University of Groningen, University Medical Center Groningen, Groningen 9700 RB, the Netherlands; 200Department of Public Health Sciences, Wake Forest School of Medicine, Winston-Salem, NC 27157, USA;201Sticht Center for Health Aging and Alz-heimer’s Prevention, Department of Internal Medicine, Wake Forest School of Medicine, Winston-Salem, NC 27157, USA;202Population Sciences Branch, Division of Intramural Research, National Heart, Lung, and Blood Institute, NIH, Bethesda, MD 20892, USA;203Division of Endocrinology, Diabetes, and Nutrition, University of Maryland School of Medicine, Baltimore, MD 21201, USA;204Program for Personalized and Genomic Medicine, University of Mary-land School of Medicine, Baltimore, MD 21201, USA;205Cardiovascular Health Research Unit, Epidemiology, Medicine and Health Services, University of Washington, Seattle, WA 98101, USA;206Kaiser Permanente Washington, Health Research Institute, Seattle, WA 98101, USA;207Department of Medicine, Yong Loo Lin School of Medicine, National University of Singapore, Singapore 119228, Singapore;208Dean’s Office, University of Kentucky College of Pub-lic Health, Lexington, KY 40536, USA;209Department of Public Health and Primary Care, Leiden University Medical Center, Leiden 2300RC, the Netherlands;210Cardiology, Department of Medicine, University of Mississippi Medical Center, Jackson, MS 39216, USA;211Icahn School of Medicine at Mount Sinai, The Mindich Child Health and Development Institute, New York, NY 10029, USA;212Genomic Outcomes, Department of Medicine, LABioMed at Harbor-UCLA Medical Center, Torrance, CA 90502, USA;213Department of Psychiatry, Washington University School of Medicine, St. Louis,
(Affiliations continued on next page) (Author list continued on next page)
initially identified through three collaborative consortia for genome-wide BP genetics in people of European ancestry1,3,4 explain less than 2.5% of the variance in systolic BP (SBP) or diastolic BP (DBP).4 Recent reports based on larger sample sizes have increased the number of BP-associated variants which together explain about 3.5% of BP variance.5–7 In contrast, only six BP loci have been identified by GWASs in African ancestry which explain less than 0.54% of BP variance.8,9 A focus on main effects to the exclusion of interactions in these studies may have limited the discovery of a full complement of genetic influences on BP. In particular, incorporating interactions between genetic variants and environmental exposures (GxE) represents an additional route for discovery of genetic effects on complex traits,10 including BP, and may more generally extend our knowledge of the genetic architecture of complex traits.11
Many lifestyle factors including physical activity, tobacco use, alcohol consumption, stress, and dietary fac-tors influence BP.12 These lifestyle exposures may also modify the effect of genetic variants on BP. Cigarette smoking is known to influence BP in both acute13 and chronic14,15 fashion, motivating genetic association studies accounting for potential gene-by-smoking interac-tions. This may help identify BP loci, and such BP loci driven by GxE interactions may reveal new biological in-sights and mechanisms that can be explored for treatment or prevention of hypertension.
The recently established Gene-Lifestyle Interactions Working Group within the Cohorts for Heart and Aging Research in Genomic Epidemiology (CHARGE) Con-sortium has designed a series of multi-ancestry genome-wide interaction projects focused on assessing the impact of interactions with multiple lifestyle factors on the genetics of cardiovascular traits.16 The primary goal of these investigations is to use interactions to identify trait loci that act synergistically with lifestyle factors. Large-scale interaction studies like this one represent ‘‘an important milestone on the path toward a far more complete understanding of the origins of cardio-vascular disease and a better understanding of how to manage it.’’17 Within this setting, we performed a
genome-wide association meta-analysis incorporating
gene-smoking interactions (overview shown in Figure 1) to identify SBP- and DBP-associated loci and under-stand the modulating role of cigarette smoking in the genetic architecture of BP. Here we report our findings based on a total of 610,091 individuals from five ancestry groups which provide adequate power for discovery.16
Material and Methods
Overview of Participating Studies
Men and women between the ages of 18 and 80 years from five self-reported ancestry groups are represented in this study: Euro-pean (EUR), African (AFR), Asian (ASN), Hispanic (HIS), and Brazilian admixed (BRA). These participating studies are described in theSupplemental Note. Each study obtained informed consent from participants and approval from the appropriate institutional review boards. Although the participating studies are based on different study designs and populations, all of them have data on BP, smoking, and genotypes across the genome (data imputed using the 1000 Genomes reference panel in most cohorts). In total, this study involves two stages comprising 610,091 individuals.
A total of 48 cohorts participated in stage 1 and performed genome-wide interaction analyses (Table S1). This stage included 80,552 EUR, 27,118 AFR, 13,438 ASN, and 8,805 HIS for an overall total of 129,913 individuals. A total of 76 cohorts participated in stage 2 and performed analyses of 4,459 variants that were identified in stage 1 as either genome-wide signifi-cant (p < 5 3 108) or suggestive (p < 106) for any of the
BP-smoking combinations for either 1 df or 2 df tests (Table S2). This stage included 305,513 EUR, 7,786 AFR, 148,932 ASN, 13,533 HIS, and 4,414 Brazilian admixed (BRA) individuals to a total of 480,178 individuals in stage 2. Since discoveries to date are largely from EUR populations, we optimized the chances of discovery in non-EUR populations (especially in AFR) by recruiting most of the available non-EUR cohorts into stage 1.
Phenotypes and Lifestyle Variables
The two BP traits, resting SBP (mmHg) and DBP (mmHg), were analyzed separately. For individuals taking any anti-hypertensive (BP-lowering) medications, their SBP and DBP values were first adjusted for medication effects by adding 15 mmHg to SBP and adding 10 mmHg to DBP.3 Summary statistics are shown in Table 1 (more details in Tables S3 and S4). These Tien Yin Wong,11,12,13Ruth J.F. Loos,10,211Alex P. Reiner,134Jerome I. Rotter,8,212Xiaofeng Zhu,78
Laura J. Bierut,213W. James Gauderman,214Mark J. Caulfield,7,36,217Paul Elliott,84,111,217Kenneth Rice,40,217 Patricia B. Munroe,7,215,217Alanna C. Morrison,5,217L. Adrienne Cupples,38,126,217Dabeeru C. Rao,1,217 and Daniel I. Chasman48,217,*
MO 63110, USA;214Division of Biostatistics, Department of Preventive Medicine, University of Southern California, Los Angeles, CA 90032, USA;215NIHR Barts Cardiovascular Biomedical Research Unit, Queen Mary University of London, London EC1M 6BQ, UK
216These authors contributed equally to this work 217These authors contributed equally to this work
*Correspondence:[email protected](Y.J.S.),[email protected](D.I.C.)
https://doi.org/10.1016/j.ajhg.2018.01.015.
medication-adjusted BP variables were approximately normally distributed, as shown inTable S5andFigure S1. In addition, to reduce the influence of possible outliers, winsorizing has been applied for each BP value that was more than six standard devia-tions away from the mean.
The participating cohorts have varying levels of information on smoking, some with a simple binary variable and others (such as UK Biobank) with more precise data. We considered two dichotomized smoking variables, ‘‘current smoking’’ status (CurSmk) and ‘‘ever smoking’’ status (EverSmk), as they were the most widely available information (Table 1). Current smoking status was coded as 1 if the subject smoked regularly in past year (and as 0 for non-current smokers, which includes both never and former smokers). Ever smoking status was coded as 1 if the subject smoked at least 100 cigarettes during his/her life-time (and as 0 for the never-smokers). Smoking status was assessed at the time of the BP measurements. When subjects had multiple smoking measures that were inconsistent, they were excluded from analysis. Subjects with missing data for BP, the smoking variable, or any covariates were excluded from analysis.
Genotype Data
Genotyping was performed using Illumina or Affymetrix genotyp-ing arrays. Each study performed imputation to impute genotypes for SNPs, short insertions and deletions (indels), and larger deletions that were not genotyped directly but are available from the 1000 Genomes Project.18 Information on genotype and imputation for each study is presented inTables S6andS7. For imputation, most studies used the 1000 Genomes Project Phase I Integrated Release Version 3 Haplotypes (2010-11 data freeze, 2012-03-14 haplotypes), which contain haplotypes of 1,092 indi-viduals of all ethnic backgrounds.
Figure 1. Study Design and Overall
Workflow
Stage 1 analysis identified 74 significant novel loci, of which 15 were replicated in stage 2. Replication in stage 2 was hampered by limited sample sizes for Afri-can and Hispanic ancestries. Combined analysis leverages the full power of stages 1 and 2, identifying 66 additional BP loci missed by the 2-step approach which were validated by FDR. Association ana-lyses were performed for each of SBP and DBP, accounting for two smoking exposure variables, ‘‘current smoking’’ status (CurSmk) and ‘‘ever smoking’’ status (EverSmk). For each ancestry, cohort-spe-cific results were combined to perform the 1 degree of freedom (df) test of the interaction effect and the 2 df joint test of genetic main and interaction effects.
Cohort-Specific GWAS Analysis For SBP and DBP separately, each study performed association analyses account-ing for two smokaccount-ing exposure variables, current smoking (CurSmk) and ever smok-ing (EverSmk). In stage 1, we considered two models to account for gene-smoking interactions. For the first ‘‘joint’’ model, a regression model including both genetic main and GxE interaction effects,
E½YjG;C ¼ b0þ bESmk þ bGGþ bGESmkGþbCC
was applied to the entire sample. For the second ‘‘stratified’’ model, analyses of the genetic main-effect regression models
E½YjC;Smk¼0 ¼ gð0Þ
0 þg
ð0Þ GGþg
ð0Þ
CC
E½YjC;Smk¼1 ¼gð01Þþg
ð1Þ GGþg
ð1Þ
CC
were applied separately to the Smk¼0 unexposed group and to the Smk ¼ 1 exposed group (smokers). Y is the medication-adjusted BP value, Smk is the smoking variable (with 0/1 coding for the absence/presence of the smoking exposure),Gis the dosage of the imputed genetic variant coded additively (from 0 to 2), and C is the vector of all other covariates, which include age, sex, field center (for multi-center studies), and principal compo-nent (PC) (to account for population stratification and admixture). No additional cohort-specific covariates were included. Our previ-ous work showed that the two (joint and stratified) models pro-vided highly similar inference.19Therefore, we considered only the first ‘‘joint’’ model in stage 2.
Each study in stage 1 performed GWAS analysis within each ancestry and provided (1) the estimated genetic main effectbG,
estimated interaction effectbGE, and a robust estimate of the
cor-responding covariance matrix under the joint model; and (2) esti-mates of the stratum-specific effectsgð0ÞG ;g
ð1Þ
G and robust estimates
of their standard errors (SE) under the stratified model. Each study in stage 2 provided estimates of the genetic main effectbG, the
interaction effectbGE, and robust estimates of the corresponding
covariance matrix under the joint model at 4,459 select variants. Robust estimates of covariance matrices and SEs were used to
safeguard against both mis-specification of the mean model and violation of the assumption of constant BP variance across smok-ing groups (heteroscedasticity).20,21Association analysis was per-formed using various software (Tables S6andS7). To obtain robust estimates of covariance matrices and robust SEs, studies of unrelated subjects used either the R package sandwich22 or ProbABEL.23To account for relatedness in families, family studies used either the generalized estimating equations (GEE) approach, treating each family as a cluster, or the linear mixed effect model approach with a random polygenic component (for which the covariance matrix depends on the kinship matrix).
Quality Control
Study investigators participating in this study have ample experi-ence in main-effect-based GWASs for multiple phenotypes and are very familiar with validated approaches for quality control (QC) of phenotype, genotype, and imputed data. For example, cohort-level analyses used PCs as covariates to deal with population struc-ture; family studies used suitable software packages to deal with relatedness (Table S6). Overlap among some of the participating cohorts is a potential possibility. However, when there was known overlap of samples across cohorts, one of the cohorts used a non-overlapping sub-sample for their analysis.
We performed extensive QC using the R package EasyQC24for all cohort-specific GWAS results. In stage 1, each cohort provided 12 GWAS result files (2 BPs32 smoking exposures33 analyses, 1 for model 1 and 2 for model 2) for each ancestry group. Each GWAS result file included approximately 8–15 million high-qual-ity variants (depending on ancestry), as cohorts applied a prelim-inary filter on their imputed data excluding variants with minor allele frequency (MAF)<1% or imputation quality measure< 0.1. We performed two QC levels: ‘‘study-level’’ and ‘‘meta-level.’’ To identify problems with population substructures or relatedness, we have examined QQ plots and genomic control inflation factors
(lambdas) on a study-by-study level (to identify study-specific issues) as well as on the meta-analysis result (to identify cross-study issues). Because GWASs were performed within each ancestry, the ‘‘study-level’’ QC also carefully checked the provided allele frequencies against the retrospective ancestry-specific 1000 Genomes reference panel. Finally, marker names were harmonized to ensure consistencies across cohorts. In addition, we contrasted results from the joint model and stratified models in stage 1 co-horts, as explained elsewhere.19 The ‘‘meta-level’’ QC reviewed result files of a specific analysis (e.g., SBP-CurSmk-Model1) across all cohorts: this included (1) visually comparing summary statis-tics (mean, median, standard deviation, inter-quartile range, min-imum, maximum) on all effect estimates standard errors (SEs) and p values and (2) examining SE-N and QQ plots to reveal issues with trait transformation24or other analytical problems. Any problems found during QC steps, including major differences from the ancestry-specific reference panel and any inflation of lambdas within studies, were communicated and resolved with the individ-ual cohorts. Similar QC steps were applied to cohort-specific re-sults in stage 2. More detailed information about the QC steps, including major QC problems encountered and how they were resolved, are described elsewhere.16
The most crucial filter during the meta-analysis was approxi-mate df ¼ min (MAC0, MAC1) * imputation quality measure; this is based on the minor allele count (MAC) in each stratum (MAC0 and MAC1) and imputation quality measure, where MAC0¼2 * MAFE0* NE0for the unexposed group (with MAFE0
and sample size NE0for E¼0 stratum) and MAC1¼2 * MAFE1*
NE1for the exposed group. In meta-analysis, to exclude unstable
cohort-specific results that reflect small sample size, low MAF, or low imputation quality measures, variants were excluded if approximate df<20. This filtering threshold was decided after considering various thresholds and examining the resulting QQ and Manhattan plots. More details are provided in the Supple-mental Note. Variants were further excluded if imputation quality Table 1. Basic Characteristics of Cohorts in Stages 1 and 2 in Each Ancestry
Current Smoker Former Smoker Never Smoker
% Male % HT % HT Meds
Age SBP DBP
N % N % N % Mean SD Mean SD Mean SD
Stage 1
EUR 14,607 18.1 28,409 35.3 37,535 46.6 32.6 38.2 25.4 54.63 8.0 129.31 19.2 77.29 11.2
AFR 5,545 21.5 7,185 27.8 13,121 50.8 26.5 55.9 39.5 54.49 9.1 136.39 22.8 81.75 12.8
ASN 2,465 18.3 1,677 12.5 9,296 69.2 51.2 46.9 27.0 55.42 9.7 137.29 21.5 79.41 11.1
HIS 1,068 12.1 2,160 24.5 5,577 63.3 24.9 43.5 13.3 55.50 11.0 130.50 22.0 76.95 11.8
Stage 1 Total 23,685 18.4 39,431 30.7 65,529 50.9 32.8 43.1 27.7 54.74 8.6 131.69 20.4 78.42 11.6
Stage 2
EUR 48,198 17.0 89,597 31.6 145,914 51.4 47.8 44.8 25.0 55.91 8.6 139.02 20.4 83.76 11.5
AFR 1,971 29.8 1,579 23.8 3,075 46.4 40.9 54.3 42.8 53.66 10.2 137.00 21.6 83.32 12.8
ASN 29,485 19.8 40,850 27.4 78,597 52.8 54.9 50.3 33.1 60.76 12.3 134.92 20.2 80.01 12.3
HIS 2,739 20.3 2,559 18.9 8,231 60.8 41.0 26.9 16.3 45.86 13.8 124.08 20.0 75.09 11.9
BRZ 998 22.6 514 11.6 2,902 65.8 48.0 15.5 6.3 27.78 3.2 119.91 16.0 74.68 11.5
Stage 2 Total 83,391 18.2 135,099 29.6 238,719 52.2 49.7 45.9 27.4 56.84 9.9 137.12 20.3 82.26 11.8
TOTAL 107,076 18.3 174,530 29.8 304,248 51.9 46.1 45.3 27.4 56.40 9.6 135.96 20.3 81.44 11.7
The cell entries for the covariates and BP traits correspond to sample-size weighted averages across all cohorts in each category.
measure<0.5. This value of 0.5 was used regardless of the software used for imputation, because imputation quality measures are shown to be similar across imputation software.25
Meta-analysis
After conducting extensive quality control and selecting high-quality variants, approximately 18.8 million SNPs and small insertion and deletion (indels) variants were included in the meta-analysis (the number of variants varied across the ancestry groups). We performed meta-analysis using both models in stage 1 and using the joint model in stage 2. For both stages, we per-formed meta-analysis using the 1 degree of freedom (df) test of interaction effect and 2 df tests of testing both SNP main and inter-action effects. Wald test statistics approximately follow either a chi-square distribution with 1 df under H0:bGE¼0 for the 1 df
test or a chi-square distribution with 2 df under H0: bG ¼ bGE ¼0, for the 2 df test. In the joint model, inverse-variance
weighted meta-analysis was performed for the 1 df test and the joint meta-analysis of Manning et al.26for the 2 df test, both using METAL.27In the stratified model, we performed meta-analysis us-ing the approach of Randall et al.28 for the 1 df test and the approach of Aschard et al.29for the 2 df test. Both tests in the strat-ified model were computed using the R package EasyStrata.30More details are described elsewhere.19
Ancestry-specific meta-analyses using inverse-variance weight-ing were performed to combine cohort-specific results within each ancestry. The ancestry-specific results were then combined through meta-analysis to obtain evidence of ‘‘trans-ancestry’’ asso-ciation. In stage 1, 80 separate genome-wide meta-analyses were performed: 2 BPs32 smoking exposures34 (2 tests in the joint model, 2 stratified groups in the stratified model)35 ancestries (4 specific and 1 trans-ancestry to combine ancestry-specific results). In this stage, genomic control correction31was applied twice, first for cohort-specific GWAS results if their genomic control lambda value was greater than 1, and again after the meta-analysis results. Variants were excluded if they were represented by valid data in fewer than 5,000 samples and 3 cohorts. Variants that were genome-wide significant (p<53 108) or suggestive (p < 13 106) in any of stage 1 analyses
were pursued for stage 2 analysis. In stage 2, 48 separate meta-analyses were performed using the joint model: 2 BPs32 smoking exposures 3 2 (2 tests; 1 df and 2 df tests) 3 6 ancestries (5 ancestry-specific and 1 trans-ancestry to combine ancestry-spe-cific results). Genomic control correction was not applied to the replication statistics as association analysis was performed only at select variants. Similarly, 48 separate meta-analyses were per-formed to combine stages 1 and 2 results.
Genome-wide Significant Variants
If a variant reached genome-wide significance (p< 5 3108)
through any of these 48 combined association meta-analyses (which are not independent), then the variant was considered as genome-wide significant. To identify a set of independent (index) variants through ancestry-specific and trans-ancestry analysis, we performed the linkage disequilibrium (LD)-based clumping procedure using PLINK32 and EasyStrata.30 A locus is defined through LD-based clumping that uses both physical distance (51 Mb) and LD threshold of r2>
0.1. Since valid methods do not exist for conditional analysis involving interactions across multi-ancestry studies, we relied on a relatively more stringent LD threshold (r2 > 0.1) for identifying ‘‘independent’’ loci. As
LD reference, ancestry-specific 1000 Genomes Project data were used for ancestry-specific results and the entire cosmopolitan data-set was used for trans-ancestry results. False discovery rate (FDR) q-values were computed using the R function p.adjust using the step-up method by Benjamini and Hochberg.33
BP Variance Explained
Since variants weakly correlated with index variants (0.1%r2%
0.2) can contribute to the percent variance, for the purposes of calculating percent variance, we carried out clumping using slightly less conservative LD threshold (r2 > 0.2 instead of>0.1). The percent of variance explained in SBP and DBP by all previously known (158) and newly identified (132 using LD threshold of>0.2 for clumping) variants was evaluated in several studies from multiple ancestries (seeTable S8). BP variants previ-ously identified in any ancestry were considered as ‘‘known’’ vari-ants. Similarly, we considered all index variants representing previously unreported loci as ‘‘novel’’ for this purpose regardless of which ancestry they were identified in; separate interaction terms were included for newly identified variants. Known and newly identified variants (combined from all ancestries) were used in assessing the percent variance.
Percent variance was calculated using standard regression models. Four nested models were considered. The first model included the smoking variables and standard covariates (age, sex, PCs, etc.); the second model included those covariates and all known variants; the third model contained all those previous variables and all newly identified variants (excluding any interac-tion terms); finally, the fourth model contained all those (covari-ates, known, and novel) plus the interaction terms. Each of SBP and DBP was regressed on the relevant predictors in each of the four models. The r2values obtained from the regressions were used as measures of the percent variance explained by the respec-tive models. Through sequential subtraction of appropriate r2 values, we determined the ‘‘additional’’ percent variance explained by a given set of variants. For studies with N<20,000, we used a stepwise regression procedure with significance tests for inclusion of one variant at a time and for backward elimination of redun-dant variants.
Functional Inference
Variant Effect Predictor (VEP) from Ensembl was used to obtain the gene name for each locus. For the variants whose gene names were not identified by VEP, NCBI SNP database was used to obtain the closest gene. We applied several computational strate-gies to infer biological functions associated with our newly iden-tified loci. We used HaploReg, RegulomeDB, and GTEx34 to obtain annotations of the noncoding genome, chromatin state, and protein binding annotation from the Roadmap Epigenomics and ENCODE projects, sequence conservation across mammals, and the effect of SNPs on expression from eQTL studies. To further assess putative functionality for the new loci, we searched for cis associations between new variants and gene transcripts using previously published eQTL analyses, which includes the GTEx.34
Further eQTL evidence was queried using the eQTL database of Joehanes et al.35for transcripts associated in bothcisandtransin more than 5,000 individuals from the Framingham Heart Study, with genome-wide false discovery rate (FDR)<0.05. Two gene-set enrichment analysis (GSEA) queries were then performed on December 23, 2016 to determine the enrichment of biological
processes and disease pathways of the resulting transcripts. Prior to the queries, duplicated gene names and genes with provi-sional names (such as LOCXXX) were removed. Then, for each transcript probe associated with more than one gene name, only the first gene name was taken. This process yielded 127 gene names for the GSEA query. For querying biological processes, option C5:BP was selected on the GSEA website. For querying dis-ease pathway, option C2:CP was selected. Both GSEA queries were set at FDR<0.05 threshold to guard against multiple comparison errors.
Pathway and Gene Set Enrichment Analysis
We conducted four separate DEPICT analyses based on the following criteria that were applied to our combined association meta-analysis results. We utilized variants showing genome-wide significant joint effect association with (1) SBP in Europeans (PEUR.SBP < 5 3 108), (2) DBP in Europeans (PEUR.DBP< 53
108), (3) SBP in trans-ancestry analysis (P
Trans.SBP<53108),
or (4) DBP intrans-ancestry analysis (PTrans.DBP<53108). For
each combination, DEPICT first performed the following steps to obtain the input of the prioritization and enrichment analyses: non-overlapping regions lists of independent variants were ob-tained using 500 kb flanking regions and LD r2>0.1 using the
1000 Genomes data,18 resulting variants were merged with overlapping genes (r2 > 0.5 with a functional coding variant
within the gene orcis-acting regulatory variant), and the major histocompatibility complex region on chromosome 6 (base posi-tion 25,000,000–35,000,000) was excluded.
DEPICT prioritized genes at the associated loci based on their functional similarity. Functional similarity of genes across associ-ated loci was quantified by computing a gene score that was adjusted for bias through confounders such as gene length. Experiment-wide FDR for the gene prioritization was obtained by repeating the scoring step 50 times based on lead variants from 500 pre-compiled null GWASs. For the gene-set enrichment analyses, DEPICT utilized a total of 14,461 pre-compiled reconsti-tuted gene sets comprising 737 Reactome database pathways, 2,473 phenotypic gene sets (derived from the Mouse Genetics Initiative), 184 Kyoto Encyclopedia of Genes and Genomes (KEGG) database pathways, 5,083 Gene Ontology database terms, and 5,984 protein molecular pathways (derived from protein-pro-tein interactions). For the tissue and cell type enrichment ana-lyses, DEPICT tested whether genes harboring associated loci are enriched for expression in any of the 209 MeSH annotations for 37,427 microarrays of the Affymetrix U133 Plus 2.0 Array platform.
To further identify connected gene sets and pathways impli-cated by our findings, we performed GeneGO analysis and text data mining using Literature Lab.36 GeneGO (known also as MetaCore) evaluates p values for pathways by mapping a list of target genes to each pathway and comparing those that arise by chance using a hypergeometric distribution formula. GeneGO implements a correction of p values using a false discovery rate. Literature Lab of Acumenta evaluates co-occurrences in the pub-lication records of a list of genes and biological and biochemical terms. The analysis compares the gene input set against the average of 1,000 randomly generated similar size sets, providing a spectrum of statistically significant associations. Our Literature Lab analysis included the use of 17,261,987 PubMed abstracts, out of which 10,091,778 abstracts include one or more human genes.
Results
Study Overview
We performed the traditional 2-step approach with discov-ery in stage 1 followed by formal replication in stage 2. Because this study was not optimally designed for replica-tions in non-EUR (especially in AFR) ancestry, to identify additional loci, we performed combined analysis of stages 1 and 2 to maximize power for discovery37(Figure 1). For the 2-step approach, we performed ancestry-specific meta-analysis in each of five ancestries and trans-ancestry analysis in stage 2. We checked whether each of the genome-wide significant loci in stage 1 was replicated in stage 2 using Bonferroni-adjusted significance level (0.05/ 74, see details below). For the combined analysis, we per-formed ancestry-specific meta-analysis combining both stages 1 and 2 (discovery and follow-up) in each of 5 ances-tries; these ancestry-specific meta-analyses results were then combined to perform trans-ancestry analysis at 4,459 variants using a total of up to 610,091 individuals.
Two-Step Approach of Discovery Followed by Replication
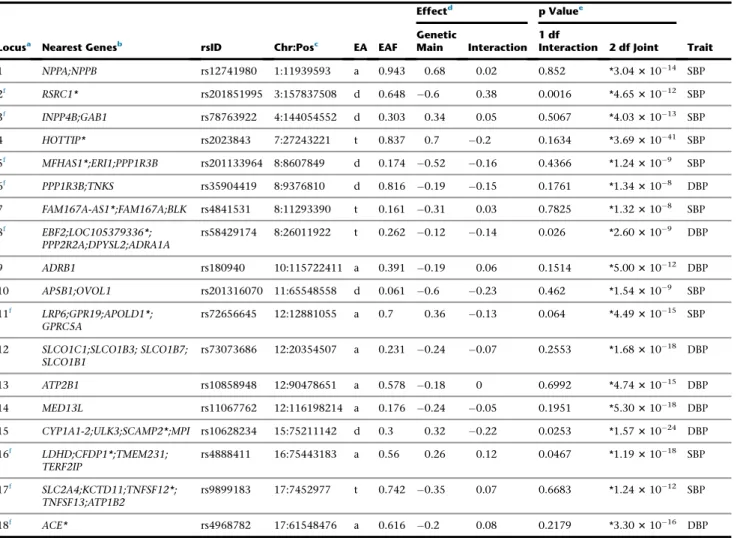
Of the 4,459 significant or suggestive variants selected from stage 1 meta-analyses, 3,222 were replicated in stage 2 with p<0.05/4,459 (to an aggregate replication rate of 72.3%). Of the 1,993 variants that were genome-wide sig-nificant (p<53108) in stage 1 analysis, 1,836 were repli-cated in stage 2 with p<0.05/1,993 to a replication rate of 92.1%. These 1,993 genome-wide significant variants in stage 1 belong to 114 independent loci. Of the 114 loci, 40 loci (consisting of 1,644 variants) contain previously published BP variants.1,3–7 Of the remaining 74 newly identified loci (consisting of 349 variants), 15 loci were formally replicated in stage 2 using Bonferroni-adjusted significance level (p < 0.05/74) (Table 2); all 15 novel loci were replicated even when using the more conserva-tive adjustment threshold p < 0.05/349. In addition, 25 more of the remaining 59 loci were nominally replicated (p < 0.05) in one or more of the analyses in stage 2 (p < 0.05), and 27 more showed the same direction of effect in stages 1 and 2. For 7 loci, no additional data were available in stage 2 and, therefore, it was not possible to check for replication. For the 15 formally replicated loci, estimates of the genetic main effects were all consistent between stages 1 and 2; estimates of SNP-smoking interac-tion effects were not statistically significant (forest plots; Figure S3). All of the 15 replicated loci were genome-wide significant in European ancestry. Further-more, 10 loci also had supporting evidence from non-Euro-pean ancestry, resulting in stronger statistical significance from trans-ancestry analysis (Figure S3, Table 2). Quan-tile-quantile (QQ) plots for the genome-wide stage 1 meta-analysis are shown inFigure S2.
Of the 15 formally replicated loci, six loci (indicated by f
in Table 2) are least 1 Mb away from any previously
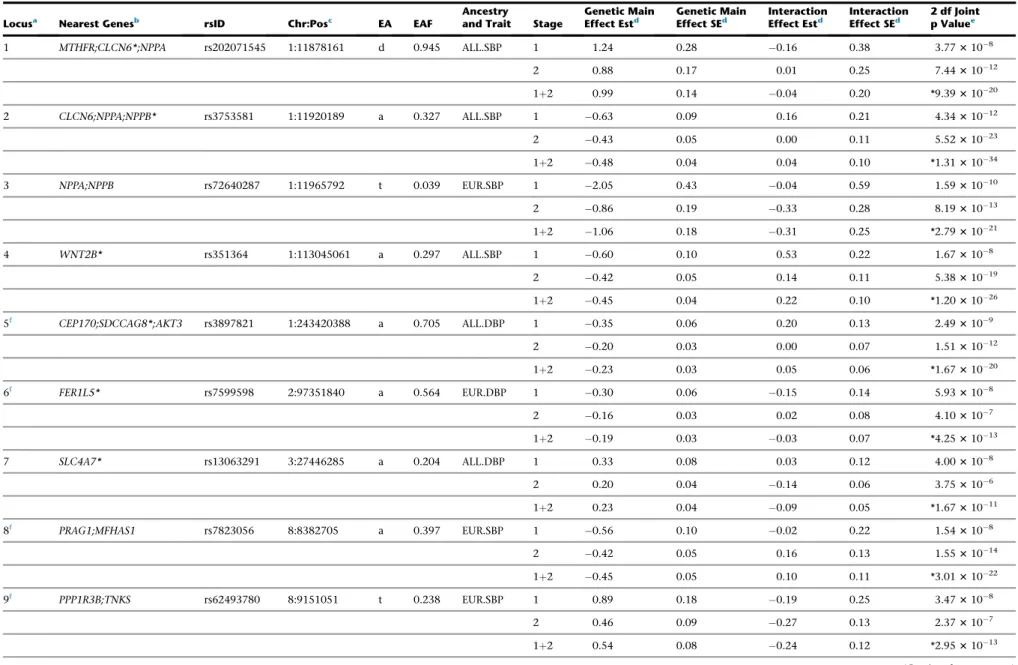
Table 2. Newly Identified Loci that Are Significant in Stage 1 and Formally Replicated in Stage 2
Locusa Nearest Genesb rsID Chr:Posc EA EAF Ancestryand Trait Stage Effect EstGenetic Maind Genetic MainEffect SEd InteractionEffect Estd InteractionEffect SEd 2 df Jointp Valuee
1 MTHFR;CLCN6*;NPPA rs202071545 1:11878161 d 0.945 ALL.SBP 1 1.24 0.28 0.16 0.38 3.773108
2 0.88 0.17 0.01 0.25 7.4431012
1þ2 0.99 0.14 0.04 0.20 *9.3931020
2 CLCN6;NPPA;NPPB* rs3753581 1:11920189 a 0.327 ALL.SBP 1 0.63 0.09 0.16 0.21 4.3431012
2 0.43 0.05 0.00 0.11 5.5231023
1þ2 0.48 0.04 0.04 0.10 *1.3131034
3 NPPA;NPPB rs72640287 1:11965792 t 0.039 EUR.SBP 1 2.05 0.43 0.04 0.59 1.5931010
2 0.86 0.19 0.33 0.28 8.1931013
1þ2 1.06 0.18 0.31 0.25 *2.7931021
4 WNT2B* rs351364 1:113045061 a 0.297 ALL.SBP 1 0.60 0.10 0.53 0.22 1.673108
2 0.42 0.05 0.14 0.11 5.3831019
1þ2 0.45 0.04 0.22 0.10 *1.2031026
5f CEP170;SDCCAG8*;AKT3 rs3897821 1:243420388 a 0.705 ALL.DBP 1 0.35 0.06 0.20 0.13 2.493109
2 0.20 0.03 0.00 0.07 1.5131012
1þ2 0.23 0.03 0.05 0.06 *1.6731020
6f FER1L5* rs7599598 2:97351840 a 0.564 EUR.DBP 1 0.30 0.06 0.15 0.14 5.933108
2 0.16 0.03 0.02 0.08 4.103107
1þ2 0.19 0.03 0.03 0.07 *4.2531013
7 SLC4A7* rs13063291 3:27446285 a 0.204 ALL.DBP 1 0.33 0.08 0.03 0.12 4.003108
2 0.20 0.04 0.14 0.06 3.753106
1þ2 0.23 0.04 0.09 0.05 *1.6731011
8f PRAG1;MFHAS1 rs7823056 8:8382705 a 0.397 EUR.SBP 1 0.56 0.10 0.02 0.22 1.543108
2 0.42 0.05 0.16 0.13 1.5531014
1þ2 0.45 0.05 0.10 0.11 *3.0131022
9f PPP1R3B;TNKS rs62493780 8:9151051 t 0.238 EUR.SBP 1 0.89 0.18 0.19 0.25 3.473108
2 0.46 0.09 0.27 0.13 2.373107
1þ2 0.54 0.08 0.24 0.12 *2.9531013
(Continued on next page)
384
The
American
Journal
of
Human
Genetics
102
,
375–400,
March
1,
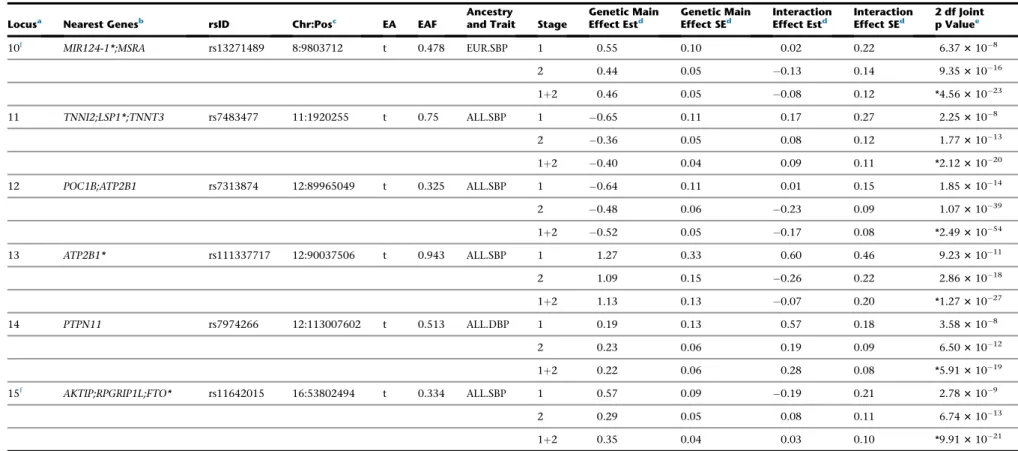
Table 2. Continued
Locusa Nearest Genesb rsID Chr:Posc EA EAF Ancestryand Trait Stage Effect EstGenetic Maind Genetic MainEffect SEd InteractionEffect Estd InteractionEffect SEd 2 df Jointp Valuee
10f MIR124-1*;MSRA rs13271489 8:9803712 t 0.478 EUR.SBP 1 0.55 0.10 0.02 0.22 6.373108
2 0.44 0.05 0.13 0.14 9.3531016
1þ2 0.46 0.05 0.08 0.12 *4.5631023
11 TNNI2;LSP1*;TNNT3 rs7483477 11:1920255 t 0.75 ALL.SBP 1 0.65 0.11 0.17 0.27 2.253108
2 0.36 0.05 0.08 0.12 1.7731013
1þ2 0.40 0.04 0.09 0.11 *2.1231020
12 POC1B;ATP2B1 rs7313874 12:89965049 t 0.325 ALL.SBP 1 0.64 0.11 0.01 0.15 1.8531014
2 0.48 0.06 0.23 0.09 1.0731039
1þ2 0.52 0.05 0.17 0.08 *2.4931054
13 ATP2B1* rs111337717 12:90037506 t 0.943 ALL.SBP 1 1.27 0.33 0.60 0.46 9.2331011
2 1.09 0.15 0.26 0.22 2.8631018
1þ2 1.13 0.13 0.07 0.20 *1.2731027
14 PTPN11 rs7974266 12:113007602 t 0.513 ALL.DBP 1 0.19 0.13 0.57 0.18 3.583108
2 0.23 0.06 0.19 0.09 6.5031012
1þ2 0.22 0.06 0.28 0.08 *5.9131019
15f AKTIP;RPGRIP1L;FTO* rs11642015 16:53802494 t 0.334 ALL.SBP 1 0.57 0.09 0.19 0.21 2.783109
2 0.29 0.05 0.08 0.11 6.7431013
1þ2 0.35 0.04 0.03 0.10 *9.9131021
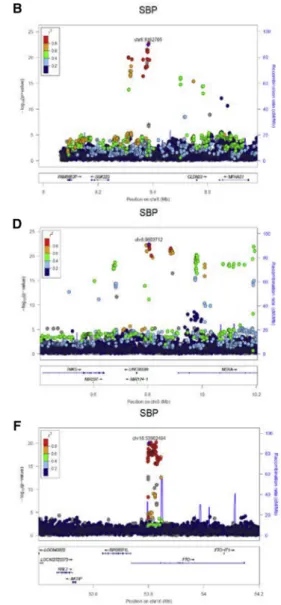
Each locus is genome-wide significant (p<53108) in stage 1 and formally replicated in stage 2 using Bonferroni-adjusted significance level (p<0.05/74). Forest plots and LocusZoom plots are shown inFigures S3andS4,
respectively. Abbreviations: BP, blood pressure; SBP, systolic BP; DBP, diastolic BP; EA, effect allele; EAF, effect allele frequency; 2 df joint p, p value of the joint test with 2 degrees of freedom of genetic main and interaction effects; 1 df interaction p, p value of the interaction test with 1 degree of freedom; EUR, European ancestry; ALL, trans-ancestry (i.e., combining all ancestry groups through meta-analysis).
a
Each locus was determined through LD-based clumping, using51 Mb around index variants, followed by LD threshold of r2>0.1; ancestry-specific LDs from 1000 Genomes Project were used when clumping within each ancestry and the entire cosmopolitan data were used for trans-ancestry clumping.
bGene names were obtained using variant effect predictor (VEP) from Ensembl. Genes with intragenic index variants are indicated with an asterisk (*). cPositions are based on build 37.
dEffect is in mmHg unit.
eThe most significant p value (between 1 df interaction test and 2 df joint test) are indicated with an asterisk (*). fThese loci indicate ‘‘completely novel’’ loci, at least 1 Mb away from any of known BP loci.
The
American
Journal
of
Human
Genetics
102
,
375–400,
March
1,
2018