June 2011
BY
Econoler, Navigant, CEIS and ACEEE
in Partnership with
The Collaborative Labeling and Appliance
Standards Program (CLASP)
COOLING BENCHMARKING STUDY
REPORT
ACKNOWLEDGEMENT
The project team wants to express its gratitude for the support received from CLASP during the execution of this mandate. In particular, we express our thanks to Ms. Ana Maria Carreño, project manager, for her insight and support during the execution of the mandate. We also want to express our thanks to Mrs. Christine Egan, Executive Director of CLASP, and Mr. Frank Klinckenberg, Technical Advisor of CLASP, for their technical review and direction during all steps of the project.
ABBREVIATIONS AND ACRONYMS
AC Air Conditioning
AHU Air Handling Unit
APF Annual Performance Factor
CC Cooling Capacity
CLASP Collaborative Labeling and Appliance Standards Program
CSPF Cooling Seasonal Performance Factor
EE Energy Efficiency
EER Energy Efficiency Ratio
EU European Union
HSPF Heating Seasonal Performance Factor
IEA International Energy Agency
ISO International Organization for Standardization
MEPS Minimum Energy Performance Standards
NAFTA North American Free Trade Agreement
RAC Room Air Conditioner
S&L Standards and Labeling
SEER Seasonal Energy Efficiency Ratio
US United States of America
TABLE OF CONTENTS
ACKNOWLEDGEMENT ... II
ABBREVIATIONS AND ACRONYMS ... III
LIST OF TABLES ... VII
LIST OF FIGURES ... VIII
EXECUTIVE SUMMARY ... 1 INTRODUCTION ... 10 1 PROJECT METHODOLOGY ... 12 1.1 Mapping ... 12 1.2 Benchmarking ... 13 1.3 Testing ... 13 1.4 Ranking ... 14 2 MAPPING ... 15 2.1 AC Market Characterization ... 15
2.1.1 Supply of New AC Products ... 15
2.1.2 Stock of AC Products ... 19
2.2 Standards and Labeling Framework ... 20
2.2.1 Minimum Energy Performance Standards ... 20
2.2.2 Labeling Scheme ... 21
2.2.3 Test Procedures... 22
3 BENCHMARKING ... 24
3.1 Why Benchmarking Is Needed ... 24
3.2 Air Conditioner Energy Efficiency Metrics ... 24
3.2.1 Energy Efficiency Ratio ... 24
3.2.2 Seasonal Energy Efficiency Ratio ... 25
3.3 Characteristics of the Seasonal Efficiency Metrics... 26
3.3.2 Specific Characteristics of Asian SEER Metrics ... 28
3.3.3 Specific Characteristics of the EU SEER Metric ... 28
3.3.4 Comparison of the Number of Test Conditions for the SEER Metrics ... 28
3.3.5 Differences in Permitted Test Tolerances ... 29
3.4 Benchmarking Conversion Formulas ... 30
3.4.1 EER Conversion Formulas ... 30
3.4.2 SEER Conversion Formulas for On-Off Mini-Split Units ... 31
3.4.3 SEER Conversion Formulas for Variable-Speed/Frequency Mini-Split Units ... 33
3.5 Application of the Conversion Formulas to Compare the Stringency of Energy Efficiency Policy Settings ... 38
4 TESTING ... 42
4.1 Test Procedures Comparison ... 42
4.1.1 Comparison between Test Procedures ... 43
4.1.2 Other Possible Sources of Differences ... 47
4.1.3 Uncertainty of Measurement of the EER ... 48
4.2 Equipment Testing ... 48
4.2.1 Choice of Samples ... 48
4.2.2 Test Conditions... 49
4.2.3 Test Results ... 50
4.2.4 Analysis of Test Results ... 52
5 RANKING ... 55
5.1 Ranking Tool Development ... 55
5.1.1 Determination of the Initial Tool Structure ... 55
5.1.2 Weighting of the Various Ranking Elements ... 56
5.1.3 Final Ranking Tool ... 57
5.2 Detailed Presentation of the Tool ... 57
5.2.1 Weighting of the Main Ranking Categories... 57
5.2.2 MEPS Stringency ... 59
5.2.3 MEPS Program Characteristics ... 60
5.2.4 MEPS Rating Method Technical Characteristics ... 61
5.2.6 Endorsement Label Program Quality ... 63
5.2.7 Comparison Label Program Context ... 64
5.2.8 Comparison Label Program Quality ... 65
5.3 Discussion ... 67
CONCLUSION... 68
REFERENCES ... 71
APPENDIX 1: TECHNICAL CHARACTERISTICS OF MEPS AND LABELING PROGRAM ... 73
LIST OF TABLES
Table 1: Average Seasonal Efficiency Conversion Coefficients for Non-Ducted Single Speed AC Units ... 4
Table 2: Seasonal Efficiency Conversion Coefficients for Non-Ducted VSD Mini-Splits ... 5
Table 3: Stock of RACs by Economy (million units) and Total Growth Between 2005 and 2010 ...20
Table 4: Air Conditioner Labeling Program in Each Economy ...22
Table 5: National Test Procedures for AC Products in the Countries Analyzed ...23
Table 6: Distribution of Fractional Hours within Cooling Season Temperature Bins, AHRI 210/240 ...27
Table 7: Number of Test Points (required and optional) in the Different SEER Test Standards Depending on the Capacity Control Characteristics of the AC under Test ...29
Table 8: Maximum Permitted Tolerances in Declared EER Values in the Different Economies ...29
Table 9: SEER Conversion Coefficients for Non-Ducted Single Speed Mini-Splits for China, the EU, Japan, Korea and the US to be Applied Using the Formula SEER Y = α * SEER X (units are in W/W) ...32
Table 10: SEER Conversion Coefficients for Non-Ducted VSD Mini-Splits ...37
Table 11: Comparable SEER/APF MEPS Requirements by Economy under Each National Test Procedure, for Fixed-Speed, Non-Ducted Mini-Split AC Units (W/W) ...39
Table 12: Comparable MEPS Requirements by Economy under Each National Test Procedure, for Variable-Speed, Non-Ducted, Mini-Split AC Units for China, the EU, Japan, Korea and the US ...40
Table 13: Differences between the Two Main Measurement Methods ...43
Table 14: Main Differences Between Test Procedures: Test Conditions, Installation, Calculations ...44
Table 15: Main Differences Between Test Procedures: Uncertainties of Individual Measurements ...45
Table 16: Main Differences Between Test Procedures: Variation Allowed for Test Readings from Specified Test Conditions (variations of arithmetical mean values/maximum variation of individual readings) ...45
Table 17: Modes Defined in the EU’s prEN 14825 ...50
Table 18: Effect of the Fan Motor Correction on the EU SEER ...53
Table 19: Effect of the Parasitic Power Inputs on the EU SEER ...54
Table 20: Overall Ranking Criteria Worksheet with Weight Assigned to Each Category ...59
Table 21: MEPS Stringency Worksheet with Assigned Weightings for each Stringency Factor ...60
Table 22: MEPS Program Characteristics Worksheet with Assigned Weightings for Each Program Element ...61
Table 23: Technical Characteristics Worksheet with Weightings for Each Element of MEPS Rating Method...62
Table 24: Endorsement Label Program Context Worksheet with Assigned Weightings for Each Program Element ...63
Table 25: Endorsement Label Program Quality with Assigned Weightings for Each Factor of Program Quality ..64
Table 26: Comparison Label Program Context Worksheet with Assigned Weightings for Each Program Element ...65
LIST OF FIGURES
Figure 1: RAC Market Trends from 2005 to 2010 ...15
Figure 2: Trends in the EER of the Most Efficient AC Products ...17
Figure 3: Trends in the EER of the Least Efficient AC Products ...18
Figure 4: AC Product and Sales-Weighted Average EER Trends ...19
Figure 5: MEPS for Single Split RACs in Selected Economies ...21
Figure 6: Comparison of the EuP Lot 10 Database with 2011 Japanese Market Data, after EuP Lot 10 Correction ...34
Figure 7: Comparison of the EuP Lot 10 Database with 2011 US AHRI Data ...35
Figure 8: SEERs for the US, EU, Korea, Japan, and China Metrics, Computed for the Database of Japanese Models ...38
Figure 9: Comparison of SEER Levels for MEPS, for Fixed-Speed, Non-Ducted, Mini-Split AC Units for China, the EU, Japan, Korea, and the US ...40
Figure 10: Comparison of SEER Levels for MEPS, for Variable-Speed, Non-Ducted, Mini-Split AC Units for China, the EU, Japan, Korea, and the US ...41
EXECUTIVE SUMMARY
Room air conditioners (RACs) represent a major energy end usage in several countries and contribute significantly to the electrical grid peak load. Furthermore, the number of RACs is increasing rapidly due to rising living standards in several countries combined with a cost reduction in the price for AC equipment worldwide. These trends have resulted in a rapid increase in electricity demand and energy consumption in the commercial and residential sectors.
Even though RACs significantly impact energy demand and are traded worldwide, there is a lack of assembled information on market characteristics or on existing minimum energy performance standards (MEPS) and labeling schemes implemented in different economies. In addition, it is difficult to compare the performance criteria of air conditioners and policy measures for air conditioners across economies because of the differences in test procedures and protocols.
This cooling benchmarking study, which was funded by the Collaborative Labeling and Appliance Standards Program (CLASP), intends to provide policy makers and energy efficiency (EE) program managers with tools allowing for the comparison of the efficiency of air conditioning (AC) products under the different test procedures and EE metrics that are currently used in major world economies. In addition, a ranking tool has been developed to allow for performance comparisons of residential and commercial AC EE standards and labeling (S&L) programs implemented by countries around the world. The study focused on the comparison of EE performance and policy measures for air conditioners of a cooling capacity of up to 19 kW used in the residential and commercial sectors of the following eight economies: Australia, China, the European Union (EU), Japan, India, Korea, Taiwan, and the United States (US).
The scope of the AC products considered under this study included the following sub-categories: (i) non-ducted single split units (mobile or fixed split units); (ii) non-ducted single split unit heat pumps; (iii) ducted single split units; (iv) multi-split units; (v) single-packaged AC units; (vi) single and double duct units (portable air conditioners); and (vii) central AC units – Air Handling Units (AHUs), rooftop. Absorption units are excluded. The cooling mode of reverse cycle (heating and cooling) units is included in the study.
To achieve its overall goal, the study comprised four interrelated components: mapping, benchmarking, testing, and ranking. The mapping component of the study provides background information on the main characteristics of the RAC markets and the S&L programs implemented in the economies analyzed. Subsequently, these characteristics served as the basis for selecting the RAC models to include in the benchmarking, testing, and ranking components of the study. The benchmarking component allowed comparison of the efficiency of equipment in different economies by developing formulas for the conversion between the various metrics used around the world. To ensure the coherence of the formulas developed in the benchmarking component, the testing component conducted energy performance measurements of four selected RAC models under laboratory conditions and in line with the test procedures in force in the selected economies. The measurement results were compared to the theoretical conversion formulas developed by the benchmarking component to confirm their validity. Finally, based on the analysis of the S&L policy and
regulation frameworks in the economies analyzed as well as input from S&L experts, a ranking tool was developed to compare the stringency and performance of RAC S&L programs between economies.
The main findings of each component are presented below:
Mapping Component
This component of the study provides a mapping of RAC characteristics in selected countries by comparing the market size and trends as well as the EE performance of the RAC products offered. The mapping component also reviews the existing S&L regulations or voluntary initiatives and their characteristics in each country. The main findings are summarized as follows:
• We can observe a general upward trend in the sales of RACs over the last 10 years in the EU and in the last five years in the US and India. In Japan, however, the RAC market has been relatively constant and even suffered a slight drop in 2009.
• In most of the countries analyzed, the RAC market is dominated by split units. One notable exception is India, where window and split units show almost equal shares in the market.
• In mature RAC markets such as the EU, Japan, and the US, inverter split units are widely available. The Japanese market is dominated by reversible RAC units that provide both cooling and heating functions. Inverter unit sales in China are also growing rapidly.
• The sales-weighted average Energy Efficiency Ratio (EER) of single and multi-split AC products has experienced an upward trend in the countries analyzed over the past decade. On the other hand, the sales-weighted average EER of window AC products has remained almost constant between 2006 and 2011 in the US, and it has decreased in the EU over the same period.
• The EER trend of the most efficient RAC products varies across the analyzed economies for which data were available. The EER of the most efficient split systems has been on an upward trend over the last decade in China, the EU, Japan, and the US. However, we can observe a reverse trend in some countries for products that are losing market share, such as unitary (window type) AC models. This is notably the case in the EU where the EER level of the most efficient unitary RAC products with a cooling capacity under 12 kW has declined between 2005 and 2011 after a boost over the 2002-2005 period. The trend observed for the most efficient RAC products is thus coherent with the sales-weighted average efficiency discussed above.
• The EER trend of the least efficient RAC products also varies across the economies analyzed. In the EU, the EER level of the least efficient unitary RAC products, which are losing market share, has decreased. This is coherent with the drop in efficiency of the most efficient unitary units and the sales-weighted efficiency observed for the same category of products. Moreover, in the EU the EER surged from 2002 to 2009 then declined from 2009 to 2011 for least efficient single and multi-split RAC units with a cooling capacity of 12 kW or less. This trend is different from the observed EER of the most efficient single split units with a cooling capacity of 12 kW or less, which has slightly decreased, while it has
increased for multi-split RAC units of the same capacity. This suggests that some manufacturers have chosen to offer only RAC single split products, with lower EERs than multi-split units. Flat and upward EER trends for least efficient RAC products have been observed in the US and China, respectively, over the last years. The trends of the EERs of the least efficient RAC products in China are improving, a finding similar to that made for China’s most efficient equipment. This reflects the positive impacts that more stringent S&L regulations have had on the RAC market in China.
• The RAC stock grew rapidly in the countries analyzed, with a 75% increase in the EU and a 44% increase in China from 2005 to 2010. Growth has been moderate in Japan and the US, with 15% and 10% stock increases, respectively, over the same period.
• In some of the economies analyzed, such as China and Australia, the RAC MEPS level implemented has become more stringent over time with one or several updates. India and Taiwan are considering implementing more stringent requirements in the near future.
Benchmarking Component
The EER and the Seasonal Energy Efficiency Ratio (SEER) are the two main types of metrics in use internationally to rate the EE of ACs. The EER is the ratio of the cooling capacity to the electricity consumption when measured at full load (i.e., at the maximum deliverable cooling capacity of the AC). The EER is not representative of the seasonal energy performance because it does not take into consideration part load performance. In fact, ACs typically operate at full capacity for only a small number of hours in the cooling season; they run at part load or cycle on and off for the rest of the time. In order to address this shortcoming of the EER metric, the SEER has been created to provide a more representative measure of the EE performance of AC units over the cooling season. SEER metrics are increasingly being used as alternatives to the EER to set MEPS and labeling requirements. Japan has gone one step further and reports the Annual Performance Factor (APF) to consumers. This metric is defined as the weighted average of the Cooling Seasonal Performance Factor (CSPF) and of the Heating Seasonal Performance Factor (HSPF). The CSPF is similar to the SEER and used as part of Japanese, Chinese, and Korean test standards. The HSPF is conceptually similar to the SEER but developed specifically for the heating mode of products.
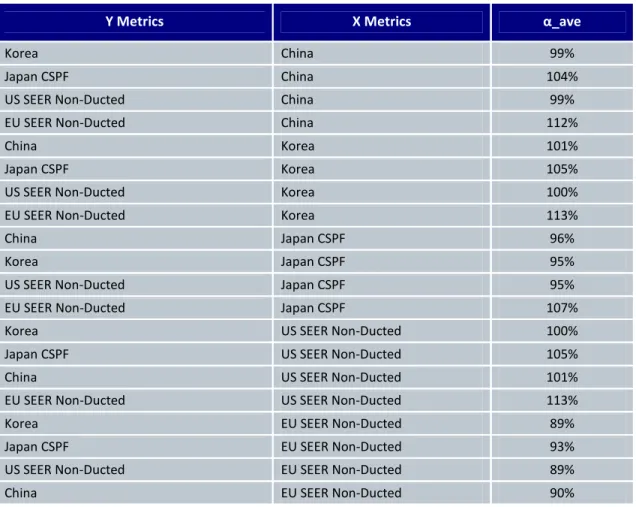
The benchmarking component of the project derives mathematical functions that can be applied to convert energy performance measurements of AC equipment in one economy into the comparable values that would have been recorded for the same products if they had been tested and rated in other economies. These conversion functions have been designed based on an in-depth analysis of the differences between methods to measure the energy performance metrics of ACs and the tolerances allowed in the reviewed economies. These conversion functions have been developed for both split non-ducted and split ducted ACs and for fixed-speed and variable-speed (inverter driven) units. As these split systems are the most common types of AC products sold in international markets, those conversion functions cover a large portion of the world market for AC products. Table 1 below presents the conversion coefficients that can be applied in the general conversion function SEER Y = α_ave * SEER X. In this formula, SEER X represents the rating observed in the source country,
α_ave is the average conversion coefficient that should be applied, and SEER Y is the resulting efficiency in the target country.
Table 1: Average Seasonal Efficiency Conversion Coefficients for Non-Ducted Single Speed AC Units
Y Metrics X Metrics α_ave
Korea China 99%
Japan CSPF China 104%
US SEER Non-Ducted China 99%
EU SEER Non-Ducted China 112%
China Korea 101%
Japan CSPF Korea 105%
US SEER Non-Ducted Korea 100%
EU SEER Non-Ducted Korea 113%
China Japan CSPF 96%
Korea Japan CSPF 95%
US SEER Non-Ducted Japan CSPF 95%
EU SEER Non-Ducted Japan CSPF 107%
Korea US SEER Non-Ducted 100%
Japan CSPF US SEER Non-Ducted 105%
China US SEER Non-Ducted 101%
EU SEER Non-Ducted US SEER Non-Ducted 113%
Korea EU SEER Non-Ducted 89%
Japan CSPF EU SEER Non-Ducted 93%
US SEER Non-Ducted EU SEER Non-Ducted 89%
China EU SEER Non-Ducted 90%
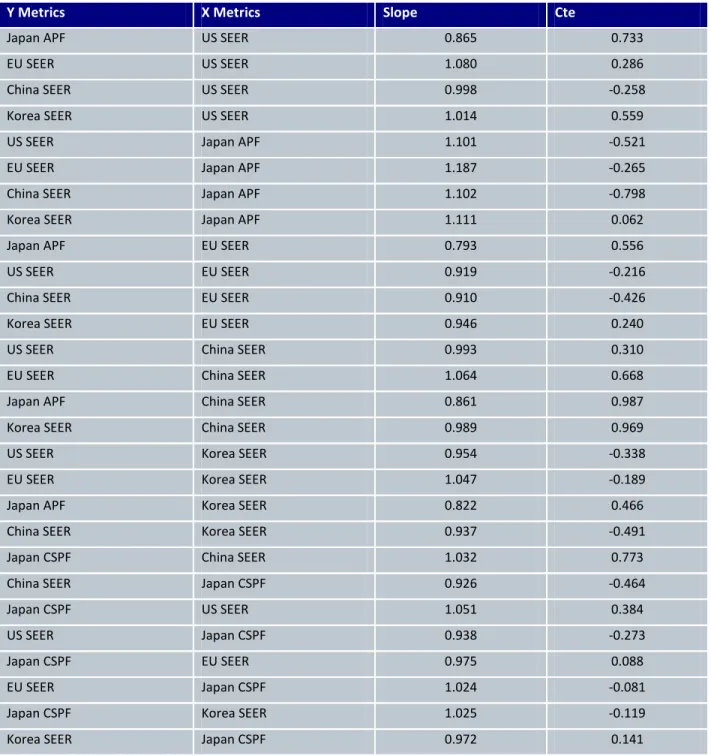
The study has also derived minimum and maximum conversion coefficients for non-ducted single speed RACs to determine the range of plausible solutions to the conversion functions. While these maximum and minimum coefficients are not shown in Table 1 above, they are available in the benchmarking section of this report. Additional parameters were also incorporated in the coefficients to reflect differences in the way ducted units are treated in the US versus elsewhere, and also to take into account the inclusion of energy use associated with low power modes in Europe. These additional elements that needed to be taken into account in the derivation of US and EU SEER conversion coefficients were managed through the application of an additional and broader uncertainty interval (i.e., through a lower level of confidence in conversion formula results). Table 2 below presents the conversion coefficients applicable to variable-speed drive (VSD) AC units using the conversion function SEER Y = Cte + slope * SEER X, where SEER X and SEER Y are the seasonal efficiency metrics used in the source and target economies, respectively.
Table 2: Seasonal Efficiency Conversion Coefficients for Non-Ducted VSD Mini-Splits
Y Metrics X Metrics Slope Cte
Japan APF US SEER 0.865 0.733
EU SEER US SEER 1.080 0.286
China SEER US SEER 0.998 -0.258
Korea SEER US SEER 1.014 0.559
US SEER Japan APF 1.101 -0.521
EU SEER Japan APF 1.187 -0.265
China SEER Japan APF 1.102 -0.798
Korea SEER Japan APF 1.111 0.062
Japan APF EU SEER 0.793 0.556
US SEER EU SEER 0.919 -0.216
China SEER EU SEER 0.910 -0.426
Korea SEER EU SEER 0.946 0.240
US SEER China SEER 0.993 0.310
EU SEER China SEER 1.064 0.668
Japan APF China SEER 0.861 0.987
Korea SEER China SEER 0.989 0.969
US SEER Korea SEER 0.954 -0.338
EU SEER Korea SEER 1.047 -0.189
Japan APF Korea SEER 0.822 0.466
China SEER Korea SEER 0.937 -0.491
Japan CSPF China SEER 1.032 0.773
China SEER Japan CSPF 0.926 -0.464
Japan CSPF US SEER 1.051 0.384
US SEER Japan CSPF 0.938 -0.273
Japan CSPF EU SEER 0.975 0.088
EU SEER Japan CSPF 1.024 -0.081
Japan CSPF Korea SEER 1.025 -0.119
Korea SEER Japan CSPF 0.972 0.141
Once established, the conversion formulas presented in Table 1 and Table 2 above were applied to current EE policy settings to compare the minimum energy performance requirements for the most common types of split RACs in the world’s major economies. The main finding is that the Japanese Top Runner requirements are the most stringent existing requirements for split AC units, and these are between 17% (for more than 6 kW units) and 68% (for less than 3.2 kW units) more demanding than any current or proposed requirements in other economies.
The study does not intend to indicate that the Japanese requirements should be set as a world model, as the development of requirements also needs to take into account factors such as energy and equipment costs, consumer behaviors and usage patterns. This finding suggests that there are links between the high price of electricity, the stringency of MEPS requirements for ACs, and the strong government support for energy efficiency found in Japan. In fact, economies with high electricity rates or depending heavily on energy imports have a natural tendency to set more stringent MEPS for the benefits of their consumers and in response to their market reality.
Testing Component
The testing component highlighted the differences among test procedures for measuring the cooling capacity and the efficiency of ACs in cooling mode within the economies analyzed. Furthermore, it conducted testing for four samples under different test procedures in order to identify practical considerations with the test procedures and to provide real data to check the coherence of the conversion functions developed as part of the benchmarking component of the project. The main findings of the test procedures comparison are summarized as follows:
• Most of the economies included in this part of the study (the US, the EU, Japan, China, Korea, and India) base their test procedures for AC systems on the adaptation of two international standards: ISO 5151 and ISO 13253. The test procedures are based on two main test methods: the indoor air enthalpy method and the calorimeter room method.
• Several testing standards allow a choice between two different measurement methods. This study recommends use of the calorimeter room method whenever possible as it reduces the uncertainty of measurement compared to the enthalpy method. This is particularly important when EE classes are defined.
• While differences found among the test procedures used in different economies lead to various uncertainties of measurement, most of them do not allow the establishment of a systematic difference for the resulting EER.
• Differences among test procedures that have a systematic effect on the EER measurement include testing temperature conditions, the length of the refrigerant piping, and the fan correction for ducted units. The testing temperature condition effect was integrated in the conversion functions developed in the benchmarking component. This study recommends worldwide unification of the requirements on the length of the refrigerant piping used for the tests.
• The fan correction applied to ducted units may introduce large differences between the adjusted test results and real unit efficiency. This study therefore recommends a review of the existing testing standards to remove the fan correction when the fan is an integral component of the AC, and to make a fan correction only when the fan is not part of the unit.
• Power inputs in thermostat off, standby, and crank case heater modes should be considered in all SEER calculations in order to include all electrical energy used during the cooling season. This has already been incorporated in the recent revision of EU SEER calculation procedures.
• Testing variable-capacity ACs (inverters) can be a problem for third-party testing or market surveillance when contact with the manufacturer is not convenient (may not be allowed or communication might be difficult). For these units, the testing laboratory has to obtain additional information from the manufacturer to set the unit in the right mode, both for full load and part load rating conditions. If such information is not available, the laboratory cannot perform the test. Nevertheless, this study has demonstrated that if the testing laboratory has a facility where it is possible to set the load which the tested unit has to overcome, it is possible to test these units when the speed of the fan is known and the part load ratio is defined in the test procedure. This study recommends standardizing an alternative approach of setting the part load capacity on the indoor side of the test sample to allow uniformity across testing standards and laboratories.
• This study has confirmed that inverter units have poor latent heat removal characteristics at low load, and there is laboratory evidence that a small share of the units on the market do not have any latent heat removal characteristic even at high load. The study scope does not allow a clear conclusion on whether and how a humidity removal ratio should be incorporated as part of energy efficiency metrics requirements. We recommend that further research be conducted on this topic to determine the technical implications, the manufacturing cost, the deviation from comfort conditions in different climates, and the market requirements in dry or humid climates before deciding if this should be included in RAC testing procedures and in EER and SEER calculations.
• Laboratory testing confirmed the coherence of the conversion functions and of the various coefficients developed by the benchmarking team.
The findings from the testing component were used as input to the benchmarking team to fine-tune the proposed conversion coefficients between metrics.
Ranking Component
This component of the study focused on the elaboration of a ranking tool for RAC S&L policies, regulations, or initiatives. The ranking tool guides the user to collect the relevant data needed to assess their country’s S&L programs, and provides evidence-based information on which to base policy decisions in order to improve programs or identify requirements for further study. The objective is to pull the market towards higher levels of AC efficiency and lay the foundation for strong and harmonized energy performance requirements at the global level.
In order to develop the ranking survey instrument, the ranking component team reviewed the Data Collection Sheet developed as part of the Mapping component. The most significant information was extracted from the sheet to serve as the basis for the ranking tool. Some data elements were excluded that are difficult for national experts to obtain. The first draft instrument covered four S&L program areas: MEPS program
characteristics, MEPS technical characteristics, labeling program context, and labeling program quality. This draft was circulated to the project team and to a selected group of outside S&L experts. Converging to a final form involved extensive iteration as well as repeated rewording and restructuring to build a survey instrument that would be relatively easy to use, unambiguous, flexible enough to apply in highly varied national and international contexts, and robust enough to yield useful results. In this iterative process, the ranking tool was expanded to include MEPS stringency and the labeling area was split to address endorsement and comparison labeling programs separately.
The final survey instrument was built as a spreadsheet comprising eight tabs, including a summary sheet that determines the Overall Ranking Score by tallying the score from each of the subsequent tabs, which in turn cover seven key components used to determine the effectiveness of AC S&L programs, as provided below. A weighting factor is applied to the score from each individual worksheet tab. These scores are then summed and listed on a scale from 0 to 100 to determine the overall performance of the S&L programs of the ranked countries.
Once the basic structure and content of the ranking tool was developed, the ranking component team had a group of international experts on EE S&L assign relative weights (corresponding to importance) to each of the seven broad categories covering S&L program design and implementation, as well as to specific elements within each category.
The weighting values in the final ranking tool are based on input from experts representing government agencies, advocacy organizations, and consulting firms in Canada, China, India, Japan, and the US.
The scoring reflects generally accepted principles regarding best practice in S&L programs as reported in the literature, as well as input from CLASP staff, ACEEE’s experience and, in some cases, comments from the expert reviewers.
Ranking Criteria Comments
17 MEPS Stringency This tab evaluates MEPS program stringency.
20
MEPS Program Characteristics
This tab evaluates coverage and maturity of the standards program, frequency of revision cycles and enforcement mechanisms.
20 Technical Characteristics of MEPS Rating Method
This tab evaluates rating and certification methods.
7
Endorsement Label Program Context
This tab evaluates coverage of the
endorsement labeling program, maturity of the program, revision cycles and
enforcement.
11 Endorsement Label Program Quality
This tab evaluates labeling program quality from the consumer's perspective.
15
Comparison Label Program Context
This tab evaluates coverage of the
comparison labeling program, maturity of the program, revision cycles and enforcement.
10 Comparison Label Program Quality
This tab evaluates labeling program quality from the consumer's perspective.
This Version 1.0 of the ranking tool can serve as a framework for ranking residential AC S&L programs, and can be modified to rank S&L programs targeting other product classes. As the tool is further refined, input from a broader range of S&L experts can be incorporated. Experts have already suggested additional topics for consideration in future improvements of the ranking tool. Following final completion of the project, the survey instrument and its instruction package will be made available to CLASP and to stakeholders on the global scene for use in any country where it might be deemed helpful.
INTRODUCTION
As part of its efforts to support transitioning to a world in which appliances, equipment and lighting are built for maximum Energy Efficiency (EE) and minimal contribution to global climate change, the Collaborative Labeling and Appliance Standards Program (CLASP) funded a study to provide tools and procedures allowing an international comparison of the EE performance and policy measures for air conditioners with a cooling capacity of 19 kW or less used in the residential and commercial sectors. CLASP is an international organization that promotes EE Standards and Labeling (S&L) in commonly used appliances and equipment.
Air Conditioning (AC) systems represent a major energy end-use in several countries, and contribute to the growth of energy consumption and peak load in the commercial and residential sectors. This trend is recently increasing due to rising living standards in several countries combined with a cost reduction of AC products. This tendency is contributing to an increase in greenhouse gas emissions across the world.
This study covered AC products offered in the global market as well as testing procedures and regulatory or voluntary initiatives introduced in different economies. In support of this study, information was collected for Australia, China, the European Union (EU), Japan, India, Korea, Taiwan and the United States (US). The main objective was to provide a meaningful comparison of the effectiveness of air conditioner models sold in major economies. This has been done through an analysis of the market characteristics, Minimum Energy Performance Standards (MEPS) levels and EE classes used for labeling schemes. In addition, conversion functions were developed allowing comparison of different efficiency metrics used across the world.
The project team included Econoler acting as team leader and experts from Navigant, CEIS and ACEEE. CLASP experts were also closely involved in work supervision and provided direction and advice to the project team. Several external experts and country representatives provided market information, advice and views on different issues related to the international comparison of AC equipment efficiencies.
This report summarizes the main findings of the four components of the project. The detailed reports prepared as part of this project for each component are listed below:
• Report 1: Mapping component. This report presents a review of AC products offered in different economies and some market characteristics.
• Report 2: Benchmarking component. This report presents an analysis to develop a series of conversion functions for metrics used in different economies around the world as well as a comparison of the relative stringencies of different MEPS and labeling schemes.
• Report 3: Testing component. This report presents the conclusions from a comparison of the testing of air conditioners under test procedures of various countries, and the actual testing of a limited sample of products under different test procedures.
Scope of the Study
In this study, the term Room Air Conditioner (RAC) includes: • RAC products with a cooling capacity of up to 19 kW;
• Electrically driven vapor compression units. Absorption units are excluded;
• Cooling units only and the cooling function of reverse cycle (heating and cooling) units. The scope of the study includes the following RAC sub-categories:
• Non-ducted single split units (mobile or fixed split units); • Non-ducted single split unit heat pumps;
• Ducted single split units; • Multi-split units;
• Single-packaged AC units;
• Single and double duct units (portable air conditioners); • Central AC units (rooftop units).
1
Project Methodology
The study intends to provide policy makers and EE program managers with tools enabling comparison of the efficiency of AC products under different test procedures currently used in major world economies. Additional tools were developed to allow comparison of the performance of residential and commercial AC EE S&L programs conducted by countries around the world. The study included the four components described below: mapping, benchmarking, testing, and ranking.
1.1
Mapping
The goal of this component is to establish AC energy performance in selected economies by comparing market trends, performance, and existing S&L initiatives and their characteristics. This component included the following tasks:
• Select relevant economies to consider in the study based on the international experience of study team members and CLASP. The selection focused on economies where MEPS and labels have been implemented and/or are under preparation or revision. This list was validated with CLASP and eight economies were selected based on size and their overall value for a worldwide comparison scheme. • Define and classify RAC sub-product categories to facilitate comparison of their EE. This resulted in the
identification of the following RAC sub-categories: (i) non-ducted single split units (mobile or fixed split units); (ii) non-ducted single split unit heat pumps; (iii) ducted single split units; (iv) multi-split units; (v) single-packaged AC units; (vi) single and double duct units (portable ACs); and (vii) central AC units (AHUs, rooftop).
• Collect information on the AC market for each country using information available online or with the support of national organizations. The team collected stock, sales, and average energy performance data for each AC sub-category offered in the market. Data collection also included any existing MEPS or labeling schemes and their associated testing procedures. This information was requested for each RAC sub-category included in the scope of the study. All information was collected for available years from 2002 to 2009. Whenever possible, data on the stock, sales, and average energy performance of each AC sub-category were collected using government sources, industry association databases (e.g., Eurovent), or market research companies (e.g., GfK).
• Compare the markets and highlight the differences between economies. One of the objectives of this analysis was to identify the most efficient equipment available in each product category as well as the average capacity of the units sold and the market share of efficient products. The information collected for MEPS and labeling schemes was compared and provided an essential input for the benchmarking and ranking activity.
1.2
Benchmarking
The benchmarking component was aimed at overcoming the information comparability barrier by deriving conversion functions and coefficients that can be applied to compare AC energy performance ratings across economies. These conversion functions and coefficients can also be applied to compare MEPS or labeling class levels across economies. As part of this component, the following tasks were undertaken:
• Identify the differences in test procedures for several energy performance metrics, including the EER, the SEER, the APF, and the CSPF. These are all metrics used to establish the energy performance of ACs in the selected economies.
• Based on the differences in test procedures or the conditions identified, propose formulas that can be used for conversion purposes between each of the most important EE metrics currently in use for ACs around the world. Formulas were successfully developed for split non-ducted and ducted ACs, for fixed-speed as well as for variable-speed (inverter driven) units.
• Apply the conversion formulas to current EE policy requirements in the selected economies to compare their relative stringency on an equal basis.1
1.3
Testing
The testing component of this study features two goals: (i) the comparison of test procedures of the economies included in the scope of the study; and (ii) the testing of a limited sample of RACs under different testing protocols. The study team undertook the activities described below:
• Identify the differences among the test procedures used in the selected economies for measuring the capacity and efficiency of ACs in cooling mode. The study team also estimated the uncertainties of measurement that could be expected for each test method2 as functions of the test conditions and type of AC. International Organization for Standardization (ISO) standards were covered as they are often used as reference test procedures in the development of test procedures in most of the studied economies.
• Test a limited number of samples in order to check the conversion coefficients developed under the benchmarking component to compare the rating of a given AC through the different efficiency metrics used in the economies included in the study. Four samples were selected in order to cover the most relevant segments of the market for appliances included in the scope of this study.
1 This comparison takes into account the energy efficiency requirements. However, it does not consider other factors such as
cooling demand, usage patterns, and the cost of electricity, which are also relevant elements for assessing the level at which an energy efficiency requirement should be set.
1.4
Ranking
Under this study, the goal of the ranking component was to provide policy makers with a tool to compare the stringency and efficiency of their AC MEPS or labeling programs to those implemented in other countries and/or regions. The study team undertook the following tasks:
• Enlist a group of international S&L experts to advise on the content and relative weighting of ranking parameters for S&L programs.
• Develop a concise ranking instrument to allow the experts to assign ratings to various S&L program components. Based on iterative feedback through several cycles, the study team converged on a seven-part ranking tool. The ranking tool was developed for diffusion to any interested stakeholder in the form of an Excel spreadsheet.
• Implement a Delphi approach to query internal and external S&L experts about the relative weights that should be assigned to each of the seven categories retained for the ranking tool. The team then assigned appropriate weighting for specific elements within each category.
• Test the rating tool using national data collected through the mapping component.
• Finalize packaging and instruction of the ranking tool so that it can be made available to any interested stakeholder for the evaluation of the stringency and efficiency of their S&L initiatives.
2
Mapping
2.1
AC Market Characterization
2.1.1 Supply of New AC Products
In most of the eight economies covered by the study, split units dominate the RAC market. For instance, out of the total domestic sales of 30.3 million split units sold in China in 2009, 30 million were for single split AC systems and 0.3 million for multi-split AC systems. In comparison, the sales of windows and moveable AC units were very low.3 Inverter split unit sales were reported to be rising in China and had reached 18% of total sales by 2009. The RAC split unit market in the EU is growing steadily while the window unit market has been constant over the last six years. India shows a more diversified market as both RAC window and single split unit sales have recently experienced fast growth. The Japanese RAC market is dominated by reversible split AC units, which were developed in Japan.
Figure 1: RAC Market Trends from 2005 to 20104
Despite the variation of RAC market characteristics depending on the economy, the market has been on an upward trend over the last five years in most economies. Figure 1 above presents the RAC market shipment progression over the last five years in the US, the EU, India, and Japan.
RAC split unit sales in Japan almost remained constant between 2005 and 2008. Thereafter, Japanese RAC sales slightly declined between 2008 and 2009 due to the economic recession. However, it is expected that the
3 All the information used in Section 2 is further described and referenced in the mapping component report.
4 Data on the sales of split units per sub-product – such as non-ducted split packaged AC systems (cooling only), non-ducted split
packaged AC systems (heat pumps), single duct unit, single split, or multi-split – as a share of the total market per year were not available for all the economies included in the scope of this study. Therefore, it has not been possible to compare RAC markets among all economies.
market for ACs will recover and resume growth by 2015. In contrast to the trend observed in Japan, the sales of split AC units (cooling only and reversible units, including multi-splits) and portable units in the EU (2005 - 2010) as well as of window and split AC units in India (2007 - 2010) grew rapidly. Sales for window AC units in the EU (2005 - 2010) have remained constant. According to an economic and market analysis conducted in 2008, RAC sales are expected to increase within the EU.5
Additionally, the figure above suggests that the RAC market in the US has been on an upward trend over the last decade.6 In fact, RAC shipments experienced a surge between 2000 and 2003, demonstrating an increase of 26% (from 6.496 to 8.216 million units). The figure slightly decreased to 8.032 million units in 2005 and, in 2006, the shipment volume went back up again to reach more than 10 million units, which later decreased to 9.086 million units in 2008. Over the same period, the trend observed for all RAC shipments was consistent with that observed in the residential and commercial sectors. However, in 2010, a US Department of Energy projection predicted that the yearly shipment volume would remain almost constant at approximately 9.5 million RAC units over the next three decades.
Cooling Capacity
According to data presented in a recent study by the International Energy Agency’s (IEA) 4E Annex,7 the product weighted average cooling capacity of products shipped in China in 2008 was 4.3 kW. This figure is higher than the result of an analysis of AC catalogue data of Chinese manufacturers carried out as part of this study, which found a product weighted average cooling capacity of 3.33 kW in 2011. Another study from CNIS reported that 89% of the market was in the range of 0 - 4.5 kW, 8% in the 4.5 - 7.1 kW range and 3% in the 7.1 - 14 kW range.8
In Europe, the product weighted average cooling capacity for RAC split units under 12 kW has remained fairly constant at 5.9 kW between 2009 and 2011. However, this is higher than the 5.6 kW average observed in 2002. On the other hand, the product weighted average cooling capacity for RAC unitary units under 12 kW has shown an upward trend over the last three years. From 2009 to 2011, the product weighted average cooling capacity increased from 3.7 kW to 5.6 kW.
5 See EuP (2008) Preparatory Study on the Environmental Performance of Residential Room Conditioning Appliances (airco and
ventilation), p.36.
6 Residential air conditioners in the US fall into the two broad categories of “room air conditioners” and “central air conditioners.”
These are regulated differently and treated differently in the manner in which they are tested; however, the distinctions used do not correspond to those used outside of North America. Room air conditioners in the US refer solely to single packaged window/wall units (unitary types). By contrast, the term central air conditioners includes split and multi-split packaged non-ducted AC units that would be classified as room air conditioners in other parts of the world.
7 The report was released in February 2011. It looks at both unitary (packaged) and split ACs sized up to 14 kW and makes a
range of observations on the differences in performance of these products between countries. 4E is an IEA energy technology collaborative program.
In Japan, the product weighted average cooling capacity for non-ducted split packaged AC systems (heat pumps) was estimated at 3.67 kW for 2011.
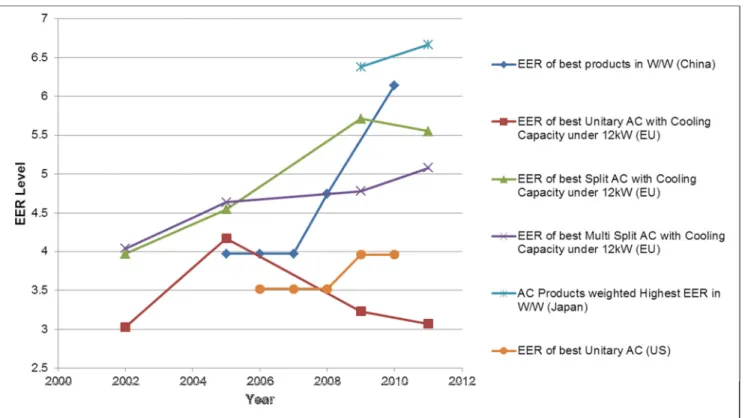
Trends in the EER of the Most Efficient Products
The analysis of trends in the EER of the most efficient products available in the market was conducted for certain economies only (China, the EU, Japan, and the US) because relevant data were not available in all analyzed economies to allow for such an analysis. Moreover, given that the objective was to compare trends, the analysis was based on EER data, which were not corrected for differences in test procedures and metrics. The trend of the EER level of the most efficient AC products varies across the studied economies, as presented in Figure 2 below.
Figure 2: Trends in the EER of the Most Efficient AC Products
It can be seen from the figure above that the EER of the most efficient AC products has improved over the years in most economies. In the EU, the EER of the most efficient split and multi-split AC products with a cooling capacity under 12 kW improved between 2002 and 2011. In Japan, the EER of the most efficient AC products rose from 6.38 to 6.67 between 2009 and 2011. The same upward trend was observed in the US for the most efficient unitary AC products between 2006 and 2010. In China, the EER level of the most efficient products increased rapidly from 3.97 to 6.14 between 2005 and 2010. The best EER value of 6.14 W/W was found in a sample of 245 models from online catalogue data for China.
On the other hand, in the EU, the EER of the highest unitary (window) AC units with a cooling capacity less than 12 kW has decreased from 4.17 in 2005 to 3.07 in 2011. This suggests that unitary AC unit manufacturers that
were providing higher efficiency products have withdrawn their offerings of energy efficient unitary products in order to concentrate on the growing split market segment.
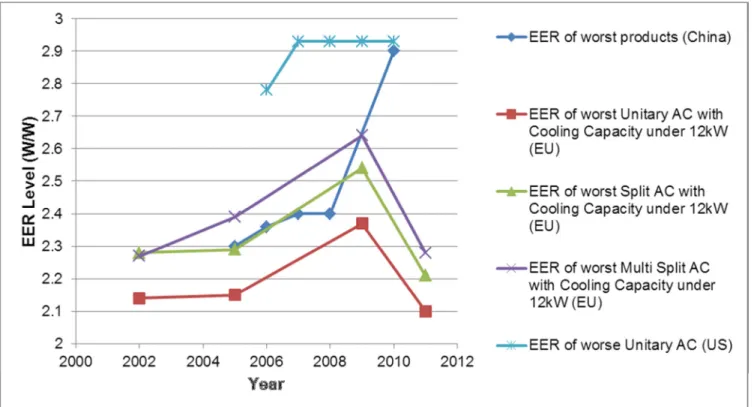
Trends in the EER of the Least Efficient Products
A time series of the trends in the EER of the least efficient AC products in the selected economies is presented in Figure 3 below. The EER data used were not corrected for differences in test procedures since this section intends to analyze trends in the EER of the least efficient RAC products.
Figure 3: Trends in the EER of the Least Efficient AC Products
It can be seen from the figure above that in the EU, the EER of the least efficient AC products has not improved over the 2002 - 2011 period, unlike the upward trend noted for the most efficient products. From 2002 to 2009, the EER of the least efficient unitary, split and multi-split AC products with a cooling capacity less than 12 kW increased from 2.14 to 2.37, 2.28 to 2.54, and 2.27 to 2.64, respectively. Thereafter, the EER dropped to 2.10 for unitary AC units, 2.21 for split AC systems, and 2.28 for multi-split AC products. From the trend observed for unitary RAC units, it could therefore be suggested that the EU market has lost interest in these products leading some manufacturers to offer RAC products that only meet the minimum voluntary MEPS. In the US, the EER level of the least efficient unitary AC products increased slightly from 2.8 to 2.9 between 2006 and 2007, and remained constant over the following years.
Unlike in the US and EU, the EER of the least efficient AC products in China experienced a slight increase between 2005 and 2008 followed by a rapid improvement, from 2.4 to 2.9, between 2008 and 2010. This likely reflects the positive impacts that more stringent S&L regulations had on the RAC market in China.
Trends in Product and Sales-Weighted Average EER
The product and sales-weighted average EER of AC products in some of the economies (China, the EU, and the US) is presented in Figure 4 below. The EER data used were not corrected for differences in test procedures among countries as this section is only intended to analyze and compare trends in product and sales-weighted average EER.
Figure 4: AC Product and Sales-Weighted Average EER Trends
As can be seen from the figure above, the product weighted average EER of split and multi-split AC products in the EU has consistently increased from 2002 to 2011. A similar trend is observed in China, where the product weighted average EER experienced an upward trend between 2004 and 2008. Unlike the case of AC products in China and split and multi-split AC products in the EU, the window AC product weighted average EER remained constant in the US between 2006 and 2010.
2.1.2 Stock of AC Products
In the economies covered by this study, the number of units in use has increased greatly over the past decade, as presented in the table below.
Table 3: Stock of RACs by Economy (million units) and Total Growth Between 2005 and 2010
Country 2005 2009 2010 2030 % (2005-2010)
China 160 N/A 230 N/A 44%
EU 40 N/A 70 130 75%
India N/A 2.5 3.5 30 N/A
Japan 108 N/A 124 N/A 15%
US (only central air conditioners and heat pumps)
59.5 N/A 65.6 N/A 10%
The figures in Table 3 above show that from 2005 to 2010, the RAC stock grew faster in the EU (75% increase) than in China (44% increase) or Japan (15% increase). The stock of central ACs in the US also underwent moderate growth estimated at 10% between 2005 and 2010.
AC stock projections suggest that growth will continue between 2010 and 2030 in India and the EU. In India, rapid growth in AC stock is expected, with projections of growth from 3.5 million units to 30 million units between 2010 and 2030. The stock of AC products in the EU is projected to grow from 70 million units to 130 million units between 2010 and 2030.
2.2
Standards and Labeling Framework
2.2.1 Minimum Energy Performance Standards
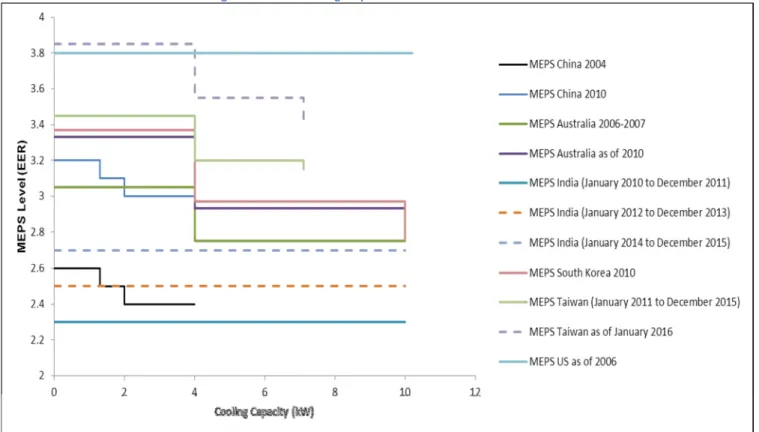
Of the eight economies included in this study, only the EU does not currently have MEPS regulations for RACs. However, the EU is currently considering such measures under the Ecodesign of Energy-Using Products directive. Of the other seven economies, all currently use the energy efficiency ratio (EER) as the metric of energy performance except Japan, which has used the annual performance factor (APF) since 2010. Figure 5 below shows the MEPS levels currently in effect and those planned in the selected economies, except for the EU and Japan. The MEPS levels analyzed were not corrected to take into account test standard differences between countries because this section intends to illustrate the stringency changes of MEPS regulations in the analyzed countries.
Figure 5: MEPS for Single Split RACs in Selected Economies
The figure above suggests that the economies analyzed have used different approaches in establishing their MEPS levels. Some economies have established different MEPS levels according to the cooling capacity of single split ACs. Others have adopted a single MEPS level for single split ACs regardless of their cooling capacity. Despite the different approaches with regard to the establishment and implementation of the MEPS levels, we can observe a general trend toward more stringent requirements over the past years. Moreover, it is worth noting that the planned MEPS levels in economies such as Taiwan and India are more stringent than current levels in many other economies, as shown in the figure above.
In all of the analyzed economies, except in the EU, AC manufacturers or distributors are required to get a certification or registration of their AC products prior to their distribution on the market. Although the EU does not currently have MEPS regulations for RACs, the trade association Eurovent, whose members account for almost 90% of the EU RAC market, operates a voluntary certification system for AC products, including RACs. This scheme is mandatory for all Eurovent members and represents a condition providing that the energy efficiency of the product should be better than class G of the RAC energy efficiency label. In all of the economies analyzed, in the event of non-compliance, the consequences vary from registration or certification cancellation to product removal from the certification program website or market as well as high financial penalties.
2.2.2 Labeling Scheme
Each studied economy has established a mandatory label for RACs. However, some of the economies have a voluntary label as well. Among such economies, the US was the first to implement a labeling program in 1986
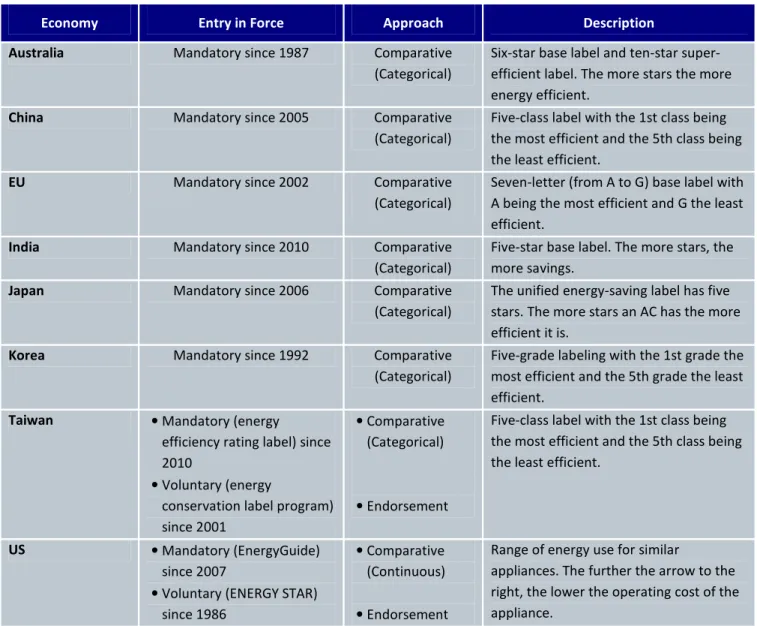
while Taiwan introduced the most recent program in 2010. Table 4 below summarizes the labeling programs in force in participating economies.
Table 4: Air Conditioner Labeling Program in Each Economy
Economy Entry in Force Approach Description
Australia Mandatory since 1987 Comparative
(Categorical)
Six-star base label and ten-star super-efficient label. The more stars the more energy efficient.
China Mandatory since 2005 Comparative
(Categorical)
Five-class label with the 1st class being the most efficient and the 5th class being the least efficient.
EU Mandatory since 2002 Comparative
(Categorical)
Seven-letter (from A to G) base label with A being the most efficient and G the least efficient.
India Mandatory since 2010 Comparative
(Categorical)
Five-star base label. The more stars, the more savings.
Japan Mandatory since 2006 Comparative
(Categorical)
The unified energy-saving label has five stars. The more stars an AC has the more efficient it is.
Korea Mandatory since 1992 Comparative
(Categorical)
Five-grade labeling with the 1st grade the most efficient and the 5th grade the least efficient.
Taiwan •Mandatory (energy
efficiency rating label) since 2010
•Voluntary (energy
conservation label program) since 2001
•Comparative (Categorical)
•Endorsement
Five-class label with the 1st class being the most efficient and the 5th class being the least efficient.
US • Mandatory (EnergyGuide)
since 2007
•Voluntary (ENERGY STAR) since 1986
• Comparative (Continuous)
• Endorsement
Range of energy use for similar
appliances. The further the arrow to the right, the lower the operating cost of the appliance.
The table in Appendix 1 provides the technical characteristics about MEPS in the studied economies. For each economy, it provides information for each MEPS program on its maturity, establishment, implementation, enforcement, and the consequences in case of non-compliance.
2.2.3 Test Procedures
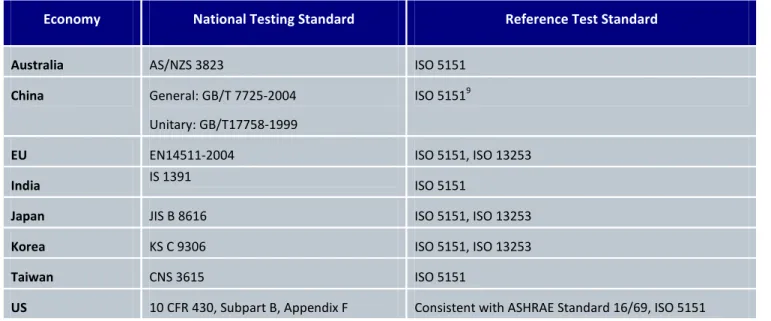
All economies except India have adopted the same international test standard (ISO 5151) as reference for measuring the EE of RACs. India is considering the adoption of ISO 5151 to harmonize its procedure with that implemented in other economies. Table 5 presents the test procedures in force in the studied economies.
Table 5: National Test Procedures for AC Products in the Countries Analyzed
Economy National Testing Standard Reference Test Standard
Australia AS/NZS 3823 ISO 5151
China General: GB/T 7725-2004
Unitary: GB/T17758-1999
ISO 51519
EU EN14511-2004 ISO 5151, ISO 13253
India IS 1391 ISO 5151
Japan JIS B 8616 ISO 5151, ISO 13253
Korea KS C 9306 ISO 5151, ISO 13253
Taiwan CNS 3615 ISO 5151
US 10 CFR 430, Subpart B, Appendix F Consistent with ASHRAE Standard 16/69, ISO 5151
9 GB/T 7725-2004 is not equivalent to ISO 5151-1994. However, the cooling capacity tests are conducted under ISO 5151-1994
3
Benchmarking
3.1
Why Benchmarking Is Needed
Currently, the energy performance of ACs is measured in each economy using a designated test procedure and associated EE metrics. However, these are not identical across economies, making it impossible to directly compare EE metrics and policy settings. This means that policy makers and market actors are unable to ascertain how the EE of products sold in their markets compares with those in peer economies, which in turn inhibits policy and market harmonization efforts and constitutes a barrier to technology diffusion.
The benchmarking component of this study is aimed at overcoming this comparability barrier by deriving conversion metrics that can be applied to adjust AC energy performance measurements made in one economy to the comparable values that would be recorded for the same products were they to be tested and rated in other economies. The resulting analysis produced formulas that can be used for conversion between each of the EE metrics currently in use for air conditioners in selected economies. These formulas are successfully developed for both non-ducted and ducted split ACs, for fixed-speed and variable-speed (inverter driven) units – in other words, for the most common types of AC products sold in international markets. The scope of applicability and resulting margin of error from the use of these formulas are also assessed.
This is the first time that such a comprehensive exercise to develop conversion formulas for both full capacity and seasonally averaged EE metrics has been attempted. While the results are not perfect, they are found to be sufficiently robust to allow for a meaningful comparison of EE policy settings across the selected economies despite their current use of different energy performance test procedures. The conversion formulas are applied to current EE policy settings to assist policy makers by enabling comparison of the relative stringency of requirements for ACs in different economies.
3.2
Air Conditioner Energy Efficiency Metrics
There are presently two main types of metrics in use internationally to rate the EE of ACs: energy efficiency ratios (EERs) and seasonal energy efficiency ratios (SEERs). EER ratings are used to assess full load performance, and are used in many S&L schemes around the world. However, SEERs are a better measure of part-load performance and are increasingly being developed and applied to set MEPS and labeling requirements rather than EERs. This report sets out a basis for cross-economy comparison of both EERs and SEERs, as explained in the remaining portion of this section.
3.2.1 Energy Efficiency Ratio
The EER is the oldest and most widely used AC efficiency metric, and is calculated as the ratio of the cooling capacity to the electricity consumption when measured at full load (i.e., at the maximum deliverable cooling capacity of the AC). This is determined in all economies for a single representative test condition, which is specified by a single set of indoor and outdoor dry and wet-bulb air temperatures that have to be maintained during the test. In practice, the T1 test conditions specified in ISO 5151:1994 have been very widely adopted. Because of this, among the economies that have conditions in line with this standard, the only adjustment
needed to convert between different EER test results is to take account of differences in permitted test tolerances. All the economies addressed in this study have EER test conditions fully aligned with ISO 5151:1994 except for the US, which is a North American Free Trade Agreement (NAFTA) economy. While the test procedure used in NAFTA economies shows standards that are almost in full alignment with ISO 5151 T1 test conditions, there are some slight deviations that introduce a degree of non-comparability in full load EER results. Thus, a correction factor needs to be applied to enhance the comparability of the EER test results produced using ISO T1 test conditions with NAFTA test conditions and any policy requirements based upon them.
In general, there could be a number of factors that produce differences in EER test results for a given unit, including variations in test conditions, standard operating conditions, and tolerances applied in the different jurisdictions. Thus, the objective of this study with respect to EER conversions is to develop conversion formulas that allow the EER recorded under the prevailing test procedure requirements in one specific region to be compared directly with the EER measured under the prevailing test procedure requirements used in another region. In practice, it is found that this can be done via the following linear relationship:
EERZONE1 = α12 * EERZONE2 and vice versa as: EERZONE2 = α21 * EERZONE1
3.2.2 Seasonal Energy Efficiency Ratio10
The EER metric only measures the efficiency of the unit at a sole designated design point, which is the maximum cooling capacity that the device is capable of delivering when measured under a single set of standardized temperature conditions. However, in practice, ACs typically only need to operate at full capacity for a small part of the cooling season, and will run at part load or cycle on and off the rest of the time when not in the off mode. Consequently, reliance on EE metrics based on a single full capacity design point ignores part load performance, which is a large portion of total operation performance, and will tend to yield efficiency performance rankings that are not representative of real seasonal energy performance. This is compounded because performance metrics based solely on full load conditions tend to encourage manufacturers to optimize full load performance at the expense of part load performance. To obviate this problem, SEERs have been created in order to provide an EE measure that is closer to the real EE performance of AC units in situ over the cooling season. SEERs include the impact of variations in the outdoor air temperature and the effect of the cooling load, which is also sensitive to building and user behavioral norms. These metrics typically require several test points to compute a seasonally weighted average efficiency and are intended to give results that are representative of how the AC would perform over a typical cooling season within a representative building type having typical operating characteristics.
Four economies have already adopted specific seasonal energy performance test standards for ACs. The US was the first to develop a SEER standard, followed by Korea and more recently Japan and China. The EU is poised to adopt a SEER metric, which is expected to come into effect in 2012 to coincide with and underpin the
10 The term SEER is used generically in this section to apply to any energy efficiency metric that uses a weighted average of
entering into force of new efficiency regulatory requirements developed within the context of the EU’s Ecodesign directive. Therefore, the SEER benchmarking work conducted in this report examines methods for conversion among seasonal EE test results produced in China, the EU (2012), Japan, Korea, and the US (and by implication other NAFTA economies that operate under regionally harmonized test procedures).
The objective of this study with respect to seasonal EE metrics is to establish relationships that allow SEERs to be converted among the five specific SEER metrics that are in common use in the selected economies. As SEER requirements have more test points and are designed to be representative of local climates, building types, and user behavior, they have more degrees of freedom than EER metrics and it is more complicated to derive formulas to convert from one to another. Nonetheless, the generic conversion formulas between SEER metric X and SEER metric Y can be expressed as:
SEER Y = α * SEER X
The conversion coefficient α is dependent on the technical features of the products being considered, and in particular on the means used to adapt the capacity of the unit to the required building load. The next section discusses the characteristics of seasonal efficiency metrics and the subsequent section covers the development of conversion formulas between metrics.
3.3
Characteristics of the Seasonal Efficiency Metrics
To be able to explain the EE metric conversion formulas and how they were developed, it is first necessary to understand the characteristics of the metrics themselves. This section describes the test specifications used in the seasonal metrics and the related algorithms that are used to derive the SEER metrics. The general principle used to establish the different SEERs is similar in the five economies. The US AHRI 210/240 test standard, which sets out the specifications used to establish the US SEER, is presented as an example. Variations in the methods used in the other economies are then discussed.
3.3.1 US SEER Metric
A single cooling load curve, intended to be representative of a typical US building in a single nationally representative climate, is used to represent the cooling period climate across the US and compute the SEER. The building cooling load (BL) is assumed to be a linear function of outdoor air temperature, as shown below.
j c j T 65 P (FL, Rating) BL(T ) 95 65 1.1 − = −