20
Published by Scientific Research Initiative, 3112 Jarvis Ave, Warren, MI 48091, USAForestry & Agriculture Review 1(1), 2020
ISSN 2693-0269
Characterizing Rainfall and Temperature
Variability in Deder
District
, Eastern
Oromia, Ethiopia
Mengesha Mengistu
Oromia Agriculture Research Institute, Ethiopia P.O. Box 81265, Addis Abeba
Wasihun Gizaw
*Haramaya University P.O. Box 138, Dire Dawa, Ethiopia
Abebe Aschalew
Haramaya University P.O. Box 138, Dire Dawa, Ethiopia
Abdi Jibril
Haramaya University P.O. Box 138, Dire Dawa, Ethiopia
*Corresponding Author’s Email: [email protected]
https://sriopenjournals.com/index.php/forestry_agricultural_review/index
Citation: Mengistu, M., Gizaw, W., Aschalew, A. & Jibril, A. (2020). Characterizing Rainfall and Temperature Variability in Deder District, Eastern Oromia, Ethiopia, Forestry & Agriculture Review, 1(1), 20-29
Research Article Abstract
The main objective of this study was to assess the rainfall and temperature variability in Deder District, Eastern Oromia, Ethiopia. Historical climate (1989-2018) data were obtained from the National Meteorological Agency (NMA). Rainfall and temperature variability and trend analyses were carried out using Instat (v3.37) and XLStat statistical software. Seasonal and annual rainfall totals and numbers of rainy days were highly variable. Belg (Short season) (FMAM) and annual rainfall totals showed a decreasing trend by the factors of -8.2 and -6.25 mm per year respectively but, kirimt (long season) (JJAS) rainfall total increased with 6 mm per year. The average belg onset date, kiremt cessation date, and length of growing (belg-kiremt) period were 15 April, 26 October, and 174 days respectively, and fewer variables. Monthly, seasonal, and annual mean minimum and maximum temperatures were fewer variables. Belg, kiremt and annual maximum mean temperatures were 23.87, 22.56, and 22.75°C respectively, and had increasing trend by the factors of 0.07, 0.02, and 0.01°C per year respectively. Belg, kiremt, and annual mean minimum temperature were 13.65, 14.81, and 13.18°C respectively, and kiremt and annual mean temperatures showed increasing trend by the factors of 0.01 and 0.01°C per year respectively. But belg mean minimum temperature showed a decreasing trend by the factors of -0.02°Cper year.
Keywords: Belg, kiremt, Rainfall, Temperature Variability, Deder District, Ethiopia 1. Introduction
Climate change is one of the biggest environmental challenges in the world. It has become a major concern to society because of its potentially adverse impacts worldwide. There are already increasing concerns globally regarding changes in climate that are threatening to transform the livelihoods of the vulnerable population segments. The earth’s climate has warmed on average by about 0.7◦C over the past 100 years with decades of the 1990s and
21
Published by Scientific Research Initiative, 3112 Jarvis Ave, Warren, MI 48091, USA2000s being the warmest in the instrumental record (Watson, 2010). Climate change and variability are posing the greatest challenge to the humankind at global as well as local levels (Slingo et al., 2005) because it affects the earth's surface widely from tropical to arctic regions and from sea to land and atmosphere (IPCC, 2007).
In general, climate change and variability have differential impacts across locations. The poor developing countries of Africa are among the most vulnerable to experience the worst of climate change impacts. This is because the majority of the population depends on economic activities that are highly exposed and extremely sensitive to climatic variability, and national adaptive capacities are very low due to the high level of poverty, and unfavorable and deteriorating environmental conditions (Kihupi et al., 2015).
Ethiopia, one of the most populous countries in Africa, is vulnerable to climate change and variability due to its high dependence on rain-fed agriculture and relatively low adaptation capacity (Fikreyesus et al., 2014). Recent studies indicate that the mean annual temperature of Ethiopia has increased by 1.3 °C between 1960 and 2006, at an average rate of 0.28 °C per decade and by 0.3°C per decade in the south-west and Amhara in the north (Fazzini et al. 2015). Furthermore, there is a strong variability within Ethiopia's annual and decadal rainfall, which makes country-wide trends difficult to detect in the long-term. A study by Jury and Funk (2013) showed that February to May and June to September rains have declined 15–20% since the mid-1970s and late 2000s in southern, south-western, and southeastern Ethiopia. Similar to other parts of the country, Deder District has been experiencing drier growing periods leading to a reduction in agricultural production. Therefore, the study was aimed to rainfall and temperature variability for the past thirty years (1989-2018).
2. Materials and Methods
2.1 Description of the Study Area
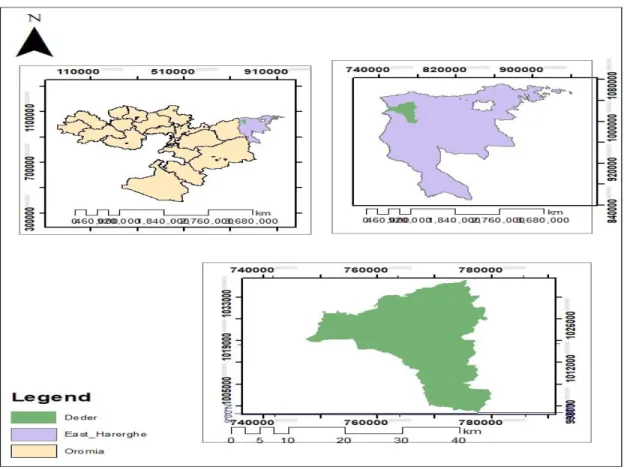
The study was carried out in Deder District, which is one of the major coffee-producing districts
of East Hararghe administrative zone of Oromia Regional State. Geographically, Deder District is
located between 9° 09'- 9° 24' N and 41° 16'- 41° 32' E. It is located 430 km from Addis Ababa, the capital city of Ethiopia. The district is bounded by Meta District to the east, West Hararge
zone to the west, Malka Balo District to the south, andGoro Gutu District to the north Figure 1.
The topography of the woreda characterized by undulated and rugged landscape with
Jamjemxeta considered to be the highest point. Agro-climatically, the district encompasses highland (33%), midland (50%), and lowland (17%) with altitude ranging from 1200 to 3119 m.a.s.l (Deder Agricultural and Natural office 2018). Annual average rainfall ranges from
600mm to 1500 mm. The district gets biannual rainfall, belg (short season), and kiremt (long
season). The average precipitation is generally considered adequate for rain-fed agriculture. But uneven nature of its distribution especially in the lowland and midland parts of the district
has resulted in frequent crop failure. The temperature of the area ranges from 11oC (min.) to
25oC (max.) (Deder District Agricultural Office and NMA, 2018). Cereals and cash crops are
commonly grown in the district. Notable among the cereal crops are sorghum, maize, wheat,
barley. Khat, coffee, and vegetables are known as cash crops. Cattle, goat, and sheep are
among the livestock reared by the community. The district has an estimated total land area of about 67,428 ha of which 39 % is cultivable,3.8% forest and bushland, 3.4% residence and others, and the remaining 39.2% is considered rugged and mountains.
22
Published by Scientific Research Initiative, 3112 Jarvis Ave, Warren, MI 48091, USA Figure 1. Map of the study area 2.1.1 Secondary dataThirty (30) years of rainfall and temperature data for the period 1989-2018 were obtained from the National Meteorological Agency (NMA).
2.1.2 Analyzing variability of temperature and rainfall characteristics
The selected rats were divided into five sets of four (4) rats each and subjected to five different
feed treatments (T1, T2, T3, T4, and T5). The feed treatments were; T1 (grower mash), T2 (yam peel),
T3 (fresh cassava tuber), T4 (sorghum seed), and T5 (guinea grass – Panicum maximum). Each of
the treatments was set up in four (4) replications containing 4 rats (2 males and 2 females) per
replicate. The rats were fed regularly and water provided ad libitum.
The experiment was set up for one hundred and fifty days (150 days). A cage size of 60 cm x 30 cm x 30 cm was used to house each of the treatment replicates.
Rainfall characteristics such as; belg season rainfall onset, kiremt cessation date, length of
growing period (belg - kiremt), monthly, seasonal and annual rainfall totals and number of rain
days and mean minimum and maximum temperature were characterized with Instat (v3.37). In order to examine variability; statistical tools like mean, standard deviation (SD), coefficient of variation (CV) were used in Instat (v 3.37) software. CV was used to classify the degree of temperature and rainfall characteristics variability as less, moderate, and high. When CV < 20% it is less variable, CV from 20% to 30% is moderately variable, and CV > 30% is highly variable
(Gebremichael et al., 2014). Reddy (1990), the stability of rainfall is examined as follows: when
standard deviation < 10 as very high stability, 10-20 as high stability, and 20-40 as moderate stability and > 40 as less stability.
23
Published by Scientific Research Initiative, 3112 Jarvis Ave, Warren, MI 48091, USA 2.1.3 Analysis of Rainfall and Temperature trendMann-Kendall trend test was used to detect the trend and normalized Z-score for the significant test. A score of +1 is awarded if the value in a time series is larger, or a score of -1 is awarded if it is smaller. The total score for the time-series data is the Mann-Kendall statistic, which is then compared to a critical value, to test whether the trend in rainfall is increasing, decreasing, or if no trend in rainfall and temperature were determined using the XLstat software.
3. Results and Discussion
3.1 Monthly, seasonal and annual rainfalls total Variability and trends
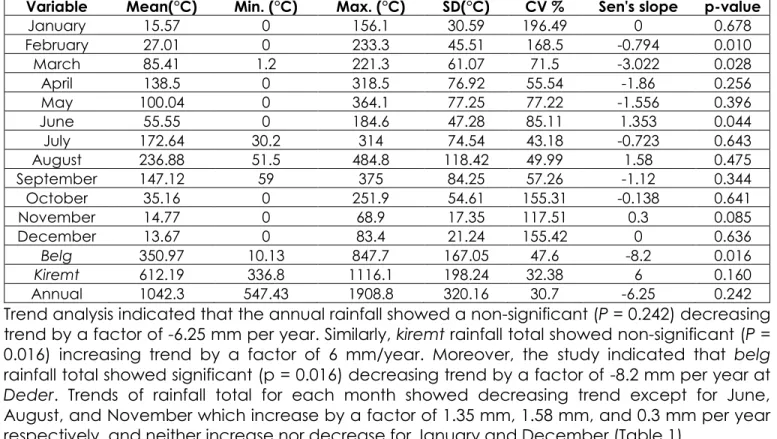
The mean annual rainfall total was 1042.3mm with an SD of 320.16 mm and a CV of 30.7% (Table 1). The minimum and maximum total amounts of rainfall recorded during the study period were
547.43 mm and 1908.8 mm respectively. The main (kiremt) rainy season contributed 46.7% of the
total annual rainfall whereas short (belg) rainy season contributed only 31.3% of the annual
rainfall.
Table 1. Descriptive statistics for monthly, seasonal and annual rainfalls total Variability and trends
Variable Mean(°C) Min. (°C) Max. (°C) SD(°C) CV % Sen's slope p-value
January 15.57 0 156.1 30.59 196.49 0 0.678 February 27.01 0 233.3 45.51 168.5 -0.794 0.010 March 85.41 1.2 221.3 61.07 71.5 -3.022 0.028 April 138.5 0 318.5 76.92 55.54 -1.86 0.256 May 100.04 0 364.1 77.25 77.22 -1.556 0.396 June 55.55 0 184.6 47.28 85.11 1.353 0.044 July 172.64 30.2 314 74.54 43.18 -0.723 0.643 August 236.88 51.5 484.8 118.42 49.99 1.58 0.475 September 147.12 59 375 84.25 57.26 -1.12 0.344 October 35.16 0 251.9 54.61 155.31 -0.138 0.641 November 14.77 0 68.9 17.35 117.51 0.3 0.085 December 13.67 0 83.4 21.24 155.42 0 0.636 Belg 350.97 10.13 847.7 167.05 47.6 -8.2 0.016 Kiremt 612.19 336.8 1116.1 198.24 32.38 6 0.160 Annual 1042.3 547.43 1908.8 320.16 30.7 -6.25 0.242
Trend analysis indicated that the annual rainfall showed a non-significant (P = 0.242) decreasing
trend by a factor of -6.25 mm per year. Similarly, kiremt rainfall total showed non-significant (P =
0.016) increasing trend by a factor of 6 mm/year. Moreover, the study indicated that belg
rainfall total showed significant (p = 0.016) decreasing trend by a factor of -8.2 mm per year at
Deder. Trends of rainfall total for each month showed decreasing trend except for June, August, and November which increase by a factor of 1.35 mm, 1.58 mm, and 0.3 mm per year respectively, and neither increase nor decrease for January and December (Table 1).
3.1.1 Monthly, seasonal and annual rainy days variability and trend
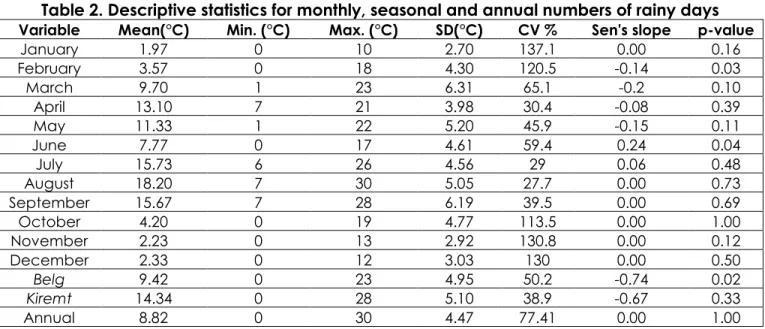
The observed mean number of belg rainy days was 9.42 and highly variable (CV=50.2%) (Table
2). The number of belg rainy days for all months in the belg seasons was highly variable, with a
CV of 120.5%, 65.1%, 30.4%, and 49.3% for February, March, April, and May respectively. The
observed kiremt average number of rainy days was 14.34 and showed high variability
(CV=38.9%). The number of rainy days for June (CV = 59.4) and September (CV=39.5%) was
highly variable in kiremt rainy season but moderately variable in July and August (CV=27.7%
and 29% respectively). On average annual number of rainy days was 104.6 and highly variable (CV=78.425%) for the period of 1989-2018 at the study area. Moreover, the present study
24
Published by Scientific Research Initiative, 3112 Jarvis Ave, Warren, MI 48091, USAthe kiremt season. In line with this, Misgina et al. (2015) reported high variability of belg rainy
days than kiremt rainy days at Southern Tigray.
Table 2. Descriptive statistics for monthly, seasonal and annual numbers of rainy days
Variable Mean(°C) Min. (°C) Max. (°C) SD(°C) CV % Sen's slope p-value
January 1.97 0 10 2.70 137.1 0.00 0.16 February 3.57 0 18 4.30 120.5 -0.14 0.03 March 9.70 1 23 6.31 65.1 -0.2 0.10 April 13.10 7 21 3.98 30.4 -0.08 0.39 May 11.33 1 22 5.20 45.9 -0.15 0.11 June 7.77 0 17 4.61 59.4 0.24 0.04 July 15.73 6 26 4.56 29 0.06 0.48 August 18.20 7 30 5.05 27.7 0.00 0.73 September 15.67 7 28 6.19 39.5 0.00 0.69 October 4.20 0 19 4.77 113.5 0.00 1.00 November 2.23 0 13 2.92 130.8 0.00 0.12 December 2.33 0 12 3.03 130 0.00 0.50 Belg 9.42 0 23 4.95 50.2 -0.74 0.02 Kiremt 14.34 0 28 5.10 38.9 -0.67 0.33 Annual 8.82 0 30 4.47 77.41 0.00 1.00
The number of rainy days for belg rainy season showed a significant (P = 0.02) decreasing trend
by a factor of -0.74 days per year in the study area. Similarly, the number of rainy days for kiremt
season showed a non-significant (P = 0.33) decreasing trend by a factor of -0.67 days per year. The number of rainy days for all months were not significant except February (P = 0.03) and June (P = 0.04). On the other hand, June rain day and July rain day were increased by a factor of 0.24 and 0.06 respectively; February, March, April, and May rainy days were decreased by a factor of -0.14, -0.2, -0.08 and -0.15 respectively, and other months' rainy days were neither increased nor decreased. In line with this, Muluneh (2015) reported decreasing trends in the
number of rainy days for the kiremt season at Srinka and Kobo, and conversely increasing trends
were observed at Kombolcha and Lalibela stations indicating lack of consistent trend in the number of annual rainy days. Moreover, the observed trends were not statistically significant at all studied stations during the study period (1992-2012). High variability and decreasing trend of
belg number of rainy days have been imposing a negative effect on coffee production in the
study area.
3.1.2 Start date of the belg (FMAM) rainy season
The average onset date of belg rainfall for Deder station was 15 April (115 DOY) with CV of
28.82% and SD (33.15) (Table 3). The onset date for Deder station was 92 DOY (5 April) and 192 DOY (4 June) for lower and upper quartile respectively, which indicates that the chance of getting onset on 15 April or below is 25 % (1 out of 4 years) and 4 June or below 75% (3 out of 4 years) and varied between 92 and 192 DOY for minimum and maximum respectively. The earliest possible onset for Deder station was 92 DOY (05 April) while the latest was 192 DOY (June 4) and the optimal planting date was 93 DOY (5 April). The variability of onset date of rainfall was moderate (CV= 28.82%). This result inconsistent with, Study conducted by Mesay
(2006) noted that northern and northeastern regions have a late start of belg rain in April with
standard deviations of 31.9-46.1. The result is also similar to that done by Hoefsloot, (2009) which indicates that the mean onset of rainfall in the Hosaina and Welkite area varies from March 01 to April 20.
25
Published by Scientific Research Initiative, 3112 Jarvis Ave, Warren, MI 48091, USATable 3. Descriptive statistics of onset, cessation, and length of growing period for Deder District
variables Mean Min. Max. SD Q1(25%) Q2(50%) Q3(75%) CV%
Onset date 115 92 192 33.15 93 99 122 28.8 Cessation date 288.7 245 347 20.47 279.8 290 299.3 7.1
LGP 173.7 89 251 38.88 154.5 185.5 200 22.4
3.1.3 Cessation date of the kiremt (JJAS) rainy season
In this area, the minimum and maximum values of Cessation kiremt date of rainfalls recorded
was 245 days (first week of September) and 347 days (early week of December) with a mean (288.7 days, last week of October), SD (20.47 days) and CV (7.09%). For the Cessation date, the respective lower and upper quartiles fall between 279.8 (5 October) and 299.3 DOY (24 October) with a CV of 7.1 %. In other words, the end of the growing period earlier than 279.8 DOY (02 October) was possible only once in every four years and it ends earlier than 299.3 DOY (24 October) three years out of every four years. This finding present hare has parallels with the findings of Study conducted on cessation of the rainy season in the northwest of Ethiopia
revealed that on average the kiremt rain ends on 302, 304, 292, 302 and 317 DOY at Bahir Dar,
Motta, Yetmen, Debre Markos and Dangla, respectively (Taye et al., 2013).
3.1.4 Length of the growing period
The average length of the growing period at the study area was 174 days while the shortest and longest length of the growing period was 89 and 251 days respectively in the study area (Table 3). The respective lower and upper quartiles fall between 154.5 and 200 (minimum of six months, one year out of four years and roughly eight months three years out of four years) with SD and
CV were 38.88 and 22.4% respectively. In line with this, Abiy et al. (2014) reported that the length
of the growing period in the Hosaina area ranges from 124 to 253 days with a mean of 193 days, CV, and SD of 8% and 35 days respectively.
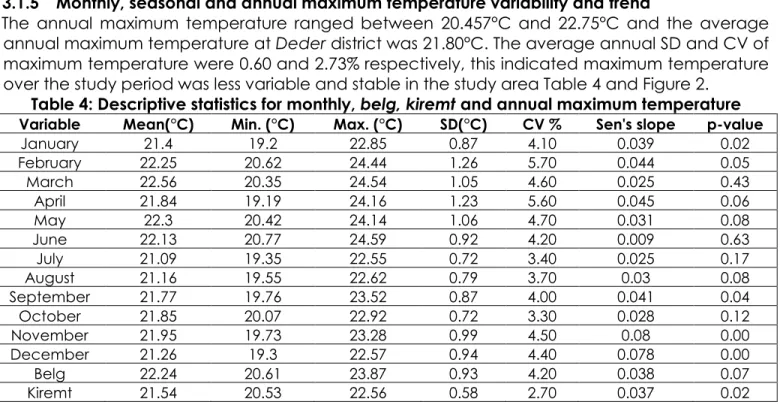
3.1.5 Monthly, seasonal and annual maximum temperature variability and trend
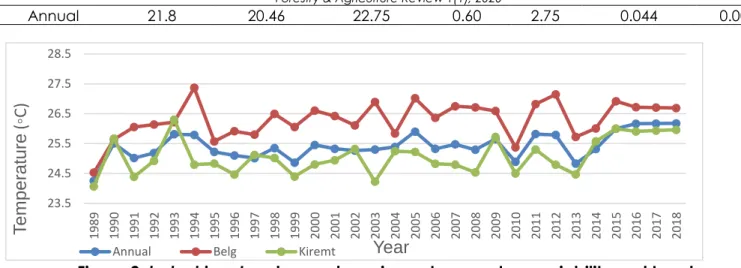
The annual maximum temperature ranged between 20.457°C and 22.75°C and the average
annual maximum temperature at Deder district was 21.80°C. The average annual SD and CV of
maximum temperature were 0.60 and 2.73% respectively, this indicated maximum temperature over the study period was less variable and stable in the study area Table 4 and Figure 2.
Table 4: Descriptive statistics for monthly, belg, kiremt and annual maximum temperature
Variable Mean(°C) Min. (°C) Max. (°C) SD(°C) CV % Sen's slope p-value
January 21.4 19.2 22.85 0.87 4.10 0.039 0.02 February 22.25 20.62 24.44 1.26 5.70 0.044 0.05 March 22.56 20.35 24.54 1.05 4.60 0.025 0.43 April 21.84 19.19 24.16 1.23 5.60 0.045 0.06 May 22.3 20.42 24.14 1.06 4.70 0.031 0.08 June 22.13 20.77 24.59 0.92 4.20 0.009 0.63 July 21.09 19.35 22.55 0.72 3.40 0.025 0.17 August 21.16 19.55 22.62 0.79 3.70 0.03 0.08 September 21.77 19.76 23.52 0.87 4.00 0.041 0.04 October 21.85 20.07 22.92 0.72 3.30 0.028 0.12 November 21.95 19.73 23.28 0.99 4.50 0.08 0.00 December 21.26 19.3 22.57 0.94 4.40 0.078 0.00 Belg 22.24 20.61 23.87 0.93 4.20 0.038 0.07 Kiremt 21.54 20.53 22.56 0.58 2.70 0.037 0.02
26
Published by Scientific Research Initiative, 3112 Jarvis Ave, Warren, MI 48091, USAAnnual 21.8 20.46 22.75 0.60 2.75 0.044 0.001
Figure 2. belg, kiremt and annual maximum temperature variability and trends
The average kiremt maximum temperature ranged between 20.53°C and 22.48°C and kiremt
mean maximum temperature was 21.17°C with SD and CV of 0.58°C and 2.75% respectively.
This indicates that kiremt maximum temperature was less variable and stable. Similarly, belg
maximum temperature ranged between 20.61°C and 23.87°C with mean 21.78°C, SD = 0.93°C
and CV 4.20% at Deder district, this indicates less variable and less stable observation in the
study area.
Mann-Kendall test statistics value of Sen’s slope indicated that belg maximum temperature
revealed statistically not significant (P = 0.07) at P < 0.05 and an increasing trend by a factor of
0.038°C per year. Similarly, the value of Sen's slope indicated significantly (P = 0.02) and an increasing trend by a factor of 0.037°C per year. The annual maximum temperature showed a
statistically significant (P = 0.001) and increasing by a factor of 0.044°C per year. The monthly
maximum temperature showed a decreasing trend from November to January. However, the maximum temperature showed an increasing trend from July to September but, the trend is significant for January, November, and December only. This result corroborates with the evidence suggested that Africa is warming faster than the global average and African drylands are likely to continue to warm (Boko et al., 2007).
3.2.5 Monthly, seasonal and annual minimum temperature variability and trend
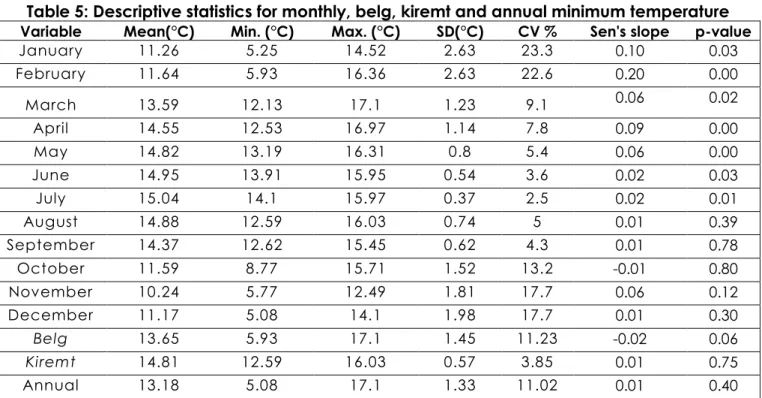
The average annual minimum temperature ranged between 5.08°C and 17.10°C and an
annual average of minimum temperature at Deder District was 13.18°C with a CV of 11.02%
(high stability) and SD of 1.33°C (Table 5 and Figure 3). This indicates that annual minimum temperature over the study period was less variable and stable in the study period but, more
variable than average annual maximum temperature (CV=2.73%). Belg average minimum
temperature ranged 5.93°C to 17.10°C and belg average minimum temperature at Deder was
13.65°C with CV and SD 1.45% (very high stability) and 11.23°C respectively but, less variable
than Belg maximum temperature (CV=4.2%). The minimum temperature was less variable for all
month except for January and February (moderately variable). The average kiremt minimum
temperature ranged between 12.59°C and 16.03°C and kiremt average of minimum
temperature at Deder district was 14.81°C with CV and SD 3.85% and 0.57°C respectively, this
indicates that kiremt minimum temperature was less variable and also highly stable but, more
variable than average Kiremt maximum temperature (CV=2.75%).
Mann-Kendall test statistics value of Sen’s slope indicated that belg minimum temperature
revealed a decreasing trend by a factor of -0.02°C per year (Table 5). The belg minimum
temperature revealed a statistically not significant trend (P = 0.06) (Table 5). Similarly, the value
23.5 24.5 25.5 26.5 27.5 28.5 1989 1990 1991 1992 1993 1994 1995 1996 1997 1998 1999 2000 2001 2002 2003 2004 2005 2006 2007 2008 2009 2010 2011 2012 2013 2014 2015 2016 2017 2018
T
e
m
p
e
ratu
re
(
◦
C)
Year
27
Published by Scientific Research Initiative, 3112 Jarvis Ave, Warren, MI 48091, USAof Sen’s slope indicated an increasing trend of kiremt minimum temperature by a factor of 0.01
°C per year. But the trend was statistically not significant (P = 0.75).
Table 5: Descriptive statistics for monthly, belg, kiremt and annual minimum temperature
Variable Mean(°C) Min. (°C) Max. (°C) SD(°C) CV % Sen's slope p-value
January 11.26 5.25 14.52 2.63 23.3 0.10 0.03 February 11.64 5.93 16.36 2.63 22.6 0.20 0.00 March 13.59 12.13 17.1 1.23 9.1 0.06 0.02 April 14.55 12.53 16.97 1.14 7.8 0.09 0.00 May 14.82 13.19 16.31 0.8 5.4 0.06 0.00 June 14.95 13.91 15.95 0.54 3.6 0.02 0.03 July 15.04 14.1 15.97 0.37 2.5 0.02 0.01 August 14.88 12.59 16.03 0.74 5 0.01 0.39 September 14.37 12.62 15.45 0.62 4.3 0.01 0.78 October 11.59 8.77 15.71 1.52 13.2 -0.01 0.80 November 10.24 5.77 12.49 1.81 17.7 0.06 0.12 December 11.17 5.08 14.1 1.98 17.7 0.01 0.30 Belg 13.65 5.93 17.1 1.45 11.23 -0.02 0.06 Kiremt 14.81 12.59 16.03 0.57 3.85 0.01 0.75 Annual 13.18 5.08 17.1 1.33 11.02 0.01 0.40
Annual minimum temperature showed an increasing trend by the factor of 0.01°C per year (0.1°C/decade). The trend of annual minimum temperature showed a statistically not significant
trend (P = 0.40) at P < 0.05 (Table 5). All month’s average minimum temp trend shows increasing
trend except October. All are significant at P < 0.05 except August, September, October, November, and December. In agreement with this result, the analysis of historical climate data across Ethiopia has presented increasing rates of 0.13°C/decade and 0.37°C/decade for mean annual minimum and maximum temperature respectively (NMA, 2007).
Figure 3. belg, kiremt, and annual minimum temperature variability and trends 4. Conclusion
This study was undertaken to assess rainfall and temperature variability and trend in the past 1989-2018 intervals. Rainfall and temperature data were collected from the National Meteorology Agency of Ethiopia. In order to examine the temperature and rainfall variability of
10.5 11 11.5 12 12.5 13 13.5 14 14.5 1989 1990 1991 1992 1993 1994 1995 1996 1997 1998 1999 2000 2001 2002 2003 2004 2005 2006 2007 2008 2009 2010 2011 2012 2013 2014 2015 2016 2017 2018 T emperat ure ( ◦ C) Year
28
Published by Scientific Research Initiative, 3112 Jarvis Ave, Warren, MI 48091, USADeder district Statistical tools like mean, standard deviation, coefficient of variability (CV), and p-value comparison were used in Instat(v3.37) statistical software.
In the context of the above-mentioned objectives, the study analyzed the following important
rainfall features; rainfall belg onset, kiremt cessation date, length of growing period (belg -
kiremt), monthly, seasonal and annual rainfall totals and number of rain days and mean temperature were characterized with Instat (v3.37). The observed seasonal and annual rainfall
totals were highly variable. Belg and annual rainfall totals decrease non-significantly in the study
area. The numbers of seasonal kiremt and belg rainy days at the study area were moderately
variable. Moreover, the number of rainy days was more variable during the belg season than
during the kiremt season.
The average onset date of belg rainy season, secession date of kiremt season rainfall, and
length of the growing period was 15 April (115 DOY), 28 October (288 DOY), and 173
respectively. The variability of observed onset date of belg rainy season, secession date of
kiremt season, and length of the growing period was less variable. The average maximum
temperature of belg, kiremt and annual were; 21.78, 21.17, and 21.8°C with CV of 4.2%, 2.75%,
and 2.73% respectively. The average minimum temperature of belg, kiremt and annual were;
13.65, 14.81, and 13.18°C with CV of 11.23, 3.85, and 11.02°C respectively. Belg, kiremt and
annual maximum temperature revealed an increasing trend by the factors of 0.038, 0.037, and
0.044°C per year respectively. Similarly, kiremt and annual minimum temperature had revealed
an increasing trend by the factors of 0.01 and 0.01°C per year respectively. Belg, minimum
temperature had revealed a decreasing trend by the factors of -0.02°C.
Authors’ Contribution: All the authors jointly contributed to planning, data collection, and writing the article.
Conflicts of Interest: The authors declare no conflict of interest. References
Gebremichael, A., Quraishi, SH., and Mamo, G. (2014). Analysis of Seasonal Rainfall Variability for Agricultural Water Resource Management in Southern Region, Ethiopia. Analysis 4(11):56-79.
Hirsch, R. M., Helsel, D. R., Cohn, T.A., and Gilroy, E. J.(1993). Statistical treatment of hydrologic data. In Handbook of Hydrology (ed. Maidment, D. R.), McGraw-Hill, New York, 1993, pp. 17.1–17.52.
Hoefsloot, p. (2009). LEAP (Livelihood Early Assessment Protection) version 2.1 for Ethiopia. By collaborative action of FAO, World Bank, and World food programme. The Netherlands.
IPCC (2007). Climate Change: Impacts, Adaptation, and Vulnerability, Contribution of Working Group II to the Fourth Assessment Report of the Intergovernmental Panel on Climate Change (Cambridge Univ Press, Cambridge, UK), in press.[Solomon, S., D. Qin, M. Manning, Z. Chen, M. Marquis K.B.M. Tignor and H.I Miller (eds)]. Cambridge University Press, Cambridge, United Kingdom, and New York, NY, USA, 996 pp.
Jury, M. R., & Funk, C. (2013). Climatic trends over Ethiopia: regional signals and drivers. International Journal of Climatology, 33(8), 1924-1935.
Kihupi, M., Emmanuel E., Chingonikaya, and Chritopher. (2015).Smallholder farmers' perception of climate change versus meteorological data in semi-arid areas of Iringa District, Tanzania. Journal of Environment and Earth Science, 5(2): 137-147.
Messay, A. (2006). The Onset, Cessation, and Dry Spells of the Small Rainy Season of Ethiopia. National Meteorological Agency, Addis Ababa, Ethiopia. Meteorological Research in Eastern and Southern Africa, Nairobi, Kenya,
UCAR, 53–57
Misgina, G., Abrha, A., and Simhadrib, S. (2015). Effects of rainfall variability on the production of five major cereal crops in southern tigray, northern Ethiopia, 16th March 2015.
Muluneh, G. (2015). Analysis of Past and Future Intra-Seasonal Rainfall Variability and its Implications for Crop Production in the North Eastern Amhara Region, Ethiopia. \
NMA. (2007). Final Report on Evaluation Criteria for Identifying High Priority Adaptation Activities prepared by B and M Development Consultants for NMA. Addis Ababa, Ethiopia.
Slingo, Julia M. (2005). "Introduction: food crops in a changing climate." Philosophical Transactions of the Royal Society of London B: Biological Sciences 360.1463 (2005): 1983-1989.
29
Published by Scientific Research Initiative, 3112 Jarvis Ave, Warren, MI 48091, USATaye, M., Zewdu, F, and Ayalew, D. (2013). Characterizing the climate system of Western Amhara, Ethiopia: a GIS approach. American Journal of Research Communication .1(10): 319-355.
Watson, B. (2010). Climate change: An environmental, development, and security issue. Livestock and global climate change international conference proceedings, Tunisia, (17-20 May 2008) 6-7.
Zuluaga, V., Labarta, R. A., &Läderach, P. (2015). Climate change adaptation: The case of the coffee sector in Nicaragua.
© 2020 by the authors. Licensee Research & Innovation Initiative, Michigan, USA. This article is an open-access article distributed under the terms and conditions of the Creative Commons Attribution (CC BY) license (http://creativecommons.org/licenses/by/4.0/).