Parameter optimization of micro ECDM process of borosilicate glass
Mohit Vishnoi1*, A.N. Veerendra Kumar1, S. Senthil Murugan2
1 Department of Mechanical Engineering, J S S Academy of Technical Education, Noida 201301, India 2 Department of Mechanical Engineering, Mepco Schlenk Engineering College, Sivakasi 626005, India
Corresponding Author Email: [email protected]
https://doi.org/10.18280/eesrj.050203 ABSTRACT
Received: April 25 2018 Accepted: June 3 2018
Electro Chemical Discharge Machining Process (ECDM) is a prominent hybrid machining process used in distinctness machining of hard and brittle non-conducting materials. ECDM has been exploited to fabricate micro-holes in non- conductive brittle materials. An experiment has been conducted on ECDM for micro drilling operation on borosilicate glass material according to the Taguchi Orthogonal Array (L9) technique in order to ascertain the effect of certain variables in the same manner with material removal rate (MRR) & tool wear rate (TWR). In superintending the machining performance, signal to noise ratio (S/N ratio) was calculated to find out the involvement in the main machining variables, such as applied voltage, electrolyte concentration and inter electrode gap. During the experiments, the non-conducting and highly brittle borosilicate glass material is used as a work-piece and NaOH as electrolyte solution. In addition to that, Graphite and Tungsten were used as cathode and anode respectively. In this research of Taguchi method was utilized to optimize the process variables which affect MRR and TWR. From main effect plot through Minitab software, it turns out that the inter-electrode gap has the supreme affect on MRR and TWR.
Keywords:
electro chemical discharge machining (ECDM), material removal rate (MRR), tool wear rate (TWR), taguchi method
1.INTRODUCTION
Electro Chemical Discharge Machining (ECDM), is a hybrid manufacturing process combination of chemical reaction and electro sparking. This process is employed for micromachining of non-conductive materials using auxiliary electrodes. The ECDM process consists of cathodic tool and auxiliary electrode and both are separated by a gap filled with NaOH electrolyte and applied DC power between them to achieving both electro chemical dissolution and electro discharge erosion on the workpiece. The electro chemical reaction in electrolyte helps formation of hydrogen gas and vapour bubbles, and the breakdown of insulating layer of gas bubbles will be tacks place by applying electro discharge action thorough DC power supplied between the auxiliary electrode and tools.
ECDM process is applicable for machining non-conductive materials like glass and ceramic materials and studying the influence of electrolyte concentration, voltage and tool tip geometry on material removal rate and condition of machined surface are necessary [1]. Electro Chemical Spark Machining (ECSM) process has been successfully applied for cutting of quartz using a controlled feed and a wedge edged tool [2].
The ECSM processes with reverse polarity conjointly ECSM with direct polarity have been used to machine quartz plates and the results proved that the surface quality was improved compared to that from the conventional Electro-discharge machining. Micro-Electro chemical Discharge Machining (MECDM) was developed for improving the machining of 3D micro-structures of glass. The discussion on the alliance between voltage and current is crucial in different kinds of Electrolyte with varying concentrations [3]. Synchronized and transient measurements revealed the
discrete nature of the ECDM process [4]. While investigation of experiments revealed that the sparking occurs at the tool electrode interface [5]. It is important to study the wettability and machining characteristics of different tool electrode materials and their impact on gas film formation and also their machining performance [6]. The various alkaline solutions were considered as electrolyte in ECDM. It was noticed that the KOH electrolyte contributes a smaller machining gap than NaOH solution which results in increase of MRR [7]. ECDM can be considered to machine the surface texture of glass and micro-channels and also showed that the tool-work piece gap influences the depth of the machined micro-channels [8]. The curved surface of the spherical tool electrode reduces the contact area between the electrode and the work piece which results in increasing the discharge frequency and reducing the machining time [9]. It is required to consider the process variables like critical voltage and current needed to develop a theoretical model of discharge phenomenon [10]. Developing empirical mathematical model is helpful to show the influence of process variables on the electrode TWR, MRR, and the shape exactness of the machined hole [11]. Apart from this, electro mechanical systems are used in energy harvesting applications also [12].
2.EXPERIMENTAL DETAILS
Auto transformer was used to synchronize the voltage from 30 V to 55 V. Tungsten electrode of 0.5mm diameter was cast-off as Cathode (-). Graphite electrode of 15mm diameter was used as anode (+). Rectifiers of capacity 32A were considered to convert A.C into D.C. Voltmeter are used to measure voltage across anode and cathode. Ammeter is used to measure
Environmental and Earth Sciences Research Journal
Vol. 5, No. 2, June, 2018, pp. 48-52
current in circuit. Sodium Hydroxide (NaOH) was cast-off as an electrolyte by reason of it reduces dissolution of graphite at anode compared to other electrolytes and it is more stable than Potassium Hydroxide (KOH).
The EC reaction in electrolyte aid in hydrogen gas and vapour bubbles causation. The EDA occurs between tools and work piece owing to break down of insulating layer of gas bubbles as soon as DC power supply is sued between tool and auxiliary electrode. The tool is immersed in the electrolyte and the level of the electrolyte is curbed just around 2-6 mm above the tool tip. The auxiliary electrode is also immersed in the electrolyte. As the voltage is raised, quite violent sparking occurs. The non-conducting material is placed at the sparking zone. The tool always touches the work piece which is controlled by the gravity feeding arrangement. The sparking action results in material removal from the non-conducting ceramics due to melting and vaporisation caused by the heat energy of the spark generated. An inter electrode gap between the tool and the auxiliary electrode is maintained during machining and that can be adjusted by the installed motors.
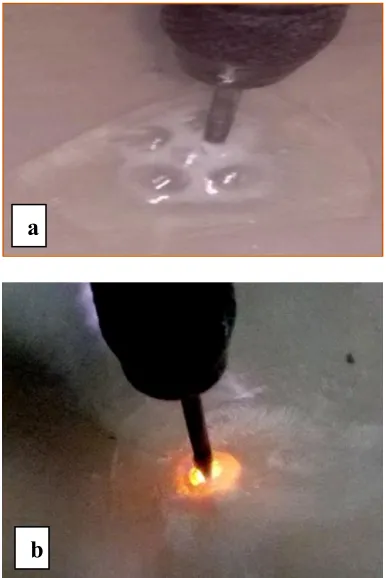
Fig. 1a shows the Experimental set-up of ECDM process. The apparatus has been fabricated with steel frame to hold the electrode and the motional utilities due to which the tool electrode can have motion in horizontal as well as vertical axis. The gap between the piece to be machined and tool electrode was being maintained by the vertical motion motor. A separate glass tank has been used to fill the electrolyte during machining.
Figure 1. Experimental set-up of ECDM with graphite electrode
Initially the voltage is increased to 30-35 volt the bubbles formation begun due to electrolysis. When voltage reaches 50-55 volts the heat is generated is also increases due to the spark
and the material removal starts at high rate. Figure 1b shows the spark generation using graphite electrode. Table 1 reveals the facts of electrolyte, work piece and tools used during experimentation.
Table 1. Details of electrolyte, work piece and tools
Electrolyte
employed: Sodium Hydroxide (NaOH) + Distilled Water
Work piece: Borosilicate (80% silica,13% boric acid, 4%
sodium oxide, 2-3% aluminum oxide) Work piece
thickness:
2 mm
Tools used: Tungsten (0.5mm dia.), Graphite (15mm dia.)
The Fig. 2 shows visual pictures of bubbles formation and arc generation at the electrode tip as the voltage is increased gradually from 30V to 45V. In Figure 2a, at 35V the bubble formation starts and at the same time the arc is about to generate. At 45 V Continuous arc generation and brown ring formation around work piece are seen in Fig. 2 b.
Figure 2. Visual pictures of bubbles formation and arc generation during experiment
The images were taken to show the drilled blind and through holes on borosilicate work piece as shown in Fig. 3.
Figure 3. Blind and through holes on work piece
a
b
a
3. MEASUREMENT OF MACHINING PERFORMANCE
Experiments were performed as per composed experimental draft and the performance or responses were investigate for each experimental run. The amount of MRR was measured by taking difference in weight of the machined piece before machining weight (w1) and after machining weight (w2) and divided by machining time. The MRR & TWR can be evaluated by Equation (1) as:
MRR or TWR = (w1-w2)/T (1)
where, T - Machining time w1- Weight Before machining w2- Weight After machining
4. PROCESS PARAMETER & LEVEL SELECTION
Electrolyte concentration, voltage applied across the electrode and inter-electrode gap identifies the critical process variables. Each of these parameters is varied by selecting three parametric levels as shown in following Table 2.
Table 2. ECDM process variables & levels
Variables (symbols, units) Parametric levels
1 2 3
DC supply voltage (Volt) 45 50 55
Electrolyte concentration (gm/100 ml) 30 40 50
Inter-Electrode Gap (cm) 2 4 6
Borosilicate glass of 2mm thickness is used for conducting the experiments based on Taguchi L9 method to optimize the process parameters.
5. EXPERIMENTATION
Table 3. Calculation of MRR and TWR
Vol. (V) Con. (gm /100 ml) Int. elec. gap (cm) Material Initial weight (gm) Material Final weight (gm)
45 30 2 1.97 1.96
45 40 4 1.58 1.57
45 50 6 0.84 0.83
50 30 4 0.86 0.84
50 40 6 1.55 1.54
50 50 2 1.17 1.16
55 30 6 1.58 1.57
55 40 2 1.74 1.73
55 50 4 0.87 0.86
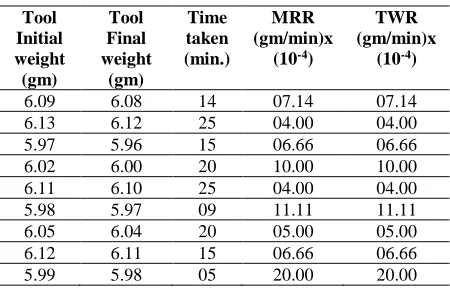
Experimentation was done to record the outputs of MRR & TWR by varying the input parameters such as voltage, concentration and electrode tool tip distance, as tool tip distance is considered along with changing voltage and concentration. Table 3 shows observed reading and calculated MRR and TWR by varying input parameters using Taguchi
orthogonal L9 array, the material removal rate and tool wear rate were calculated by considering initial weight and change in weight with respect to time taken. It has been tabulated in table 4.
Different graphs have been plotted to analyze the effect of various ECDM parameters on the machining characteristics e.g. material removal rate, tool wear rate. The test results are analyzed to identify the most effective parameters of the developed ECDM setup.
Table 4. Calculation of MRR and TWR
Tool Initial weight (gm) Tool Final weight (gm) Time taken (min.) MRR (gm/min)x
(10-4)
TWR (gm/min)x
(10-4)
6.09 6.08 14 07.14 07.14
6.13 6.12 25 04.00 04.00
5.97 5.96 15 06.66 06.66
6.02 6.00 20 10.00 10.00
6.11 6.10 25 04.00 04.00
5.98 5.97 09 11.11 11.11
6.05 6.04 20 05.00 05.00
6.12 6.11 15 06.66 06.66
5.99 5.98 05 20.00 20.00
6. OPTIMIZATION OF PROCESS PARAMETERS USING TAGUCHI METHOD
Customary experimental design procedures are too complicated and not easy to use. A large number of experimental works have to be carried out when the number of process parameters increases. To solve this problem, the Taguchi method uses a special design of orthogonal arrays to study the entire parameters with only a small number of experiments. Taguchi method have been widely utilized in engineering analysis and consist of a plan of experiments with the objective of acquiring data in a controlled way, in order to obtain information about the behavior of a given process. The greatest advantage of this method is to reduce the effort in conducting experiments, reducing the cost, and discovering significant factors quickly. Taguchi’s robust design method is a powerful tool for the design of a high-quality system. In this method, values of Signal-to-Noise ratio are calculated for each of the output parameter. The steps applied for Taguchi optimization in this study are i) Select noise and control factors ii) Select Taguchi orthogonal array iii) Conduct Experiments iv) MRR & TWR measurement v) Analyze results (Signal-to-noise ratio) vi) Predict optimum performance vii) Confirmation experiment.
The optimized process parameters are obtained on the basis of signal to noise ratio through Taguchi methodology by using the followings (Equation (2)-(3)) are considered to the standard and widely accepted.
Higher- the values indicates better Material removal rate,
S/N ratio (MRR) =-10 log10 [∑(1/y²)/n] (2)
where, MRR= material removal rate n= number of measurements (here, n=1) y= output parameters,
Lower- the values indicates better Tool Wear rate,
where, TWR=tool wear rate
n=number of measurements (here, n=1) y=output parameters.
In this study nine experiments were performed at different variables. For this, Taguchi L9 orthogonal array was exercised, which has nine rows identical to the number of tests, with three columns at three levels. For obtaining the values of output parameters, machining was done on the work piece till a steady spark was obtained. This steady spark leads to the formation of a brown colored ring which indicates the formation of through hole in the work piece.
7. RESULTS AND DISCUSSION
Minitab software has been used to generate response values for signal to noise ratios and to calculate rank and delta values. The same has been shown in table 5. Response values indicates larger the Signal to Noise Ratio, better the Material Removal Rate. Delta is basically the difference of the lowest and highest value which assigns the rank and importance of that factor.
Table 5. Response values for signal to noise ratios
Level Voltage
(V) Inter-Electrode Gap (IGP) Concentration (EC) Electrolyte
1 15.19 17.02 18.15
2 17.65 13.52 19.35
3 18.82 21.13 14.16
Delta 3.63 7.62 5.19
Rank 3 1 2
The Fig. 4 shows the graph of Taguchi analysis through Minitab software that gives the values of parameters obtained.
Figure 4. Main effects plot of MRR for S/N ratios
7.1 Effect of process parameters on material removal rate
From the main effect plot in Fig. 4 it can be seen that as inter electrode gap increased the material removal rate is increases, at the same time voltage is having significant effect on MRR as voltage is increasing MRR is also increasing because due to higher ionization and deionization which result to high erosion and thermal discharging so finally the values of optimum
levels of MRR are V3 (18.82), IGP3 (21.13) and EC2 (19.35) which can be interpret with the help of figure 4 and table 5.
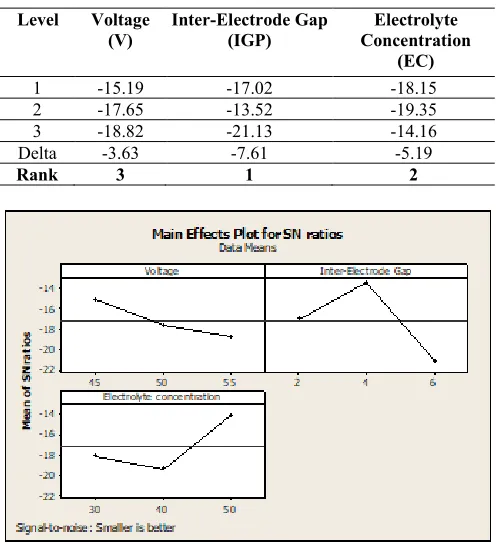
Table 6 shows the TWR versus voltage, inter- electrode gap, electrolyte concentration. The figure 5 shows the plot of TWR for S/N ratios that gives the values of parameters obtained.
Table 6. Response table for signal to noise ratios smaller is better
(TWR)
Level Voltage
(V)
Inter-Electrode Gap (IGP)
Electrolyte Concentration
(EC)
1 -15.19 -17.02 -18.15
2 -17.65 -13.52 -19.35
3 -18.82 -21.13 -14.16
Delta -3.63 -7.61 -5.19
Rank 3 1 2
Figure 5. Main effects plot of TWR for S/N ratios
7.2 Effect of process parameters on tool wear rate
From the main effect plot in Fig. 5, it can be seen that as inter electrode gap increased the Tool Wear rate is decrease, voltage gives low TWR so finally the values of optimum levels of TWR are V3(-18.82), IGP3(-21.13) and EC2(-19.35) which can be interpret with the help of figure 5 and table 6.
8. CONCLUSIONS
Micro drilling on the borosilicate glass was successfully carried out by ECDM. The application of the Taguchi Optimization for investigating the effect of parameters (Material removal rate, tool wear rate and inter-electrode gap) on drilling of non-conducting borosilicate glass was clearly explained.
The analysis of experimental results is carried out using Taguchi orthogonal L9 array and the best of effect of parameters during drilling is obtained by using Minitab software.
REFERENCES
[1] Bhattacharya B, Doloi BN, Sorkhel SK. (1999). Experimental investigation into electro-chemical discharges machining (ECDM) of non- conductive ceramic materials. Journal of Material Processing
Technology 95: 145-154.
http://dx.doi.org/10.1016/S0924-0136(99)00318-0 [2] Jain VK, Adhikary S. (2008). On the mechanism of
material removal in electrochemical spark Machining of quartz under different polarity conditions. Journal of Materials Processing Technology 200: 460–470. http://dx.doi.org/10.1016/j.jmatprotec.2007.08.071 [3] Raghuram V, Pramila T, Srinivasa YG, Narayanasamy
K. (1995). Effect of the circuit parameterson the electrolytes in the electrochemical discharge phenomenon. Journal of Materials Processing
Technology 52: 301–318.
http://dx.doi.org/10.1016/0924-0136(94)01615-8 [4] Kulkarni A., Sharan R, Lal GK. (2002). An experimental
study of discharge mechanism in Electrochemical discharge machining. International Journal of Machine
Tools and Manufacture 42: 1121–1127.
http://dx.doi.org/10.1016/S0890-6955(02)00058-5 [5] McGeough AB, Khayry M, Munro W. (1983).
Theoretical and experimental investigation of the Relative effects of spark erosion and electrochemical dissolution in electrochemical arc machining. Annals of the CIRP 31: 113–118. https://doi.org/10.1016/S0007-8506(07)63373-3
[6] Yang CK. (2010). Effect of surface roughness of tool electrode materials in ECDM performance. International Journal of Machine Tools & Manufacture 50: 1088– 1096. https://doi.org/10.1016/j.ijmachtools.2010.08.006 [7] Cao XD. (2009). Micro-structuring of glass with features
less than 100µm by electrochemical discharge
machining. Precision Engineering 33: 459–465. https://doi.org/10.1016/j.precisioneng.2009.01.001 [8] Jana D. (2012). Micro-texturing channel surfaces on
glass with spark assisted chemical engraving. International Journal of Machine Tools & Manufacture
57: 66–72.
https://doi.org/10.1016/j.ijmachtools.2012.01.012 [9] Yang CK. (2011). Enhancement of ECDM efficiency
and accuracy by spherical tool electrode. International Journal of Machine Tools & Manufacture 51: 528–535. https://doi.org/10.1016/j.ijmachtools.2011.03.001 [10] Basak I, Ghosh A. (1997). Mechanism of material
removal in electrochemical discharge machining: a theoretical model and experimental verification. Journal of Materials Processing Technology 71: 350–359. https://doi.org/10.1016/S0924-0136(97)00097-6 [11] Coteaţă M. (2008). Electrochemical discharge
machining of small diameter holes. International Journal
of Material Forming 1: 1327-1330.
https://doi.org/10.1007/s12289-008-0148-3
[12] Indrajit S, Mukherjee S, Biswas K. (2017). A review of energy harvesting technology and its potential applications. Environmental and Earth Sciences
Research Journal 4(2): 33-38.
https://doi.org/10.18280/eesrj.040202
NOMENCLATURE
DC Direct current
NaOH Sodium hydroxide
KOH Potassium Hydroxide
S/N ratio Signal to noise ratio
TWR tool wear rate
MRR material removal rate