AUSTRALIAN JOURNAL OF BASIC AND
APPLIED SCIENCES
ISSN:1991-8178 EISSN: 2309-8414 Journal home page: www.ajbasweb.com
Open Access Journal
Published BY AENSI Publication
© 2016 AENSI Publisher All rights reserved
This work is licensed under the Creative Commons Attribution International License (CC BY). http://creativecommons.org/licenses/by/4.0/
To Cite This Article: Nusa Sebayang, Harnen Sulistio, Ludfi Djakfar and Achmad Wicaksono., The Development of Traffic Light Offset Signal Model Optimization at Traffic Control System (Atcs) Network in the Form of Grid Using Cell Transmission Model. Aust. J. Basic & Appl. Sci., 10(6): 55-61, 2016
The Development of Traffic Light Offset Signal Model Optimization at Areal Traffic
Control System (ATCS) in the Form of Grid Using Cell Transmission Model
1Nusa Sebayang, 2Harnen Sulistio, 3Ludfi Djakfar and 3Achmad Wicaksono
1Lecturer at Civil Engineering Program,Nasional Institut of Technology Malang,Malang, Indonesia and Doctoral Candidate, Brawijaya
University, Department of Civil Engineering, Indonesia
2 Professor at Civil Engineering Program, Faculty of Engineering Science, Brawijaya University, Malang, Indonesia 3,
Associate Professor at Civil Engineering Program, Faculty of Engineering, Brawijaya University. Malang, Indonesia
Address For Correspondence:
Nusa Sebayang, Lecturer at Civil Engineering Program,Nasional Institut of Technology Malang,Malang, Indonesia and Doctoral Candidate, Brawijaya University, Department of Civil Engineering, Indonesia.
E-mail:[email protected]
A R T I C L E I N F O A B S T R A C T Article history:
Received 12 February 2016 Accepted 12 March 2016 Available online 20 March 2016
Keywords:
ATCS, CTM, Optimum Offset, Minimum Delay
Some cities in Indonesia has implemented ATCS system, but the utilization of ATCS has not been optimized because the signal arrangement between the intersections is less coordinated. The objective of this research is to develop optimization offset signal model used Cell Transmission Model (CTM). The application of the developed model is attempted to use the artificial data on a grid network with 9 intersections. The results of the model application on the network showed the optimum offset signal with minimum total delay reached 51033 seconds. The results of model testing on the coordination of the two intersection signals on Sunandar Prio Sudarmo street in Malang namely Prio Sunandar Sudarmo - Sulfat intersection and Prio Sunandar Sudarmo - Ciliwung intersection showed that the delay differences of model resulted from the observations was 3%, so that the proposed model can be used
INTRODUCTION
Traffic congestion problems of urban areas in Indonesia tend to increase. This is due to the vehicle growth rate which is higher than the improvement of the road network infrastructure. Generally, the initial congestion occurs at the intersection. This is because the existing intersection is largely a plot intersection and the traffic flow is controlled using traffic light signal. Traffic light signal control systems are currently using isolated system. This system does not work well if the distance between the intersection controlled by traffic light signals is too close. Vehicles will be stopped repeatedly due to getting a red signal while crossing some of the signalized intersections. Some cities in Indonesia have made efforts to address traffic congestion by applying ATCS (Area Traffic Control System), but the system has not been optimally used. Although ATCS system has been widely used, traffic light signal coordination has not been used on the adjacent intersections
conducted research on the signal optimization of signaled intersection at a fixed time, using a modified genetic algorithm (GA). The results of the study showed that the delay can be reduced by 13% to 30%. Furthermore, Lin et al (2010) conducted research to maximize the progress of traffic flow across the coordinated intersection. The weakness of this model is that it can not be used on oversaturated traffic flow. Furthermore, Zechman at al. (2010) conducted research on network signal coordination on oversaturated traffic flow. The study was conducted using Simple Genetic Algorithm (SGA) approach and Ant Colony Optimization (ACO) approach. However, better results were acquired while using Ant Colony Optimization (ACO). Subsequently, Li (2011) developed a method of traffic light signal optimization using Cell Transmission Formulations. The study was conducted on the shaft road with undersaturated and oversaturated traffic volume. Haldenbilen at al. (2013) also developed the use of Ant Colony Optimization (ACO) and TRANSYT-7F to optimize the timing signal at Area Traffic Control System. This model provided better results than the use of TRANSYT model with genetic algorithms (GA) and Hill Climbing (HC) algorithms.
Research on the coordination of traffic light signal is still limitedly conducted on the arterial streets while the traffic in other kinds of streets are still experiencing huge delays. In this study, optimization model of offset signal at the signaled-intersection network with grid-shaped using CTM models will be developed so that a minimal delay at all intersections using ATCS will be reached.
Research Methods:
The purpose of this study was to develop an optimization model of offset signals between intersections at ATCS system which has a grid-shaped network. Signal optimization model development conducted using cell transmission model in the vehicle propagation at signalized--intersection. In the cell transmission model (CTM), the streets between intersections are divided into cells, where each cell is filled by vehicles. The vehicles will move from upstream cell to the downstream cell. Cell Transmission Method (CTM) was originally used to predict the delay experienced by the vehicle on the road due to a reduction in road capacity at a particular location on the road which is caused by traffic accidents or other happening that result in the closing of part of the road (Daganzo, 1994). The concept was developed by Li (2011) in optimizing timing signal of traffic lights mounted on the arterial road network. In this research, the cell transmission model (CTM) was developed between-intersection offset signal optimization at the grid-shaped intersections network. The stages of development of between-intersection offset signal optimization at the grid-shaped intersections network are as follows: (1) formulating the grid-shaped network model with 9-intersections, (2) Formulating Time signal on ATCS, (3) formulating vehicle propagation models between cells using CTM, (4) formulating delaying rate experienced by the vehicle as a result of red signal at the intersection, (5) establishing the relationship between the number of offset and total delay at all signalized-intersection, (6)Formulating the calculation of algorithm to gain optimum offset between intersections and the computer program and, (8) executing program using artificial data.
ATCS Network modeling:
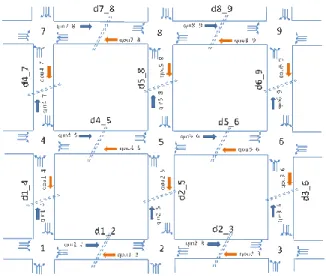
ATCS network modeled consists of a 9-intersections at grid-shaped road network as shown in Figure 1. The distance between the signalized intersection 1 with signalized intersection-2 is expressed by the notation d1_2 and is expressed in meters. While the flow of traffic on the network is indicated by the notation of qin1_2 and qou1_2. Qin1_2 notation is the number of traffic flow from intersection -1 to intersection -2 (inbound), whereas qou1_2 is the number of traffic from intersection 2 to intersection 1 (outbound) and they are expressed in passenger car units per hour.
Formulation of Traffic Lights Signal At ATCS:
Timing signal of traffic lights was planned based on the proportion of vehicles numbers in each conductor which was in line with the phase of the conductor movement. Howeever, to do the signal coordination in order to optimize the signal timing of the traffic light at ATCS, the length of time signal for the entire intersections at the ATCS should be similar, which is called as the timing signal coordination. If in the intersection at ATCS, there are intersections with smaller timing cyclus compared to other intersections, the intersections with smaller timing signal can be made into half of the timing signal coordination
Traffic Propagation Modeling at ATCS Network:
Traffict movement at the ATCS intersection control area modeled using cell transmission model. Road between the signaled intersection at ATCS network is divided into several cells. The length of the cell is the distance taken by a vehicle at one clock tick (t). While the number of cells in each segment is the result of the division of road length by cell length. Traffic will flow from cell to cell. The vehicle movement propagation between cells in the CTM is formulated by Daganzo (1994) as follows:
ni (t+1) = ni(t) + yi(t) – yi+1(t) ……… (1)
yi+1(t) = min {ni (t), Qi+1(t), (W/v)[Ni+1(t)-ni+1(t)]} ..………... (3)
Where:
index i : indicates cell-i
t : lapse of time expressed in clock ticks
ni (t) : the number of vehicles in the cell-i at time t
ni (t+1) : the number of vehicles on the cell-i at time (t + 1)
yi (t) : the number of vehicles entering the cell- i at time t
yi+1 (t) : the number of vehicles entering the cell- (i + 1) at time t
V : free flow speed
W : backward shock wave speed
Ni (t) : maximum number of vehicles that can occupy cell-i at time t.
Qi (t) : maximum number of vehicles that can flow into the cell-i.
Fig. 1: Network Model ATCS with 9 intersection.
The application of CTM concept on the vehicles’ movements between cells on the signalized intersection network by Li (2011) divides the segment between intersections into four zones, namely merging zones, propagation zone, diverging zone and departure zone, Vehicles move from one cell to the next cell to follow cell balance equation formula (1) above. For the cells in the departure zone, the vehicle will be able to move to the next cell in the next section if the signal turned green, and the vehicle can not go out when the signal is red. While the red light signal is on, the number of vehicles in these cells will continue to grow until the cells are full. When the light signal is still red and the end cell is full, then the number of vehicles in the previous cell will increase. This condition happens until the signal turned green. When the green signal is on, the end cell will emit vehicles from departure cell similar to saturated currents from the intersection approach.
Formulation of the delay:
The amount of delay experienced by the vehicle at the intersection can be calculated by counting the length of time a vehicle stuck in a cell. When the number of vehicles which come in and out of the cell, in the time intervals t (clock tick) is equally large, and no vehicle is left in the cell, the vehicles are not experiencing delays. Conversely, if the number of vehicles out of the cell is smaller than the number of vehicles enter the cells, there will be a number of vehicles left behind in the cell, Then, the vehicles will experience delays. With this approach, a large delay experienced by the vehicle can be estimated by counting time needed on the entire cells across all of the roads. The number of vehicles which experience delays at the level of cells (Lo, 2001) is as follows:
dij(t) = nij(t) – yi,j+1(t) ……… (4)
Where:
rij(t) : the number of vehicles that experienced delay in the cell- i segment -j at time t.
nij (t) : the number of vehicles on roads -j cell -i
yi, j+1(t) : the outflow from the cell-j in segment-i
Formulation of Offset Signal Relationship Between Traffic Lights Against Delay:
of signals between intersections for 9 signaled-intersection, it is necessary to find the optimum offset between interintersection-1 and other intersections, namely Offset1_2, Offset1_3, Offset1_4, Offset1_5, Offset1_6, Offset1_7, Offset1_8, and Offset1_9 which gives minimum total delay.
Algorithms to get Optimum offset and computer program:
The optimum offset is the number of offset which minimize the total delay at ATCS. To obtain optimum offset, Hill Climbing algorithm is arranged as shown in Figure 2 below. Furthermore, based on the algorithm, the computer program is arranged using Compact Visual Fortran Version 6.6.
RESULTS AND DISCUSSIONS
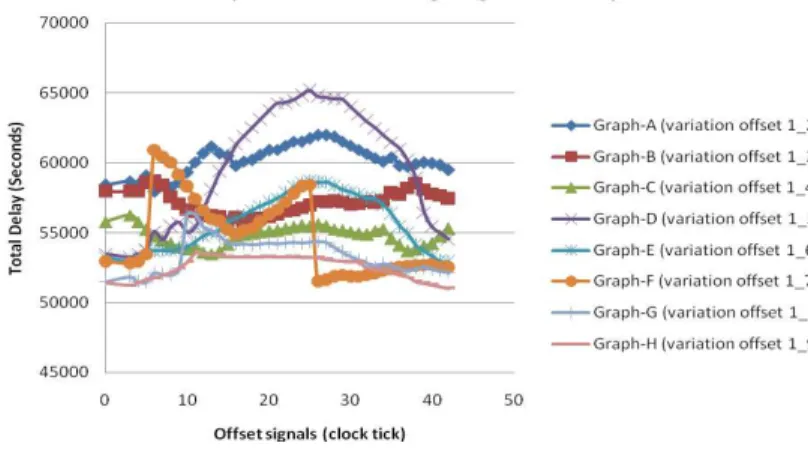
To test the optimization model offset signals on the 9-intersection ATCS-shaped grid, used artificial data is as shown in the Appendix. Optimization modeling results offset signals on the 9-intersection ATCS-shaped grid using artificial data is by taking the unit clock ticks (t) by 3 seconds and the clock ticks a number of 123 is obtained as shown in Figure 3 the following graph
Fig. 2: Flowchart of Offset Signal Optimum Calculation Algorithm On ATCS.
Fig. 3: Graph on Relationship between Variation of Offset Signal intersection and the Total Delay.
clock tick was taken. The obtained minimum total delay was amounted to 53.475 seconds on offset 1_4 by 13 clock ticks. In the same way as the graph before, graph D, graph-E, Graph-F, Graph-G, Graph-H. Graph-H is graph delay of offset 1_2, offset 1_3, offset 1_4, offset 1_5, offset 1_6, offset 1_7, offset 1_8, drawn from optimum offset. While offset 1_9 varied from 0 to 41 units of clock ticks and the obtained minimum total delay was 51.033 seconds. The results of the offset optimization modeling showed the optimal offset as follows: offset 1_2 by 12 seconds, offset 1_3 by 39 seconds, offset 1_4 by 33 seconds, offset 1_5 by 3 seconds, offset 1_6 by 120 seconds, offset 1_7 by 72 seconds, offset 1_8 by 9 seconds and offset 1_9 by 120 seconds. Diagram coordination of the overall signal intersections on ATCS shown in Figure 4, the first phase of the signal timing diagram (F1) is for the North-South movement, while the second signal timing diagram of two (F2) is for the movement of the East-West.
Offset Optimization Model validation testing was conducted using surveys at Sundandar Prio Sudarmo street namely Sulfat – Sundandar Prio Sudarmo intersection and Ciliwung - Sunandar Prio Sudarmo intersection in Malang. The survey was conducted in collaboration with the Department of Transportation of Malang. Both signalized intersection is coordinated by taking 84 seconds cycle lenght and the offset signal is set from the control room of ATCS Malang. Diagram Timing signals at both intersections are coordinated shown in Figure 5.
Fig. 4: Diagram Signal Coordination At ATCS With 9-Intersection.
The Offset signal at intersection-1 (Sunandar Prio Sudarmo-Sulfat) and intersection-2 (Sunandar Prio Sudarmo - Ciliwung) were varied. From 07:00 to 08:00, the offset signal was 0 seconds. From 08.00 till 09.00 the offset signal was 20 seconds. From 09:00 to 10:00, the offset signal was 40 seconds. From 10:00 to 11:00, the offset signal was 60 seconds. The difference on the delay numbers between the results of field surveys and the results of the modeling are shown in Figure 6 and Table 1 below. The difference of delay between the survey results and modeling results was less than 3%.
Table 1: The Difference between the average delay of survey results and the variation of offset value of the Model Results.
Offset1_2 Total Delay of the results of Observations (seconds)
Total Delay of the results of
Modeling (seconds) Difference (%)
0 6420.31 6366.00 0.85
20 7061.81 7206.13 -2.04
40 7061.81 7156.38 -1.34
60 5155.81 5156.50 -0.01
Fig. 6: The graph of Comparison between Survey Results and Modeling Results Total Delay.
Conclusions and Suggestions:
1. To facilitate the traffict movement crossing the signalized intersection area (ATCS) in the form of a grid
can be done by using signal coordination.
2. The Optimization of offset signal at the grid-shaped ATCS with 9-intersections using the proposed model
obtained: offset 1_2 by 12 seconds, offset 1_3 by 39 seconds, offset 1_4 by 33 seconds, offset 1_5 by 3 seconds, offset 1_6 by 120 seconds, offset 1_7 by 72 seconds, offset by 9 seconds , offset 1_8 by 9 seconds and offset 1_9 by 120 seconds, with a minimum total delay amounted to 51.033 seconds.
3. The results of the model validation test was developed and conducted on two adjacent intersections on
Sunandar Prio Sudarmo street in Malang, namely Sunandar Prio Sudarmo Sulfat intersection and Sunandar Prio Sudarmo -Ciliwung intersection which indicate that the developed model can be accepted with a maximum of 3% of the differences between results of model with the results of the survey.
4. Offset signal Optimization Model at ATCS network that was developed using cell transmission models
(CTM) can be used for optimizing signal on ATCS.
REFERENCES
Daganzo, C.F., 1994. The cell transmission model: a simple dynamic representation of highway traffic. Transp Res Part B., 28(4): 269-287.
Haldenbilen, S., Ozgur Baskan and Cenk Ozan, 2013. “An Ant Colony Optimization Algorithm for Area
Traffic Control”, InTech Creative Commons Attribution License,(http://creativecommons.org/licenses/by/3.0).
Kesur, K.B., 2009. “Advances in Genetic Algorithm Optimization of Traffic Signals”, JOURNAL OF TRANSPORTATION ENGINEERING © ASCE / APRIL.
Li Zichuan, 2011. “Modeling Arterial Signal Optimization with Enhanced Cell Transmission
Formulations”, Journal of Transportation Engineering, 137(7): 1.
Lin Liang-Tay, Li-Wei _Chris_ Tung, A.M.ASCE, Hsin-Chuan Ku, 2010. “Synchronized Signal Control
Model for Maximizing Progression along an Arterial”, JOURNAL OF TRANSPORTATION ENGINEERING © ASCE / AUGUST 2010 / 727.
Lo, H.K., 2001 A cell-based traffic control formulation: strategies and benefits of dynamic timeing plans.
Transportation Science©2001 INFORMS, 35(2): 148–164.
Sebayang, N., Harnen Sulistio, Ludfi Djakfar, Achmad Wicaksono, 2015. Pengembangan Model Optimasi Offset Sinyal Lampu Isyarat Laluintas Pada jaringan ATCS (Area Traffic Control System) berbentuk grid Menggunakan
Model Transmisi Sel (CELL TRANSMISSION MODEL), The 18th FSTPT International Symposium, Unila, Bandar
Lampung, August 28.
Teklu, F., Agachai Sumalee, David Watling, 2007. “A Genetic Algorithm Approach for Optimizing Traffic Control Signals Considering Routing”, Computer-Aided Civil and Infrastructure Engineering, 22: 31–43.
Zechman, E., Luca Quadrifoglio, Rahul Putha, 2010. Ant Colony Optimization Algorithm For Signal Coordination of Oversaturated Traffic Networks, NTIS: National Technical Information Service 5285 Port Royal Road Springfield, Virginia, 22161.
APPENDIX:
Appendix 1: Length of Segment at ATCS Network.
Segment Long (m) Segment Long (m) Segment Long (m) Segment Long (m)
1_2 300 2_5 300 5_6 300 6_9 300
2_3 300 3_6 300 4_7 300 7_8 300
1_4 300 4_5 300 5_8 300 8_9 300
Appendix 2: Artificial Data of Time Signals at ATCS. Intersection Phase Signal Time (sec)
Intersection Phase Signal Time (sec)
Green Red Yellow Green Red Yellow
1 1 63 57 3 6 1 57 63 3
2 48 72 3 2 54 66 3
2 1 57 63 3 7 1 51 69 3
2 54 66 3 2 60 60 3
3 1 54 66 3 8 1 57 63 3
2 57 63 3 2 54 66 3
4 1 60 60 3 9 1 60 60 3
2 51 69 3 2 51 69 3
5 1 51 69 3
2 60 60 3
Appendix 3: Artificial Data of Speed, Number of Flow, Saturated Density of Roads and Road Number.
Inters ectio n
Speed (Km/jam) Saturated Flow Segment (pcu/jam)
Volume Traffic
(pcu/jam) Jam density (pcu/km)
Number of Lane Traffic Inbound Outboun
d Inbound Outbound Inbound Outbound Inbound
Outboun
d Inbound Outbound
1-2 40 40 1800 1800 1600 1600 156 156 2 2
2-3 40 40 1800 1800 1600 1600 156 156 2 2
1-4 40 40 1800 1800 1600 1600 156 156 2 2
2-5 40 40 1800 1800 1600 1600 156 156 2 2
3-6 40 40 1800 1800 1600 1600 156 156 2 2
4-5 40 40 1800 1800 1600 1600 156 156 2 2
5-6 40 40 1800 1800 1600 1600 156 156 2 2
4-7 40 40 1800 1800 1600 1600 156 156 2 2
5-8 40 40 1800 1800 1600 1600 156 156 2 2
6-9 40 40 1800 1800 1600 1600 156 156 2 2
7-8 40 40 1800 1800 1600 1600 156 156 2 2
8-9 40 40 1800 1800 1600 1600 156 156 2 2
Appendix 4: Traffic Flow Entering Intersection of ATCS.
Intersection Approach
The volume of traffic to Directions (pcu / hour)
North South East West
1 S 1200 - 150 -
W 200 - 1200 -
2 S 1200 - 120 120
3 S 1300 - - 120
E 120 - 1200
4 W 150 150 1200 -
6 E 200 150 - 1200
7 N - 1200 150 -
W - 150 1200 -
8 N - 1200 150 150
9 N - 1200 - 150
E - 150 - 1200