O R I G I N A L R E S E A R C H
Open Access
Analysis of voltage stability uncertainty
using stochastic response surface method
related to wind farm correlation
Zhaoxing Ma
1*, Hao Chen
2and Yanli Chai
3Abstract
Wind speed follows the Weibull probability distribution and wind power can have a significant influence on power system voltage stability. In order to research the influence of wind plant correlation on power system voltage stability, in this paper, the stochastic response surface method (SRSM) is applied to voltage stability analysis to establish the polynomial relationship between the random input and the output response. The Kendall rank correlation coefficient is selected to measure the correlation between wind farms, and the joint probability distribution of wind farms is calculated by Copula function. A dynamic system that includes system node voltages is established. The composite matrix spectral radius of the dynamic system is used as the output of the SRSM, whereas the wind speed is used as the input based on wind farm correlation. The proposed method is compared with the traditional Monte Carlo (MC) method, and the effectiveness and accuracy of the proposed approach is verified using the IEEE 24-bus system and the EPRI 36-bus system. The simulation results also indicate that the consideration of wind farm correlation can more accurately reflect the system stability.
Keywords:Power system, SRSM, Correlation, Wind farm
1 Introduction
Around the world, power systems have witnessed increased amount of renewable and dispersed generation, especially wind power and solar power. Renewable energy is a useful supplement to traditional energy sources, but is different from the traditional form of energy because of its uncer-tainty and intermittency. The renewable energy is con-nected to power grid by concentrated form or distributed form, bringing many uncertainties to power system voltage stability as well as new problems and challenges to re-searchers. If system voltage stability is evaluated in the most severe working model for studying, the results are often too conservative, and therefore, a new effective way should be investigated. This paper propose a method to investigate the impact of stochastic uncertainty of grid-connected wind power generation on power system voltage stability by structure dynamic systems that include node voltages.
The impact of stochastic power injections on power flows and voltage profile is a widely studied topic since the 1970s
[1]. The probabilistic analysis was firstly introduced into studying power system small signal stability by Burchett and Heydt in [2]. A series of work later on [3–6] have fur-ther improved the various aspects of the analytical method of power system probabilistic small signal stability. In [7, 8], a method of probabilistic analysis was proposed to directly calculate the probabilistic density function of critical eigen-values of a large scale power system from the probabilistic density function of gird connected multiple sources of wind power generation to investigate the impact of stochastic un-certainty of grid-connected wind generation on power sys-tem small-signal stability [9]. Reference [10] presented a comparative analysis of the performance of three efficient estimation methods when applied to the probabilistic as-sessment of small-disturbance stability of uncertain power systems. In [11], an analytical approach was proposed to in-volve the effects of correlation of wind farms in probabilis-tic analyprobabilis-tical multi-state models of wind farms output generation. Reliability models of wind farms considering wind speed correlation are proposed in [12].
In this paper, power system voltage stability is analyzed using the stochastic response surface method (SRSM). The algebraic equations that contain the voltages are
* Correspondence:[email protected]
1College of Automation Engineering, Qingdao University of Technology,
Qingdao 266033, China
Full list of author information is available at the end of the article
converted into a differential system with system node voltages. Then, the output of the SRSM is the output of the composite matrix spectral radius of the dynamic system is constructed, and is used to judge the stability of the system voltage. The IEEE 24-node system and the EPRI 36-node system with wind power are considered as two examples to verify the accuracy of the proposed analysis method.
2 Discussion
2.1 System model analysis
In power system stability analysis, a power system is characterized by the set of nonlinear dynamic equations as:
_
x¼f xð ;y;τÞ ð1Þ
0¼g xð ;y;τÞ ð2Þ
wherefandgexpress the system dynamic equations and
the algebraic equations, respectively. x represents the
state variables,yrepresents the algebraic variables of the node voltage magnitudes and angles, andτis the control parameters.
Neglecting the resistances, the algebraic equations that consist of the algebraic variables of the node voltage magnitudes and angles can be shown as:
PLiþ X mþn
j¼1
BijViVjsin αi−αj
¼ypi¼0 ð3Þ
−QLiþ X mþn
j¼1
BijViVjcos αi−αj
¼yQi¼0 ð4Þ
i¼nþ1;⋯;nþm:
where PLi and QLi are the ith node active and reactive
power, respectively. Vi and Vj are the voltage of the ith
node and the jth generator bus, respectively. Bij
repre-sents the reactance of the admittance matrix, and αi is
theith bus phase angle. If1≤j≤n, thenαj=δj, whereδj
is the generator rotor angle of thejth machine. nis the
number of generator buses andmis the number of load
buses.PLiandQLiare functions ofViandαi.
Equations (3 and 4) represents a pure dynamic system and taking derivative of (3, 4) leads to the dynamic quantityV_iandα_i[12, 13] as:
∂yPi
∂t¼
∂yPi
∂VV_þ∂yPi
∂αα_þ∂yPi
∂δδ_¼0ð5Þ
∂yQi
∂t¼
∂yQi
∂VV_þ∂yQi
∂αα_þ∂yQi
∂δδ_¼0ð6Þ
i¼nþ1;⋯;nþm:
It is more convenient to represent the generator dynamic equations as follows:
_
δi¼ωi ð7Þ
Miω_i¼Pmi− Mi MT
PCOI−Bi;iþnEgiViþnsin δi−ψiþn
ð8Þ
where δi¼δi−δ0 , ωi¼ωi−ω0 , ψi¼ψi−δ0 , MT
¼Xn
i¼1
Mi, δ0¼M1T Xn
i¼1
Miδi, ω0¼M1T Xn
i¼1
Miωi, PCOI
¼X
n
i¼1
Pmi−
X
nþN
i¼nþ1
PLi. PLi is the active load at each node
and Pmi is the input mechanical power. δi and ωi are
the rotor angle and angular speed of the ith machine,
respectively. δ0 and ω0 are the centers of angle and
angular speed, respectively. Mi and Egi are the ith
machine inertia and internal voltage, respectively. B
represents the reactance of the admittance matrix. n
is the number of generators, Vi+n and ψiþn are the
generator bus voltage and phase angle, respectively. N
is the number of non-generator buses in the power system.
From (5, 6), there is
∂yPi
∂VV_þ∂yPi
∂αα_¼−∂yPi
∂δδ_ð9Þ
∂yQi
∂VV_þ∂yQi
∂αα_¼−∂yQi
∂δδ_ð10Þ
From (9, 10), it yields
Að Þτ Bð Þτ Cð Þτ Dð Þτ
_
V _
α ¼− Eð Þτ _ δ
Fð Þτ δ_:
ð11Þ
where, Að Þ ¼τ ∂yP
∂V, Bð Þ ¼τ ∂yP
∂α, Cð Þ ¼τ
∂yQ
∂V,Dð Þ ¼τ ∂yQ
∂α,Eð Þ ¼τ
∂yP
∂δ and Fð Þ ¼τ
∂yQ
∂δ.Substituting (7, 8) into (11), and solving the dynamic quantityV_iandα_iyield:
_ V _ α ¼−
Að Þτ Bð Þτ Cð Þτ Dð Þτ
−1
Eð Þωτ Fð Þωτ
ð12Þ
whereV=(Vn+1,…, Vn+m)′,α=(αn+1,…,αn+m)′,ω=(ω1,
…, ωn)′, δ=(δ1, …, δn)′. The equation can also be
expressed as:
_
x¼f xð ;ωÞ ð13Þ
wherex=(V,α)′.
Using (13), a dynamic system can be constructed that contains power system node voltages. A node voltage state equation and its Jacobian matrix can then be estab-lished and used to meet the uncertainty of wind power generation. The uncertain elements that are included in the wind power are considered as the input, and a single element that can measure the system voltage stability is considered as the output. After the application of“black box algorithm”, it can analyze the influence of the uncer-tainties on system voltage stability.
Setting J the Jacobian matrix of system (13) at the
equilibrium. If the real parts of all the eigenvalues of the Jacobian matrix J is negative, the system (13) is stable; otherwise, the system can become unstable. Thus, a new simple and effective lemma [14] is given as follows:
Lemma 1If the spectral radiusρ(J)of matrixJsatisfies ρ(J)<1,then the matrixJis a convergence matrix.
Theorem 1 Assuming that (I−J)−1exists and (I+J)(I
−J)−1converges, the real parts of all the eigenvalues ofJare negative, whereIrepresents the identity matrix.
Theorem 2 Assuming that (I−J)−1exists and (I+J)(I
−J)−1dose not converge, the real parts of all the eigenvalues ofJare nonnegative.
A power system with wind plant is considered as an example for further elaboration. The wind speed is set to vw, which is considered as the uncertain input element.
A is the system Jacobi matrix at the equilibrium point,
so the complex matrix ((I+A)(I−A)−1) can be founded. The spectral matrix of the complex matrix that can be used to judge the stability of the system voltage can be taken as the output. After calculation using the black box algorithm, as the spectral radius ρ((I+J)(I−J)−1) of the matrix (I+J)(I−J)−1 satisfies ρ((I+J)(I−J)−1) < 1, all of the real parts of the eigenvalues of matrix Jare negative and the existing dynamic system voltage is stable. In contrast, if the spectral radius ρ((I+J)(I−J)−1) satisfies
ρ((I+J)(I−J)−1)≥1, the system voltage is unstable. Thus, the relationship between the elements of wind power uncertainty and the system voltage stabi-lity is established, and the system voltage stabistabi-lity state can be assessed.
2.2 Stochastic response surface method analysis
SRSM improves the computational efficiency and accu-racy of probability analysis through special reconnais-sance and polynomial chaos expansion model output, which is considered to be deterministic classical response surface method [15]. SRSM significantly improves the efficiency and reliability of the analysis, and avoids the iterative computation of traditional methods [16–18].
The principle of SRSM is based on the probability distribution of known parameters, and the response approximation expressed as a polynomial function of the
model parameters. Set the response Y as a function of
the uncertain parameterx, which represents the form of the model as:
Y¼u xð Þ ð14Þ
The estimated valueŶcan correctly describe the char-acteristics of the responseYand is expressed as:
^
Y ¼^u xð Þ ð15Þ
whereû(x) is polynomial function.
The estimated value Ŷ of the response is constructed
by SRSM with Hermite polynomial, and p-rank
expres-sion as:
Hpð Þ ¼x ð Þ−1 pe x2
2 d
p
dxp e
−x2
2
ð16Þ
It satisfies the orthogonality: Z þ∞
−∞ e −x2
2H
pð ÞxHqð Þ ¼x 0 ð17Þ
SRSM is able to make the output model as a polyno-mial chaos expansion model with the standard normal distribution random variables:
y¼a0þ Xn
i1¼1
ai1η1ð Þ þφi1 Xn
i1¼1 Xi1
i2¼1
ai1i2η2ðφi1;φi2Þ
þXn
i1¼1 Xi1
i2¼1 Xi2
i3¼1
ai1i2i3η3ðφi1;φi2;φi3Þ þ⋯
ð18Þ
where a0, ai1 and ai1i2 are the determining factors that
need be determined; n is number of input random
variables; φij is the jth standard normal distribution of
random variables.ηp(φi1,φi2,…,φip) is ap-rank Hermite
orthogonal polynomial; and can be shown as:
ηp φi1;⋯;φip
¼ð Þ−1 pe12ψ′ψ ∂
p
∂φi1⋯∂φip
e−12ψ′ψ ð19Þ
whereΨrepresents the vector of φik pk¼1,p≥1. Solving
ηp (φi1, φi2,…, φip), and substituting into the (14) can
In the following, a 2-rank expansion with n random variables is taken as an example for illustration. The 2-rank expansion is given as:
y2ðφ1;φ2Þ ¼a0þa1φ1þa2φ2þa3 φ21−1
þa4 φ22−1
þa5φ1φ2 ð 20Þ
For (16), six certainty coefficients need be solved in
2-rank output model y2. Thus, the number of the
certainty coefficients ai be solved in the 2-rank model
is 1+2n+½(n(n-1)) with n random variables.
In applying SRSM, the most important task is to solve the unknown coefficient ai. Both the probability
distri-bution method and the efficient regression method can be used to solve the unknown coefficient, although, the efficiency of the efficient regression method is better and the results are more robust. As the input variable quan-tities areφ1iandφ2i, (16) can be represented as:
y2iðφ1i;φ2iÞ ¼a0þa1φ1iþa2φ2iþa3 φ21i−1
þa4 φ22i−1
þa5φ1iφ2i
ð21Þ
To calculate the unknown coefficientsai, some sample
points with forms as (φ1m, φ2m) are required to be
selected. In this paper, φ describes the wind speed
following probability distribution, and y expresses the degree of voltage instability by (16) and (17). Thus, the relation that is related to power system is established for analysis.
Equation (17) is the 2-rank expansion model, and the roots (0, pffiffiffi3, −pffiffiffi3 of the 3-rank Hermite polynomials can be selected with a total of nine sample points. If the number of random variables is more than 3, the number of sample points is two times larger than that of the un-known factor, and thus large amount of calculation is required. However, the selected sample points are in the standard normal distribution space, and therefore, it is necessary to convert them to the original space. The transformation of the original space sample points corre-sponds to the real response value, and the unknown
coefficients ai can be obtained using the least square
method for solving linear equations.
2.3 Copula theory correlation analysis 2.3.1 Copula function definition
Assuming H(·,·) is the joint distribution function of F(·) andG(·)with marginal distribution, there exists a Copula functionC(·,·)satisfying:
H xð ;yÞ ¼C F xð ð Þ;G yð ÞÞ ð22Þ
The density function of the distribution functionH(·,·)
can be derived by the density function C(·,·) of the
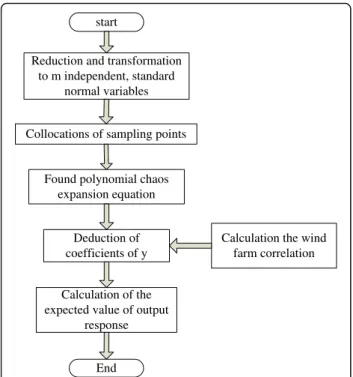
Reduction and transformation to m independent, standard
normal variables
End start
Collocations of sampling points
Found polynomial chaos expansion equation
Deduction of coefficients of y
Calculation of the expected value of output
response
Calculation the wind farm correlation
Fig. 1Flow chart of the analysis method
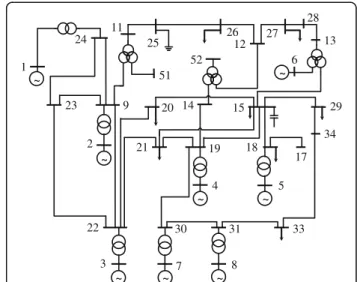
Fig. 2The IEEE 24-bus system
Table 1Parameters of wind farms
Wind farms 1 2
Fans 40 20
Rated capacity (MW) 0.6 1.5
Cut in wind speed (m/s) 4 3
Cut out wind speed (m/s) 22 24
Copula function and the edge distribution function F(·) andG(·)as:
h xð ;yÞ ¼c F xð ð Þ;G yð ÞÞf xð Þg yð Þ ð23Þ
where c uð ;vÞ ¼∂ C uð Þ;v
∂u∂v, u=F(x), v=G(y); f(·) and g(·)are the density functions ofF(·)andG(·), respectively. In this paper, wind power output sequences of the two
wind power plants are x and y, and their distribution
functions are F(x) and G(y), respectively. u=F(x), v= G(y). H is the copula function ofF (x)andG (y).
In this paper, Frank Copula function [19–22] is con-sidered as the connection function of joint probability distribution of wind farms. The respective distribution function and density function of Frank Copula can be expressed as:
CFðu;v;βÞ ¼−
1 βln 1þ
e−βu−1
e−βv−1
e−β−1
ð24Þ
cFðu;v;βÞ ¼
−βe−β−1e−βðuþvÞ e−β−1
ð Þ þðe−βu−1Þðe−βv−1Þ
½ 2 ð25Þ
whereβis the relative parameter and β≠0. Ifβ> 0, ran-dom variablesuandvhave positive correlation. Ifβ→0, random variables u and v tend to be independent. β<0
show that random variable u and v have negative
correlation.
2.3.2 Correlation analysis
Since the traditional Pearson’s linear correlation coeffi-cient cannot depict the complicated correlation relation-ship of different wind speed time series, in this paper, Kendall rank correlation coefficient is selected to mea-sure the correlation of wind farm power. Kendall rank correlation coefficient indicates the difference between the probabilities of agreement and inconsistency from randomly selected observations in the samples. Thus, the general form of Kendall rank correlation coefficient can be obtained. Assuming (xi, yi) and (xj, yj) are
arbi-trary 2 possible values of random vector (X, Y), (xi,yi)
and (xj, yj) are independent and identically distributed.
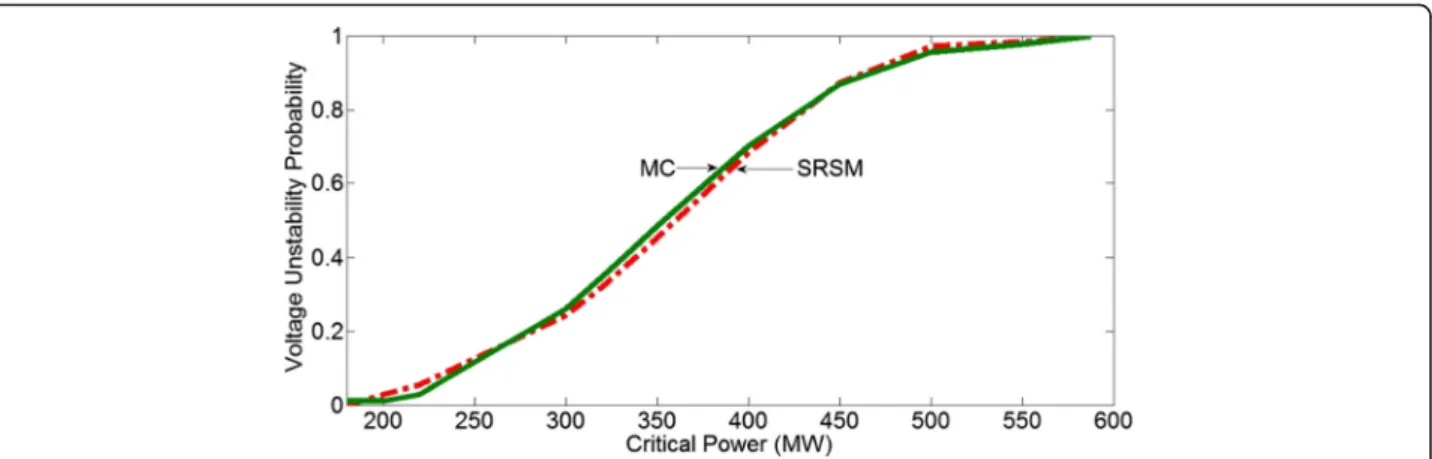
Define: Fig. 3Cumulative density distribution of voltage instability with critical power
Fig. 4Probability density of spectral radius with 380 MW wind power generation
κ¼P xi−xj
yi−yj
>0
n o
−P xi−xj
yi−yj
<0
n o ð26Þ
as the Kendall rank correlation coefficient, andк∈[−1,1], i≠j. P indicates probability of occurrence. Ifк> 0, ran-dom variablesX and Yhave positive correlation; ifк< 0, the random variables have negative correlation. Ifк= 0,
the correlation between random variables X and Y
can-not be determined.
Random variable P1 and P2 is defined as the output
rates of the two wind farms, respectively. (p11, p12,…, p1n) and (p21,p22,…,p2n) are the respective sample space
of random variableP1andP2,nis the sample size, which
establishes a one-to-one relationship withp1iandp2i.
The relation between the Kendall rank related
coeffi-cient к and the related parameters β of Frank Copula
function can be expressed as:
κ¼1þ4
β½Dkð Þβ−1 ð27Þ
whereDkð Þ ¼β βkk
Z β
0
tk
et−1dt,k= 1.
2.4 Wind power uncertainty analysis
The relationships between active power Pe that is
sup-plied by the wind generation source and wind speed v
are expressed as [14, 20]:
Pe¼
cþdv; as vin≤v≤vr P0; as vr≤v≤vout
0; others
8 <
: ð28Þ
where vinand voutare respective cut-in wind speed and
cut-out wind speeds,vris the rated wind speed,Peis the
active power generated by the wind farm, and P0is the
rated active power.canddare constants.
In this paper, the wind speed is assumed to follows a
Weibull distribution and is shown by variation η of
standard normal distribution as:
v tð Þ ¼ −ln 1 2þ
1 2gerg
ηffiffiffi 2 p
1
t
ð29Þ
wheregergis the Gaussian error function.
The analysis process with SRSM is expressed in the next section.
Fig. 6Cumulative density distribution of voltage instability for correlationκ= 0.257
Table 2Average error indices of IEEE 24-node system in different correlation
Correlation coefficient Average error
0.162 0.039
0.257 0.041
~
~
~
~ ~
~ ~ ~
24 25
51
11 26
12 27
28
13
6
29
34
17 18 19
15 14
20
21
22 30 31 33
8 7
3 23 1
9
2
4 5
52
3 Method
3.1 Voltage uncertainty analysis with SRSM
As for actual systems that contains wind power, whose wind speed follows Weibull distribution rather than the normal distribution, it should convert the wind speed as the standard normal distribution to analyze the impact of wind power uncertainty on voltage stability based on SRSM. Some researchers also apply SRSM to analyze un-certainty of power system dynamic simulation [23]. The flow chat for the calculation and analysis of the uncertainty of wind power on stability using SRSM is shown in Fig. 1.
4 Results 4.1 Case studies
In the test cases, dispersed wind generation is consi-dered in the IEEE 24-bus system shown in Fig. 2 and two wind farms are added into the system at node 1 and 7, respectively. In all cases presented below, comparisons are made to the Monte Carlo (MC) numerical approach.
4.2 Case 1
In this test case, the outputs of the two wind farms are in-dependent from each other. In this paper, MC simulated 6000 times to verify the accuracy and efficiency of SRSM.
To enable a balanced comparison of the accuracy between SRSM and MC, the same number of uncertainties are used for each moment model. The parameters of the two wind farms are shown in Table 1. In study, the mode of load change is that increase the whole network load si-multaneously, with the load of each node increased by the same proportion. In the load direction, the load compo-nent of the partial load follows normal distribution.
Figure 3 shows the cumulative probability curve ob-tained by SRSM and MC method for the IEEE 24-node system, and the voltage instability probability of the sys-tem are determined under different load levels.
In Fig. 4, the probability density of spectral radius with 380 MW wind power generation is given. The calcula-tion results also show that SRSM has high accuracy than the MC method, and it can meet the needs for the prac-tical applications.
4.3 Case 2
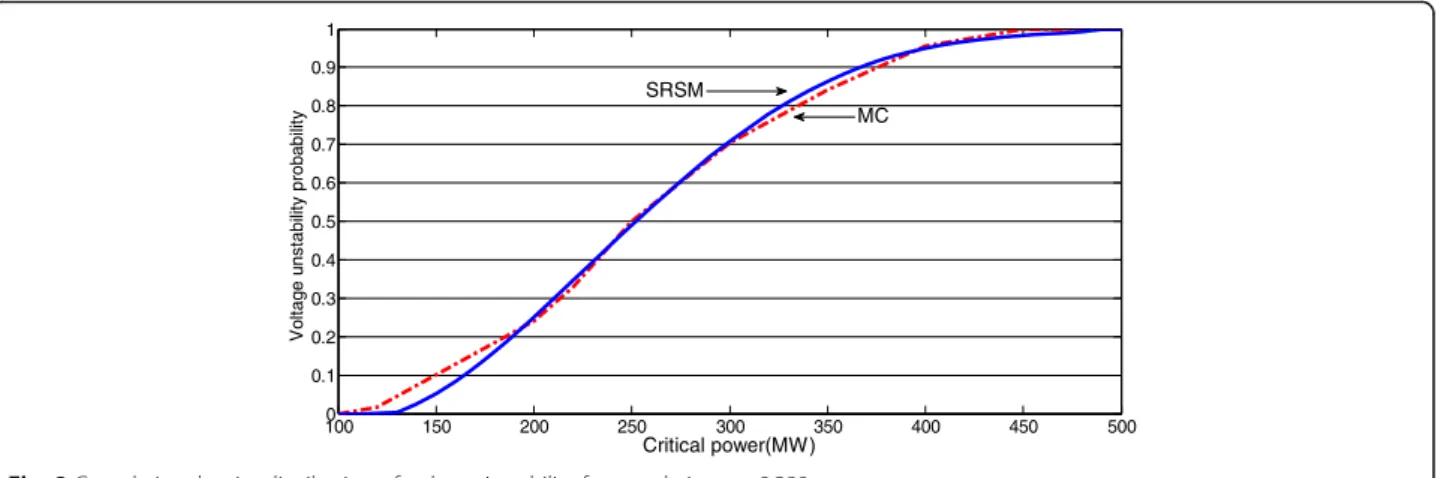
In this test case, two wind farms are correlated each other. Figures 5 and 6 compare the cumulative probability curve obtained by SRSM and MC for the IEEE 24-node system, and the system voltage instability probability are deter-mined under different load levels.
In Figs. 5 and 6, MC was used to verify the accuracy of the proposed SRSM method in the paper, and is can be seen that SRSM method has good accuracy. Under the condition of different correlation coefficients, the ave-rage error of voltage instability analysis with SRSM is given in Table 2. Calculation results shown that Kendall rank correlation coefficient method in analyzing voltage instability has good accuracy, and can satisfy the engi-neering requirement.
The results of numerical calculation show that wind farm correlation had a significant influence on system voltage stability. According to Figs. 5 and 6, the greater the correlation between the wind farms has, the more noticeable influence on system voltage stability. The
100 150 200 250 300 350 400 450 500
0 0.1 0.2 0.3 0.4 0.5 0.6 0.7 0.8 0.9 1
Critical power(MW)
V
o
lt
age uns
tabi
lit
y
pr
obabil
it
y
SRSM
MC
Fig. 8Cumulative density distribution of voltage instability for correlationκ= 0.280
0 50 100 150 200 250 300 350 0
0.2 0.4 0.6 0.8 1
Critical power(MW)
V
ol
tage uns
tab
ilit
y p
ro
babi
lit
y
MC SRSM
simulation results of case 1 and case 2 shown that the system voltage may reached an instability state is under-estimated without considering the correlation, that is underestimate the potential risks. From the simulation results, it also got that the proposed method can reflect accurately the system voltage stability as analyze the voltage stability uncertainty problems.
4.4 Case 3
In the test case, dispersed wind generation is considered in the EPRI 36-node system shown in Fig. 7. Two corre-lated wind farms whit the same parameters as shown in Table 1 are added to the system and are connected at node 4 and 5, respectively.
In this case, MC is simulated 4000 times to verify the accuracy and efficiency of SRSM. The system reference power is 100 MW and the 2-rank SRSM polynomial is used for calculation. In the simulation, the load of each node is again increased by the same proportion.
For correlation coefficient κ= 0.280 and κ= 0.794, the cumulative density distributions of voltage instability are expressed in Figs. 8 and 9, respectively.
As can be seen from the Figs. 8 and 9, the larger the cor-relation between the wind farms has, the lower the voltage instability critical power is, and the probability of instability is greater under the same power condition. Under the con-dition of strong correlation, it is also indicated that more at-tention should be paid to the voltage instability problem.
5 Conclusions
This paper presents a method that establishes a dynamic system including node voltage to study power system volt-ages stability incorporating wind farm uncertainty. Rather than the eigenvalues of the Jacobi matrix, the criterion of power system voltage stability is given by the spectral ra-dius of the composite matrix. In the study process, the correlation of wind farms is considered, such that the un-certainty of the wind farms and the analysis method are closer to actual systems. The proposed method which uses SRSM to study the uncertainty can provide power system operators with useful real-time estimation of the power system voltage stability with wind power integration. Compared to the traditional methods, e.g. the Monte Carlo method, the proposed one is more efficient.
The analysis and the simulation results also shown that the proposed method has a higher accuracy and has a good application prospect to actual system operation and stability analysis. The effect of the correlation be-tween multiple distributed energy source on system vol-tage stability will be considered in future research.
Acknowledgements
This work is supported by project of the Jiangsu Province University Natural Science Research Foundation (14KJB470003).
Authors’contributions
ZM contributed to the study design and analysis and drafted the manuscript; HC worked on aspects of the study relating to wind farm correlation; YC was involved in data acquisition and revision of the manuscript. All authors have read and approved the final manuscript.
Competing interests
The authors declare that they have no competing interests.
Author details
1
College of Automation Engineering, Qingdao University of Technology, Qingdao 266033, China.2Jiangsu Electric Power Company, Nanjing 210024,
China.3Jiangsu Normal University, Xuzhou, China.
Received: 6 January 2017 Accepted: 9 May 2017
References
1. Schilling, M. T., Leite da silva, A. M., Billinton, R., & Ei-kady, M. A. (1990). Bibliography on power system probabilistic analysis (1962–1988).IEEE Transactions on Power Systems, 5(1), 1–11.
2. Burchett, C., & Heydt, G. T. (1978). Probabilistic methods for power system dynamic stability studies.IEEE Transactions on Power Systems, 97(3), 695–702. 3. Kim, Y. K., Lee, G. H., Hong, J. P., Hur, J., Lee, B. K., & Kang, G. H. (2004).
Prediction of torque characteristic on barrier-type SRM using stochastic response surface methodology combined with moving least square.IEEE Transactions on Magnetics, 40(2), 738–741.
4. Haesen, E., Bastiaensen, C., Driesen, J., & Belmans, R. (2009). A probabilistic formulation of load margins in power systems with stochastic generation.
IEEE Transactions on Power Systems, 24(2), 951–958.
5. Bai, F. F., Liu, Y., Liu, Y. L., Sun, K., Bhatt, N., et al. (2016). A measurement-based approach for power system instability early warning.Protection and Control of Modern Power System, 1, 1–9.
6. Ai, Q., Fan, S. L., & Piao, L. J. (2016). Optimal scheduling strategy for virtual power plants based on credibility theory.Protection and Control of Modern Power System, 1, 20–27.
7. Faried, S. O., Billinton, R., & Aboreshaid, S. (2010). Probabilistic evaluation of transient stability of a power system incorporating wind farms.IET Renewable Power Generation, 4(4), 299–307.
8. Bu, S. Q., Du, W., Wang, H. F., Chen, Z., Xiao, L. Y., & Li, H. F. (2012). Probabilistic analysis of small-signal stability of large-scale power system as affected by penetration of wind generation.IEEE Transactions on Power Systems, 27(2), 762–770.
9. Wang, C., Shi, L. B., Yao, L. Z., Wang, L. M., Ni, Y. X., & Bazargan, M. (2010). Modelling analysis in power system small signal stability considering uncertainty of wind generation.IEEE PES SM Paper, 22(5), 1–7. 10. Preece, R., Huang, K. J., & Milanovie, J. V. (2014). Probabilistic
small-disturbance stability assessment of uncertain power system using efficient estimation methods.IEEE Transactions on Power Systems, 29(5), 2509–2517. 11. Riahinia, S., Abbaspour, A., Fotuhi-Firuzabad, M., & Moeini-Aghtaie, M.
(2015). Impact of correlation on reserve requirements of high wind-penetrated power systems.International Journal of Electrical Power& Energy Systems, 73, 576–583.
12. Chen, F., Li, F. X., Wei, Z. N., Sun, G. Q., & Li, J. (2015). Reliability models of wind farms considering wind speed correlation and WTG outage.Electric Power Systems Research, 119, 385–392.
13. Mehraeen, S., Jagannathan, S., & Mariesa, L. C. (2010). Novel dynamic representation and control of power systems with FACTS devices.IEEE Transactions on Power Systems, 25(3), 1542–1554.
14. Ma, Z. X., Gu, W., & Wan, Q. L. (2014). Study on power system small-disturbance uncertainty stability considering wind power.IEEJ Transactions on Electrical and Electronic Engineering, 9, 123–128.
15. Bao, H. B., & Wei, H. (2012). A stochastic response surface method for probabilistic evaluation of the voltage stability considering wind power.
Proceedings of the CSEE, 32(13), 77–85.
16. Ren, Z. Y., Li, W. Y., Billinton, R., & Yan, W. (2015). Probabilistic power flow analysis based on the stochastic response surface method.IEEE Transactions on Power Systems, 26(3), 1–9.
18. Han, D., Ma, J., He, R. M., et al. (2010). Dynamic consistency test for power system time-domain simulation.Automation of Electric Power Systems, 34(16), 29–33.
19. Cai, D. F., Shi, D. Y., & Chen, J. F. (2013). Probabilistic load flow considering correlation between input random variables based on Copula theory.Power System Protection and Control, 41(20), 13–17.
20. Feng, L., Zhang, J. N., Li, G. J., & Zhang, B. L. (2016). Cost reduction of a hybrid energy storage system considering correlation between wind and PV power.Protection and Control of Modern Power System, 1, 11–19.
21. Gao, Y., & Billinton, R. (2009). Adequacy assessment of generating systems containing wind power considering wind speed correlation.IET Renewable Power Generation, 3(2), 217–226.
22. Chen, H. (2016).Load forecasting based on modern time series analysis method(pp. 187–208). China Electric Power Press.