Rao et al. World Journal of Pharmaceutical and Life Sciences
DEVELOPMENT AND VALIDATION OF RP-HPLC METHOD FOR
THE ESTIMATION OF AGOMELATINE IN BULK AND TABLET
DOSAGE FORM.
Sai Govikari, Bairi Agaiah Goud and Ajmera Rama Rao*
S.R.R. College of Pharmaceutical Sciences, Valbhapur (V), Elkathurthy (M), Karimnagar, Telangana- India.
Article Received on 10/07/2016 Article Revised on 31/07/2016 Article Accepted on 21/08/2016
ABSTRACT
A simple precise, accurate, sensitive and efficient reverse phase high performance liquid chromatography (RP-HPLC) method has been developed for estimation of Agomelatine in its Tablet dosage form. Separation was done by using mobile phase consists of mixture of Acetonitrile and buffer in the ratios of 45:55%v/v. Chromatography separations were carried out on Athena C18 column (250X4.6mm; 5μm) at a flow rate of 1 mL/min and UV detection at 230 nm and the retention time for Agomelatine is 2.76 min. The linear dynamic response was found to be in the concentration of 10-40μg/mL. The percentage recovery of was found to be 98.89%-100.50%. Proposed method was found to be simple, accurate, precise and rapid. The statistical parameters and recovery studies were carried out and reported. The results obtained were satisfactory and good in agreement as per the ICH guidelines.
KEYWORDS: Agomelatine, RP-HPLC, Validation, melatonin agonist.
INTRODUCTION
Agomelatine is structurally closely related to melatonin. It is a potent agonist at melatonin receptors and an antagonist at serotonin-2C (5-HT2c) receptors, tested in an animal model of
depression. Chemically it is N-[2-(7-methoxynaphthalen-1-yl) ethyl] acetamide. Agomelatine is a melatonergic agonist (MT
1 and MT2 receptors) and 5-HT2C antagonist. Binding studies
indicate that agomelatine has no effect on monoamine uptake and no affinity for α, β
World Journal of Pharmaceutical and Life Sciences
WJPLS
www.wjpls.org
SJIF Impact Factor: 3.347*Corresponding Author Dr. Ajmera Rama Rao
S.R.R. College of Pharmaceutical Sciences, Valbhapur (V),
adrenergic, histaminergic, cholinergic, dopaminergic and benzodiazepine receptors. Agomelatineresynchronises circadian rhythms in animal models of circadian rhythm disruption. Agomelatine increases noradrenaline and dopamine release specifically in the frontal cortex and has no influence on the extracellular levels of serotonin.[1-3]
Common adverse effects of Agomelatine include diarrhea, headache and common cold symptoms. Additional adverse effects include blurred vision, eczema, agitation, restlessness. The recommended dose is 25 mg once daily taken orally at bedtime.[4-10] After two weeks of treatment, if there is no improvement of symptoms, the dose may be increased to 50 mg once daily, i.e. two 25 mg tablets, taken together at bedtime. The literature survey reveals that few Methodreported fortheestimation of agomelatine and the previous methods are not that much of precise and sensitive.[11-16] Therefore, present study is to develop a new, simple, efficient, reproducible RP-HPLC method for the analysis of Agomelatine in its bulk and formulation. To validate the developed method for estimation of dug in formulation using RP-HPLC method.
MATERIAL AND METHODS Reagents and chemicals
Acetonitrile purchased from Merck, Mumbai. Ortho phosphoric acid purchased from Rankem, New Delhi. Ortho phosphoric acid AR grade purchased from Sdfine chemicals, Mumbai. Potassium dihydrogen phosphate for Chromatography purchased from Merck, Mumbai.
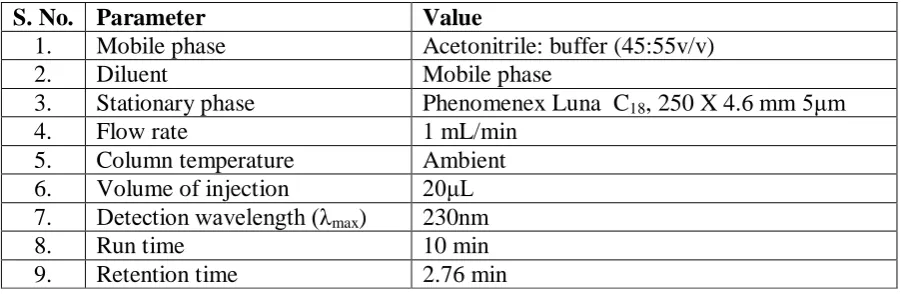
Chromatographic conditions
To optimize the developed HPLC method mixed phosphate buffer and Acetonitrile was used. Other parameter of chromatogram condition mentation in tabale-6.
Preparation of solutions
Preparation of standard stock solution
Agomelatine was accurately weighed 25mgand transferred to 25mL volumetric flask. It was dissolved properly and diluted up to the mark with diluent to obtain concentration of 1000 µg/mL.
Preparation of standard solution
Preparation of buffer
136.09gms of 0.02M KH2PO4 and 174.18gms of 0.003M K2HPO4 were transferred into
1000ml of volumetric flask, dissolved and makeup to the mark with water and pH was adjusted to 6 with 0.1% OPA.
Preparation of sample stock solution
Tablet powder equivalent to 25 mg of Agomelatine is weighed and transferred to 25ml Vol flask. Small amount of mobile phase is added to dissolve and the volume is made up to the mark. Then it is filtered with 0.45µ filter paper and sonicated.
Preparation of sample solution
From the sample stock solution 0.1ml is transferred to the 10ml volumetric flask and volume is made up to 10ml to get 10µg/ml concentration.
METHODVALIDATION
The developed analytical method was further subjected to validation in accordance to the ICH guidelines. The parameters evaluated were linearity, sensitivity, system suitability, precision, accuracy, robustness and stability. Co efficient of variation and relative errors<2% were considered acceptable.
Linearity
In order to check the linearity for the developed method, solutions of six different concentrations ranging from 25-150µg/mL.
Sensitivity
The sensitivity of the proposedmethod estimated by Limit of Detection (LOD): The parameter LOD was determined by using formula i.e. LOD=3.3(SD/S and Limit of Quantification (LOQ): The parameter LOQ was determined by formula i.e. LOQ = 10(SD/S).
Systemsuitability
Precision
Precisionwasmeasuredby theanalysisofsample solutionsof6replicates, tochecktheintraday andinterday variationsofthemethod.
Accuracy
The accuracy of the method was determined by the analysis of standard addition there levels, that is, multiple-level recovery studies. The reference standard, at three different concentrations (50, 100, and150%), was added to affixed amount of the pre analyzed sample and the amounts of the drug were analyzed by the proposedmethod.
Robustness
The robustness of the method was determined by making slight changes in the chromatographic conditions like flow rate (±0.1), temperature(±5),and organic phase of the mobile phase (±10%). It was observed that there were no marked changes in the chromatograms, which demonstrated that the RP-HPLC method developed was robust.
RESULTS AND DISCUSSION Calibrationcurve
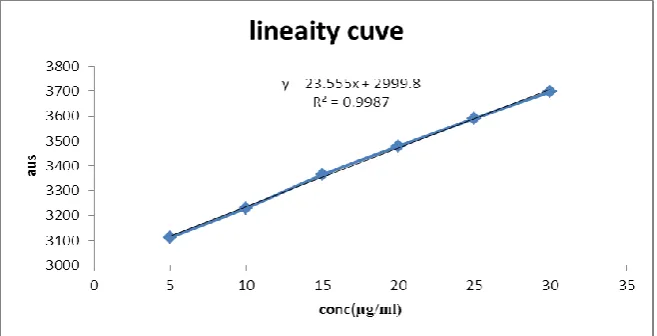
The coefficient correlation r, slope and intercept were 0.998, 2 3.55 and 22997 for AGOMELATINE with UV detection with absorbance maxima at 230 nm. The retention times were 2.76 min for AGOMELATINE. Linear regression of data from the calibration curve indicated a linear response over the concentration range of drug. The curve can be therefore be used for determination of Agomelatine.
Validation Linearity
The co efficient of determination (r2) for Agomelatine was 0.998 (Table 1 andFigs.1).
Sensitivity
Systemsuitability
System suitability was evaluated by six replicate injections of 100μg/mL standard solutions of Agomelatine. The parameters, such as tailing factor, per cent relative standard deviation (RSD) and theoretical plates were studied and found satisfactory (Table 2).
Precision
The relative standard deviation was found to be < 2.0% for Agomelatine indicating satisfactory precision Shown in Tables-3. The inter mediate precision of the expected results is expressed as a percentage.
Accuracy
Accuracy is the closeness of the test results to that of the true value, which can be determined in terms of percent recovery. To check the accuracy of the method, recovery studies were carried out by addition of standard drug solution to preanalyzed sample solution at three different levels 50, 100 and 150%. The results of recovery studies was tabulated and found satisfactory (Tables4).
Robustness
Robustness determines the reproducibility of the test result with small and deliberate variations in the method parameters. The experiment was carried out by slightly changing the chromatographic conditions like flow rate (±0.1), temperature (±5), and organic phase of the mobile phase (±10%). The retention times of the analytes did not change significantly when the flow rate, mobile phase ratio and temperature were changed. The statistical data (table-5) gives no significant variations in the above parameters indicating that the method is robust.
Table 1: Linearity range of Agomelatine. S.no. Concentration
(µg/mL)
Area of the
peak Statistical analysis 1 5 3112.082
Slope=23.55 Correlation coefficient=0.998 2 10 3230.123
Figure 1: Linearity curve.
Table 2: System suitability data of the proposed method.
Acceptance criteria: The %RSD should not be more than 2 %
Table 3:Method Precision.
S.No. RT Area
1 2.731 3105.075 2 2.750 3163.570 3 2.738 3164.751 4 2.731 3195.872 5 2.73 3267.703 6 2.741 3191.619 Avg 2.736 3102.419 Stdev 0.0078 53.2622
%RSD 0.04 0.12
Table 4: Accuracy data of the proposed method.
System suitability parameters Results Retention time 2.76
Area 3156.483
Theoretical plate number 3254 Tailing factor 1.17
Spike level
Mixture of pure and formulation
Con. of pure drug, µg/ml
Conc. Of Formulation,
µg/ml
Table 5: Robustness data of the proposed method.
S.no. Variation
Chromatographic parameters retention time
(min) Peak area 1. a)Buffer 1% 3.417 3858.344
b)Buffer 2% 2.300 2138.487 2. a)Flow rate at 0.8mL/min 2.757 3691.640 b)flow rate at 1.2 mL/min 2.747 2725.176
Table 6: Optimized chromatographic conditions of the proposed method.
S. No. Parameter Value
1. Mobile phase Acetonitrile: buffer (45:55v/v) 2. Diluent Mobile phase
3. Stationary phase Phenomenex Luna C18, 250 X 4.6 mm 5μm
4. Flow rate 1 mL/min 5. Column temperature Ambient 6. Volume of injection 20μL 7. Detection wavelength (λmax) 230nm
8. Run time 10 min 9. Retention time 2.76 min
CONCLUSIONS
The proposed method reverse phase high performance liquid chromatography (RP-HPLC) method has been developed for estimation of Agomelatine in its Tablet dosage form. Separation was done by using mobile phase consists of mixture of Acetonitrile and buffer in the ratios of 45:55%v/v. The percentage recovery of was found to be 98.89%-100.50%. Proposed method was found to be simple, accurate, precise and rapid. The statistical parameters and recovery studies were carried out and reported. The results obtained were satisfactory and good in agreement as per the ICH guidelines.
REFERENCES
1. Sridhar T, Meghana M, Rajkumar V. Development and validation of stability indicating RP-HPLC Method for the estimation of Agomelatine in API. Research Journal of Pharmaceutical, Biological And Chemical Science., 2004; 627.
2. Noha Rashed S, Manal Fouad M, Ali K. Validated Stability Indicating High Performance Liquid Chromatography and Spectroscopic Methods For Determination of Agomelatine. World Journal of Pharmacy and Pharmaceutical Science., 2014; 3(6): 113-124.
dosage form. Journal of Chemical And Pharmaceutical Research., 2013; 5(12): 1162-1167.
4. Validation of analytical procedures: Text and Methodology, ICH HarmonisedTripatite Guideline Q2 (R1), Commission of the European Communities., 2005.
5. Basic Education in Analytical Chemistry. Analytical Science., 2001; 1(12).
6. Michael E, Schartz S, Krull, 2004. Analytical method development and validation.
7. Berry RI, Nash AR. Pharmaceutical Process validation; Analytical method validation. New work., 1993; 11-28.
8. Quality Assurance of Pharmaceuticals Geneva, World Health Organization, 1999.
9. Method Validation guidelines, 1996. International Conference on Hormonization. GENEVA.
10.Glajh L, Kikaland J, Synder R. Pactical HPLC method development, Ed-2nd, Jon Wiley and sons, New York, 1996; 234-260.
11.Ashutoshkar S. Pharmaceutical drug Analytical, Ed-2nd, new age international (p) limited publishers, 2005; 452-474.
12.Rama Rao, Murthy G, Khadgapathi P. High Performance Liquid Chromatography and its role in Pharmaceutical analysis, Eastern Pharmacist, 1986; 20: 53-59.
13.Sastry C.S.P, Prasad T.N.V, Rao E.V,. Recent application of High performance Liquid Chromatography in Pharmaceutical Analysis, Indian Pharma Education., 1987; 21: 37-40. 14.Skoog DA, West DM, Holler FJ, Crouch SR, IN; Fundamentals of analytical Chemistry.
8th ed. 256.