The Thirty-First AAAI Conference on Innovative Applications of Artificial Intelligence (IAAI-19)
Ensemble Machine Learning for
Estimating Fetal Weight at Varying Gestational Age
Yu Lu,
1Xi Zhang,
1Xianghua Fu,
1Fangxiong Chen,
2Kelvin K. L. Wong
3,∗1Faculty of Arts and Sciences, Shenzhen Technology University, Shenzhen, China 2School of Automation, Guangdong University of Technology, Guangzhou, China 3Shenzhen Institutes of Advanced Technology, Chinese Academy of Sciences, Shenzhen, China
∗Corresponding author: [email protected]
Abstract
Obstetric ultrasound examination of physiological parame-ters has been mainly used to estimate the fetal weight dur-ing pregnancy and baby weight before labour to monitor fetal growth and reduce prenatal morbidity and mortality. How-ever, the problem is that ultrasound estimation of fetal weight is subject to populations’ difference, strict operating require-ments for sonographers, and poor access to ultrasound in low-resource areas. Inaccurate estimations may lead to neg-ative perinatal outcomes. We consider that machine learning can provide an accurate estimation for obstetricians alongside traditional clinical practices, as well as an efficient and ef-fective support tool for pregnant women for self-monitoring. We present a robust methodology using a data set compris-ing 4,212 intrapartum recordcompris-ings. The cubic spline function is used to fit the curves of several key characteristics that are extracted from ultrasound reports. A number of simple and powerful machine learning algorithms are trained, and their performance is evaluated with real test data. We also propose a novel evaluation performance index called the intersection-over-union (loU) for our study. The results are encouraging using an ensemble model consisting of Random Forest, XG-Boost, and LightGBM algorithms. The experimental results show an loU of 0.64 between predicted range of fetal weight at any gestational age from the ensemble model and that from ultrasound. Comparing with the ultrasound method, the esti-mation accuracy is improved by 12%, and the mean relative error is reduced by 3%.
Introduction
In obstetrics, both abnormal fetal growth and fetal develop-ment are monitored via prenatal testing. However, there are few biomarkers that can be used to accurately predict the fe-tal growth restrictions (FGR) (Conde-Agudelo et al. 2013), macrosomia, and other abnormalities. Currently, estimated fetal weight (EFW) has became a central indicator for this purpose. It is essential to obtain an accurate estimation of antenatal fetal weight because potential complications may arise from excessive or low fetal birth weight during and af-ter delivery.
The prediction of a fetal birth weight just before the de-livery is able to effectively guide obstetricians to choose a more reasonable delivery mode for pregnant women. This
Copyright c2019, Association for the Advancement of Artificial Intelligence (www.aaai.org). All rights reserved.
can result in an improved delivery outcome during labour and further reduce complications for mothers and infants af-ter labour (Pressman et al. 2000). Moreover, if the FGR and adverse conditions such as intrauterine hypoxia can be de-tected in time, it would be greatly beneficial to further reduce the possibility of perinatal mortality of fetuses (Miller and Huppi 2016). Therefore, it is desired that the EFW can be accurate as possible not only at the end of the third trimester but also at any gestational week during pregnancy.
Several methods can be used to predict fetal weight in clinical practice, consisting of abdominal palpation, parturi-ent symphysio-fundal height and abdominal girth measure-ments, and obstetric ultrasound. Among them, the ultra-sound based estimation method is most reliable and objec-tive, and has been used extensively by obstetricians in China. Its principle lies is the use of a class of well-established re-gression models with multiple parameters standards for fe-tuses. But, there a number of limitations of such method. First, these regression models were proposed by different clinicians, and are not generally applicable to all popula-tions in the world. As a result, the direct use of such class of models on Chinese population may result in inaccuracy, particularly for excessive or low fetal birth weight. Second, there are also strict requirements for sonographers and spe-cific standards for equipment for performing ultrasound ex-aminations. Factors like deformed fetal head, existence of oligohydramnios and abdominal fat, and poor image quality may all affect the final estimation. Another limitation is that access to obstetric ultrasound remains poor in some most low-resource rural areas and this has significantly affected fetal weight estimation (Wanyonyi and Mutiso 2018).
Other than the traditional methods introduced, machine learning techniques can be applied in this field (Naimi, Platt, and Larkin 2018; Podda, Bacciu, and Micheli 2018; Zhu et al. 2018). The historical data of prenatal examinations can be analysed and the relationship between conceptual en-tities can be explored through their own training, generalisa-tion, self-organisageneralisa-tion, and learning ability. Thus, they are a preferable candidate to make more efficient and reasonable decisions such as fetal weight estimation.
tem-poral relationship between the gestational age and the main characteristics of fetal growth on Chinese population. The cubic spline function method was used to fit the relation-ship between characteristics such as the biparietal diameter (BPD), abdominal circumference (AC), head circumference (HC), and femur length (FL) and the gestational age. In ad-dition, we also consider maternal physiological character-istics, such as the pre-pregnancy body mass index (BMI), uterine height and abdominal circumference. Third, we pro-pose an ensemble learning model, which has obtained better prediction results than any single model. Our model is con-structed based on three machine learning algorithms and op-timised in parallel via a multi-parameter genetic algorithm, and it has been evaluated on our real dataset and compared to several other methods.
Methodology
Preprocessing
The experimental data are obtained from Shenzhen Bao’an Maternity & Child Healthcare Hospital. A total number of 5,000 samples from 2017 are randomly selected, and no gen-eral obstetrics, gynaecology and other gengen-eral medical his-tories regarding prenatal care are screened out. It was started before 16 weeks of gestation, as measured by the menstrual date and nutritional health, including the maternal height (≥153 cm), BMI (18.5 ≤ BM I < 30kg/m2), erythro-protein concentration (≥110 g/L), and whether the pregnant women receive anaemia treatments, or have any special diet recipes. It can effectively reduce the risk factors in the FGR and preterm birth.
At the same time, the distribution of pregnancy tests is not equal, and their types are different during the long observa-tion period of the pregnant women. To ensure sufficient sam-ple distributions, the examination data must be after the 16th week of pregnancy. Effective preprocessing of the data is a key step to improve the accuracy of the prediction model.
Parameters of Predictive Model A hospital identification number for the pregnant women is used as the main index to extract the health records from the beginning of the preg-nancy to the delivery for obtaining the birth weight. Y is defined as the EFW from ultrasound examination, andX is defined as the set of input parameters for the model. The fi-nal datasetX consists of 14 parameters, consisting ofxh,
xpw,xp,xn,xa,xg,xgg,xf w,xpb,xcb,xBP D,xAC,xHC,
andxF L, and the meaning of each parameter is shown in
Table 1.
Feature Standardisation After data preprocessing, 4,212 samples meet the underlying conditions. However, the dif-ferent physiological parameters have difdif-ferent units and or-ders of magnitude. To reduce these influences on the predic-tion results, the data need to be normalised before the model is trained to ensure that each feature is at the same order of magnitude. The normalisation is shown as Equation (1):
y= 2(x−xmin) xmax−xmin
−1 (1)
wherexrepresents the current feature value,xminandxmax
represent the minimum and maximum values of the current
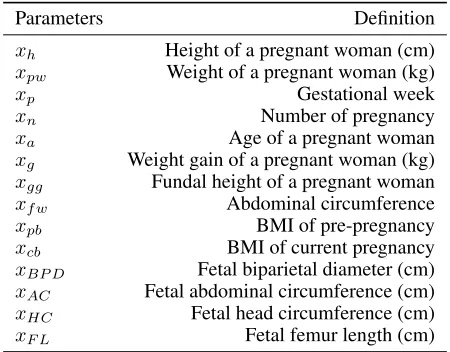
Table 1: Symbol definition of different parameters.
Parameters Definition
xh Height of a pregnant woman (cm)
xpw Weight of a pregnant woman (kg)
xp Gestational week
xn Number of pregnancy
xa Age of a pregnant woman
xg Weight gain of a pregnant woman (kg)
xgg Fundal height of a pregnant woman
xf w Abdominal circumference
xpb BMI of pre-pregnancy
xcb BMI of current pregnancy
xBP D Fetal biparietal diameter (cm)
xAC Fetal abdominal circumference (cm)
xHC Fetal head circumference (cm)
xF L Fetal femur length (cm)
feature, respectively, andy is the normalised feature value. The data range is[−1,1].
Construction of Fitted Function Despite the widespread use of ultrasound technology worldwide, people are con-cerned about the low rate of detection of fetal developmental abnormalities in routine clinical practice (Ewigman, Crane, and Frigoletto 1993). However, there is a lack of appropri-ate international standards similar to those used to monitor infant growth (de Onis 2006). In addition, there are some dif-ferences in fetal growth characteristics in different regions. Therefore, this study uses the cubic spline function method to fit four characteristics of ultrasound detection.
Specifically, at the interval[a, b],a = t0 < t1 < ... < tn < t(n+1) =b,f(x)is defined as a function of[tn, b]. If
f(x)meets the following two conditions: (1)f(x)is a cubic polynomial on each interval of[a, t1],[t1, t2],...,[tn, b]and
(2)f(x)and its second derivative are continuous atti(i =
1,2, ..., n), then the piecewise polynomial function is called the cubic spline function. The pointtiis called the node of
the spline function. The cubic spline function can be shown in Equation (2):
f(x) =di(x−ti)3+ci(x−ti)2+bi(x−ti) +ai (2)
whereti ≤ x ≤ ti+1, i = 0,1, ..., n. The sum of squared residuals for ti is P(yi −g(ti))2, and the penalised sum
of the squares of the above selection functions is shown in Equation (3):
S(f) =X(yi−f(xi)) +γ Z b
a
(f00(x))2dx (3)
For a given smoothing parameter γ (whereby γ > 0), the estimation functionf(x)minimises the values ofS(f), which is referred to as a penalty least squares estimate. The smoothing parameterγcan be given byγ =CQ3/1000,C is a given constant, andQis the interquartile range of the explanatory variable.
Ensemble Machine Learning
can increase the diversity of algorithms and reduce gener-alisation error to improve the accuracy of the results (Diet-terich 2000). This method is divided into stacking, blend-ing and votblend-ing. Ensemble methods have two basic elements: one is that the correlation between single models should be as small as possible, and the other is that the performance between single models is not too different. In practice, it is often the case that a single model with a low correlation co-efficient and good performance can significantly improve the final prediction result.
Random forest is a supervised learning algorithm (Breiman 2001). The random forest regression algorithm is a combined model, which incorporates a regression decision subtree. According to the principle of ensemble learning, the mean of each decision subtree is taken as the regression pre-diction result. The random forest is a kind of bagging al-gorithm, which focuses on reducing the variance. XGBoost (Chen and Guestrin 2006) is a boosting algorithm (Schapire 1990), which focuses on reducing the bias. However, Light-GBM (Ke, Meng, and Finley 2017) is a recently proposed algorithm. Therefore, the three classes of algorithms in this paper satisfy the diversity, correlation, and performance re-quirements. In this study, voting is used to construct an en-semble model, which is shown in Equation (4):
hα(f) =α0+α1f1i+α2f2i+α3f3i (4)
whereα1, α2, α3 are the weight parameters, α0 is a con-stant,irepresents the number ofi-th samplesi= 1,2, ..., n
andf1, f2, f3represent the predicted values of the random forest, XGboost, and LightGBM models, respectively.
Optimisation based on Genetic Algorithm
According to the above basic model analysis, the parameters that have a large impact on the prediction results of the ran-dom forest model, consisting of the following: the maximum number of features is used by a single decision treeδmax f,
the minimum number of leaf nodesδmin l, the maximum
depth of the decision treeδmax d, and the minimum number
of samples required for the internal node subdivisionδmin s.
For the XGBoost model, the influence factor mainly in-cludes the learning rateθeta, the maximum depth of the tree
θmax d, and the minimum leaf node sample weightθmin w.
Regarding the LlightGBM model, the influence factors consist of the tree model depthγmax d, the minimum
num-ber of leaf nodes γmin l, the minimum leaf node weight
γmin w, and the learning rateγeta. If a traditional grid search
method is used to optimise 15 parameters, then optimisation takes a very long time. The genetic algorithm, as an intelli-gent evolutionary algorithm, has a strong global search ca-pability. Therefore, this study proposes an ensemble model based on the multi-parameter parallel optimisation of the ge-netic algorithm. The specific steps are as follows:
1. Data preprocessing: the original data is preprocessed and divided into a training set and a testing set.
2. Initialise parameters of the genetic algorithm such as the population size, crossover probability, and mutation probability.
3. Select the optimisation parameters and interval. Accord-ing to the above analysis, there are a total of 15 param-eters to be optimised: 4 paramparam-eters of the random forest model, 3 parameters of the XGBoost model, 4 param-eters of the LightGBM model, and 4 paramparam-eters of the ensemble model. The optimal interval is determined by chromosome coding.
4. Determine the fitness function. Calculate the average rel-ative error between the predicted value and the true value, so the fitness function is shown in Equation (5):
M AP E=1 n
n X
i=1 (hα(f
i)−y i
yi
+|f
i
1−yi
yi
|
+|f
i
2−yi
yi
|+|f
i
3−yi
yi
|)
(5)
wherehα(fi)represents the ensemble model predictive
value, andyidenotes the true value. Moreover,f1i, f2i, f3i are the output values of the random forest, XGBoost, and LightGBM models, respectively, andnis the number of training sets.
5. Parameter optimisation: First, decode the chromosomes in the population; then calculate the fitness value of each generation of the population, and perform the survival of the fittest. Finally, determine whether the population per-formance satisfies the maximum number of genetics, and if so, the optimal parameter is output; otherwise, accord-ing to the genetic strategy, the selection, crossover and mutation operations are used to obtain the offspring.
6. Result judgement: if the MAPE error requirement is sat-isfied, then the optimisation is finished. Otherwise, repeat step 4.
7. Input the test sample to obtain the best prediction result. The detailed process is shown in Figure 1.
Performance Evaluation Index
This paper uses two indices to measure the performance of the ensemble model. The first index is the mean relative er-ror (MRE), which is a measure of the credibility. Ifnis the number of samples, then the MRE is shown in Equation (6):
M RE= 1 n
n X
i=1
|ytrue−ypred|
ytrue
(6)
whereytruedenotes the true label andypreddenotes the
pre-dicted fetal weight.
To better reflect the coincidence between different inter-vals, this paper introduces a novel concept, originally used in the field of image processing, namely, loU. This method can reflect the coincidence degree of different learning al-gorithms for predicting the fetal weight interval, and it is shown in Equation (7):
IoU =f 1
scope∩f
2
scope
f1
scope∪fscope2
(7)
wherefscope1 represents the fetal weight prediction range of the algorithm model andf2
scoperepresents the fetal weight
Figure 1: Fetal weight estimation process based on the ge-netic algorithm.
Results
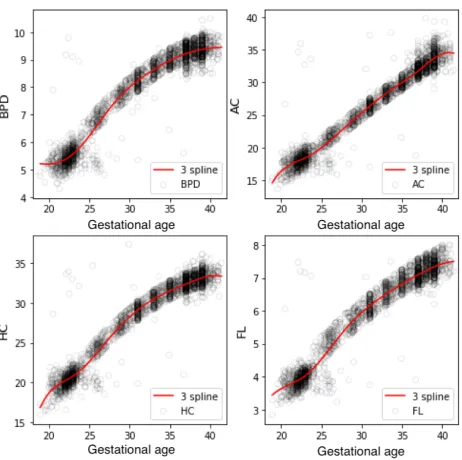
Based on the screening steps in the previous sections, a to-tal of 4,212 samples were selected, of which 3,370 samples are used as the training sets and 842 samples are used as the test sets. Then, a cubic spline function was used to establish a functional relationship between the four indexes of ultra-sound examination and the pregnancy. The fitting results are shown in Figure 2.
The fitting results of the percentile curves are shown in Table 2. Among the percentiles, theR2(determination coef-ficient) of the BPD is at least 0.953, and the MRE is at most
Figure 2: Four feature fitting curves.
0.20. The minimum R2 of the AC is 0.955, and the maxi-mum MRE is 0.22. The minimaxi-mumR2 of the HC is 0.950, and the maximum MRE is 0.24. The minimumR2of the FL is 0.951, and the maximum MRE is 0.16. The R2 of each index is above 0.95, and the MRE is within the tolerance; thus, the fitting result is satisfactory.
Evaluation of Prediction
The random forest, XGboost, LightGBM models and the en-semble model are based on the genetic algorithm. Multi-parameter parallel optimisation is used to predict the fetal weight, which is compared with the multi-parameter for-mula (Hadlock 1990) used in an ultrasonic examination. The experimental results are shown in Figure 3.
As shown in Figure 3, the MRE based on the single ma-chine learning algorithm model is approximately 8%. The MRE of the formula method in (Hadlock 1990) is 14.6%. The MRE of the ensemble model is approximately 6%. In the absence of ultrasound detection, the fitting function is used to fit the four eigenvalues as shown in Figure 2, and then the integrated model is used to predict the fetal weight range. The loU index is used to prove the effectiveness of the algorithm (see Table 3).
In Table 3, in the absence of an ultrasound examina-tion, the ensemble model, can predict the fetal weight range. Compared with the ultrasonic examination, the loU value is greater than 0.6. To some extent, the fetal weight can be pre-dicted at any gestation according to the maternal character-istic parameters and the fitted four ultrasonic charactercharacter-istic values. The prediction results of some samples are shown in Figure 4.
Table 2: Fitting results of each percentile curve.
Centile
BPD
AC
HC
FL
γ
MER
R
2γ
MER
R
2γ
MER
R
2γ
MER
R
2P95
0.3
0.16
0.954
0.4
0.22
0.958
0.4
0.20
0.956
0.4
0.16
0.951
P75
0.2
0.12
0.960
0.3
0.18
0.966
0.2
0.17
0.961
0.3
0.12
0.953
P50
0.1
0.09
0.965
0.2
0.13
0.970
0.2
0.15
0.962
0.2
0.08
0.967
P25
0.2
0.20
0.953
0.3
0.17
0.963
0.3
0.24
0.950
0.1
0.11
0.955
P10
0.3
0.15
0.955
0.1
0.23
0.955
0.1
0.18
0.957
0.2
0.09
0.960
Figure 3: Mean relative error of different models.
Table 3: IoU based on different machine learning algorithms.
Algorithms Intersection-over-Union
Random forest 0.607
XGBoost 0.623
LightGBM 0.610
Our model 0.650
and the random forest models, respectively, and the ordi-nate expresses by the predicted fetal weight range. From the graph results, after optimising the multi-model param-eters based on the genetic algorithm, the advantages of each model can be effectively utilised, so that the fetal weight prediction interval is closer to the fetal weight range of the ultrasound examination.
Analysis of Fetal Growth Change
The fetal growth curve is an important index of the fetal health status, which can provide a basis for early diagno-sis and the prevention of fetal abnormalities. At the same time, pregnant women can observe the trend of fetal weight changes in each gestational week, including the average fe-tal weight curve, the 10th percentile curve and the 90th per-centile curve. Therefore, based on the characteristic param-eters of pregnant women and the fitted ultrasound
charac-Figure 4: Mean relative error of different models.
teristic parameters, this study uses the ensemble model to predict the fetal weight at the current moment and to timely understand the trend of fetal growth.
When comparing with the 10th and 90th percentiles of China’s fetal growth standard curve (Lei and Wen 1998), if the curve is lower than the 10th percentile, the fetus is small for its gestational age (SGA), and conversely, when the curve is greater than the 90th percentile, the fetus is large for its gestational age (LGA). A sample was randomly selected from the testing set, and the fetal weight is predicted by the ensemble model proposed in this study. The experimental results are shown in Figure 5.
Discussion
Figure 5: Fetal growth prediction curve.
Mao 2000). Therefore, different algorithms are used to pre-dict fetal birth weight. The experimental results are shown in Table 4.
Table 4: Different methods that predict the fetal birth weight.
Parameters MRE (%) Accuracy (%)
Hadlock (Hadlock 1990) 10.2 52.3 GA-BP (Zhu et al. 2018) 7.5 63.1
Random forest 8.3 60.0
XGBoost 8.2 62.1
LightGBM 8.4 59.4
Proposed ensemble model 7.0 64.3
Table 4 shows that the ensemble model proposed in this paper predicts the fetal birth weight and has a certain degree of improvement in the MRE and accuracy compared with the single machine learning algorithm model and the multi-parameter method. The MRE is reduced by approximately 3%, and the accuracy is improved by approximately 12%.
Conclusion
This paper proposed a novel approach to estimating fetal weight using ensemble machine learning algorithms. The cubic spline function has been used to fit the functional re-lationship between the BPD, AC, HC, and FL and the ges-tational age based on the health records of pregnant women. An ensemble machine learning model has been proposed based on the genetic algorithm with parallel optimisation of multiple parameters to predict the fetal weight at vary-ing gestational age. We have also evaluated the applicability of the ensemble model for the domain of on real datasets. Comparing with the traditional ultrasound-based estimation methods, it obtains the EFW more accurately and efficiently. Next, there are further clinical tests in different hospitals, and software for both home and hospital applications are under development and soon to be deployed. Estimation of fetal birth weight among twins is another direction of future research.
Acknowledgements
This work is supported by the National Natural ence Foundation of China (No. 61272328) and 2017 Sci-ence and Technology Plan Project of Shenzhen, China (KJYY20170721163528274).
References
Breiman, L. 2001. Random Forests.Machine Learning45(1):5–32. Chen, T., and Guestrin, C. 2006. XGBoost: A Scalable Tree Boost-ing System. InKDD 2016, 785–794.
Conde-Agudelo, A.; Papageorghiou, A. T.; Kennedy, S. H.; and Villar, J. 2013. Novel biomarkers for predicting intrauterine growth restriction: a systematic review and meta-analysis. BJOG 120(6):681–694.
de Onis, M. 2006. WHO Child Growth Standards based on length/height, weight and age. Acta Paediatrica 95(S450): 76–85.
Dietterich, T. G. 2000. An Experimental Comparison of Three Methods for Constructing Ensembles of Decision Trees: Bagging, Boosting, and Randomization.Machine Learning40(2):139–157. Ewigman, B. G.; Crane, J. P.; and Frigoletto, F. D. 1993. Effect of Prenatal Ultrasound Screening on Perinatal Outcome.The New England Journal of Medicine329(12):821–827.
Hadlock, F. P. 1990. Sonographic estimation of fetal age and weight.Radiologic Clinics of North America28(1):39–50. Jain, A. K.; Duin, R. P. W.; and Mao, J. 2000. Statistical pattern recognition: a review.IEEE T. PAMI22(1):4–37.
Ke, G.; Meng, Q.; and Finley, T. 2017. LightGBM: A Highly Efficient Gradient Boosting Decision Tree. InNIPS 2017. Lei, H., and Wen, S. W. 1998. Ultrasonographic examination of intrauterine growth for multiple fetal dimensions in a chinese pop-ulation.AJOG178(5):916–921.
Miller, S. L., and Huppi, P. S. 2016. The consequences of fetal growth restriction on brain structure and neurodevelopmental out-come. Journal of Physiology594(4):807–823.
Naimi, A. I.; Platt, R. W.; and Larkin, J. C. 2018. Ma-chine Learning for Fetal Growth Prediction. Epidemiology29(2): 290–298.
Podda, M.; Bacciu, D.; and Micheli, A. 2018. A ma-chine learning approach to estimating preterm infants survival: development of the Preterm Infants Survival Assessment (PISA) predictor.Scientific Reports8(13743):1–9.
Pressman, E. K.; Bienstock, J. L.; Blakemore, K. J.; Martin, S. A.; and Callan, N. A. 2000. Prediction of birth weight by ultrasound in the third trimester.Obstetrics & Gynecology95(4):502–506. Schapire, R. E. 1990. The strength of weak learnability. Machine Learning5(2):197–227.
Wanyonyi, S. Z., and Mutiso, S. K. 2018. Monitoring fetal growth in settings with limited ultrasound access. Best P&R Clinical Ob-stetrics & Gynaecology49:29–36.