Leverage and Stock Returns: Evidence from Istanbul Stock Exchange
Hakkı Öztürk1
& Ayşe Altıok Yılmaz2 1
Department of International Finance, Bahçeşehir University, Istanbul, Turkey 2 Department of Business Administration, Bahçeşehir University, Istanbul, Turkey
Correspondence: Ayşe Altıok Yılmaz, Department of Business Administration, Bahçeşehir University, Çırağan Cad. No: 4-6, 34353, Beşiktaş-Istanbul, Turkey. Tel: 90-212-381-0476
Received: October 13, 2015 Accepted: November 3, 2015 Online Published: November 5, 2015
doi:10.5430/afr.v4n4p140 URL: http://dx.doi.org/10.5430/afr.v4n4p140
Abstract
This paper examines the empirical relationship between Market risk premium, Market/Book Equity, Market/Total Assets and stock returns of 183 firms listed in Borsa Istanbul over the period 2003-2013/6 using panel data analysis. In addition, the aim of this paper is to search for the leverage effect on stock returns. We find statistically significant evidence showing that market risk premium, Market/Book Equity, Market/Total Assets explain stock returns. The results are consistent with the literature. Market value/book value has a negative coefficient whereas market value/total assets has a positive coefficient. Since leverage is the difference between book value and total assets, the leverage effect of the MV/TA leads to the sign change of the coefficient. The result implies the effect of leverage on the stock returns. Companies with low Price/Equity ratios generate higher returns and stocks with lower leverage levels perform better than the ones with higher leverage ratios in Borsa Istanbul.
Keywords: Stock return, Stock price, Leverage, Three-Factor Model, Istanbul Stock Exchange, Panel data, Asset pricing, Portfolio theory
1. Introduction
It is a most important issue in finance literature to identify the variables that affect stock return and the stock price. The capital asset pricing models are the main financial research tools trying to explain the behavior of common stocks. The issue was brought to light by Markowitz (1952) single period model where the investor’s main aim is to maximize the expected return of the portfolio subject to a desired level of risk. Following the Modern Portfolio Theory of Markowitz (1952), different asset pricing models have been developed to show the relationship of excess portfolio returns to excess market returns. Sharpe (1964) and Lintner (1965) developed a model to explain this relationship which is called as Capital Asset Pricing Model (CAPM). The model is based on only one risk factor which is beta that measures the systematic risk. In Capital Asset Pricing Model, beta explains variations of the excess portfolio return defined as the covariance of portfolio return with the market portfolio return divided by the variance of the market portfolio. Black (1972) by the assumption of riskless asset developed zero-beta CAPM. Merton (1973) developed an intertemporal model of the capital market. According to the capital asset pricing model (CAPM) Beta (β) is considered as the only variable that is capable of predicting the stock return and the variables other than beta should not have power in explaining the cross-section of expected stock returns. Contrary to the CAPM model, previous empirical studies demonstrated that there are other factors that have important explanatory power for expected stock returns, other than beta. The most significant idiosyncratic factors are firm size, book to market, debt to equity, and price to earnings ratio. (Banz (1981), Chan et al. (1991), Rosenberg et al. (1985))
The aim of this study is to test other possible factors in explaining the stock returns. These factors are market value to book value, market value to total asset and market risk premium. In what follows, we summarized the highlights of the literature related to asset pricing. Section 3 describes the empirical research. The outcome of applying the methodology to data is given in section 4. Summary and concluding findings are provided in section 5.
2. Literature Review
book-to market equity ratio, BE/ME, (3) Price-Earnings ratio, P/E and (4) leverage ratio (Total Debt/Total Assets) all of which have a strong role in explaining average returns.
Basu (1977) empirically tested the relationship between investment performance of equity securities and their P/E ratios. He assumed that the asset pricing model is valid. He demonstrated that P/E ratio information is not “fully reflected” in security prices as quickly as suggested by the semi-strong form of the efficient market hypothesis. He concluded that publicly available P/E ratios have “information content” and may warrant an investor’s attention at the time of portfolio formation or revision.
Banz (1981) found that firms that have small market capitalization lead to higher returns when compared to the large size firms even after adjusted for their systematic risks. Market equity has an explanatory power on the average returns. Rosenberg et al. (1985) found that BE/ME, namely the ratio of a firm’s book value of common stock to its market value, is positively related to the average returns in the US stock markets. Similarly, Chan et al. (1991) also found a positive relationship between BE/ME and average returns in the Japan stock market.
Reinganum (1981) investigated whether differences in estimated portfolio betas are reflected in differences in average portfolio returns. The findings of his study demonstrated that the returns of high beta portfolios are not significantly different from the returns of low beta portfolios.
Daniel and Titman (1997) with a focus on the Japanese market showed that book-to-market equity can explain the cross-sectional variation of stock returns. Chui and Wei (1998) analyzed the effect of beta, book-to-market equity, and size on the expected stock returns in five Asian emerging markets. They found that the relationship between average stock return and beta is weak for all five markets. However the book-to-market equity is significant in explaining the expected returns in Hong Kong, Korea, and Malaysia, while the size effect is significant in all five markets except Taiwan.
Arbitrage Pricing Theory (APT) is one of the alternative models to CAPM which developed by Ross (1976) and later extended by Huberman (1982), Chamberlin and Rothschild (1983), and Ingersoll (1984). The arbitrage pricing theory suggests that security returns are a linear function of an unknown number of unspecified factors.
There are many empirical studies that tested APT by using US stock data. For instance, Roll and Ross (1980) and Chen (1983), found that there are three or four factors which are priced in US stock market. In Canadian stock market, Hughes (1982) and Lam (1988) demonstrated that there are also three to four factors that significantly explain stock returns. In UK market, Antoniou et.al, (1998) find that there are three factors which are priced. The empirical evidences from the APT tests indicates that there is more than one factor which explain returns in stock market.
Fama and French, in a series of papers, (1992, 1993, 1995, 1996) demonstrated that a three-factor model explains most part of the cross-sectional variation in average returns of portfolios. These three factors are the excess return on the market portfolio, the size and the book to market. At the same time, there are other multifactor models which have been proposed to explain the cross-section of average returns. These models generally use macroeconomic variables as factors to explain stock returns. Chen et al. (1986) found that industrial production, measures of unanticipated inflation, changes in the risk premium and shifts in the yield curve are significiant in explaining stock returns in U.S. Jagannathan and Wang (1996) used labor income, in addition to the market return to explain stock returns.
Several studies employ Fama-French three factor model to explain the stock returns’ variation in Borsa Istanbul. Akdeniz et.al.(2000) found that stock returns in BIST vary directly with book-to-market and inversely with firm size. Aydoğan and Gürsoy, (2000) found no significant relationship between P/E ratio and book-to-market ratio with expected returns in emerging markets. Aksu and Önder (2003) demonstrated significant size effect on returns by applying F-F three factor model to BIST. Gonenc and Karan (2003) tested book-to-market and size effect on returns in BIST and find no evidence of significant relationship in BIST.
choose low leverage levels and return premium for low leverage firms can be seen as a compensation for default probability.
Muradoğlu and Sivaprasad (2012) focused on the role of leverage in forecasting stock returns. They use leverage ratio as a risk factor in a five factor model following Fama-French three factor model. They find that the returns of firms with low leverage are negatively correlated with the leverage factor.
All of the above studies suggested that expected returns of stocks are not explained by beta only. The purpose of this paper is then to investigate the relation between stock returns and market risk premium (Rm-Rf), market to book value (MV/BV) and market value to total assets (MV/TA) in order to capture the leverage effect by using the panel data approach on stocks listed in İstanbul Stock Exchange (BIST100) for the period 2003/1-2013/6
3. Empirical Research
3.1 Data
All of the data for the analysis is taken from Finnet Databases and Istanbul Stock Exchange. The data set contains non-financial 183 firms listed in BIST(Borsa Istanbul) for the period between 2003/1 and 2013/6. Monthly data is used. 126 months and 183 stocks gene rate 23058 number of observations in panel data regression. The monthly returns adjusted for dividends and equity offerings are obtained for 183 domestic stocks using Istanbul Stock Exchange Databank. As a proxy of market portfolio (Rm), monthly returns of BIST100 index is used between the period 2003/1-2013/6. Benchmark goverment bond of Turkish Treasury in domestic currency is a proxy of risk free rate (Rf). In finance literature, it is accepted that goverment-bonds and T- bills in local curreny are proxy for risk free rates since goverments control the printing of local currency (Damodaran, 2002; Zhang and Wihlborg, 2010). The average monthly yields of benchmark goverment bond are calculated using the data from Istanbul Stock Exchange in the sample period.
We use 3 specific independent variables namely market risk premium (Rm-Rf), Market Value/Book Value (MV/BV), Market Value/Total Assets (MV/TA) as explanatory variables for stock returns. We know from the finance literature market risk premium is one of the strongest variable that effects the stock returns. Moreover, to catch the levarage effect, we use MV/BV, and MV/TA, since we focus on the leverage in this study. The difference between the totals assets and book value is the leverage. The dependent variable used in this study is monthly stock returns. For MV/BV and MV/TA, end of monthly data are also used.
3.2 Methodology
Panel data analysis is employed in order to examine the relationship between chosen variables and the stock returns. The use of panel data has several major advantages over purely cross-sectional or purely time-series data. First of all, by pooling the data the panel analysis improves the accuracy of the parameter estimates and thus allows the estimation procedure to have more degrees of freedom and sample variability. Secondly, panel estimation procedure gives the opportunity to reduce estimation bias. Finally, it provides the specification of more complicated behavioral hypothesis. Furthermore, this model allows modeling the differences among the subjects, referred to ‘heterogeneity’.
The empirical test involves the market and firm specific variables and monthly stock returns. The model is:
Rit = α0 + β1(Rm-Rf)t+ β2MV/BVit + β3MV/TAit + εit where,
Rit is the stock return of company i at time t. (Rm-Rf) is the market risk premium at time t
MV/BVit is the ratio of market capitalization to book value for company i at time t (price to equity) MV/TAit is the ratio of market value to total assets for company i at time t
εit is the error term
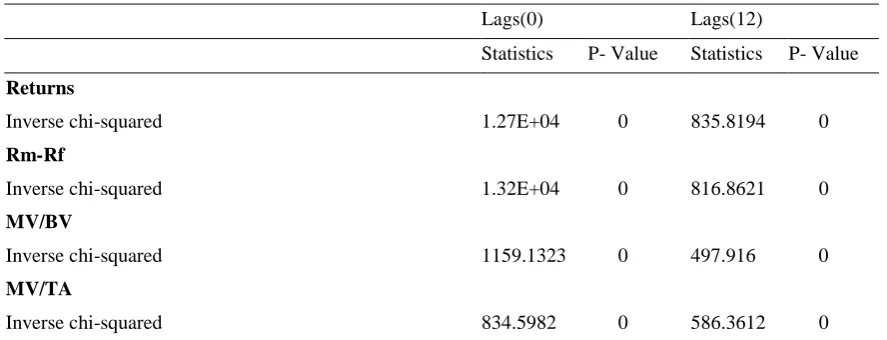
Table 1. Unit Root Tests Based on Augmented Dickey Fuller
The results of the unit root tests based on Augmented Dickey Fuller with zero lags and 12 lags are given in Table 1. Time trend is included. The results indicate that there are no unit roots for dependent and independent variables. The series are stationary.
The parameters of the panel data regression can be estimated by fixed effect and random effect models. The choice between the fixed effect and random effect model has been a controversial issue among econometricians for many years. The selection of the appropriate model depends on the assumptions concerning the relationship of the exogenous variables, both cross-sectionally and across time, assumptions regarding the error term(s), and/or the researcher’s desires to obtain either less bias or greater efficiency in the estimators.
The fixed effects model is expected to be the appropriate method since our estimating sample is identical to the population of interest and does not include time-invariant regressors. However, as it is common in the literature, the appropriate model that most fits the sample and the objective of the research must be selected. Hausman and Taylor (1981) test is used to determine whether to use random effects or fixed effects model. In Hausman Test, the correlation between individual effects and regressors is tested under the null hypothesis of there is no correlation between individual effects and regressors.
Hausman test result which is given in Table 2 indicates that the test results are significant and according to the results fixed effects model is preferred instead of the random effects model in our equation. According to the statistic of Chi Square, fixed effect model is appropriate. Therefore fixed-effect panel data regression is used in the analysis.
Table 2. Hausman Test
Statistic Probability
Chi Square 67.91 0
4. Results
The results of the panel data regression are given in Table 3.
Table 3. Results of the Panel Data Regression
Returns Coefficient t-statistic Pr
1
0.809099 68.030000 0.0000002
-0.000833 -3.300000 0.0010003
0.021173 14.69 0.000000Constant 0.001277 0.830000 0.404000
R -Square(Overall) 0.174000 Durbin Watson 1.947280
Table 3 shows the results of the panel data analysis. There is statistically no evidence of autocorrelation since the
Durbin Watson (d statistic) is 1.95. The coefficients of (Rm-Rf), MV/BV and MV/TA which are
1,
2 andLags(0) Lags(12)
Statistics P- Value Statistics P- Value
Returns
Inverse chi-squared 1.27E+04 0 835.8194 0
Rm-Rf
Inverse chi-squared 1.32E+04 0 816.8621 0
MV/BV
Inverse chi-squared 1159.1323 0 497.916 0
MV/TA
3
are significant according to t-statistics. The results indicate that the percentage of total variance in stock returns explained by this study’s model was 17%. Accordingly the coefficients
1,
2 and
3are significant in the model.Market risk Premium (
1) as expected has a positive coefficient meaning that higher market risk premiums generate higher returns which is consistent with the literature.Market value to book value (
2 ) has a negative coefficient and market value to total assets (
3) have positive coefficient. Negative coefficient of MV/BV indicates that returns are inversely related with MV/BV ratios. Low Price/Book ratios generate higher returns and high Price/Book ratios generate lower returns. These results are consistent with the literature. A long literature in empirical finance has isolated a “value” effect in asset pricing. Studies such as Basu (1983) and Keim (1983) have shown that stocks selling at low prices relative to their earnings and book values have generate higher returns for investors. Portfolios made up of stocks with low market values (MV) relative to book values (BV) earn excess risk-adjusted returns when risk is measured by beta from the Capital Asset Pricing Model (CAPM). However any test of market efficiency is a joint test of the relationship of returns to MV/BVs and the efficacy of CAPM’s beta to fully measure risk. According to Fama and French, the ratio of market value to book value itself is a risk measure, and therefore the larger returns generated by low MV/BV stocks are simply a compensation for risk.The coefficient of MV/TA (
3) is positive which means that higher MV/TA ratios create higher returns. Since leverage is the difference between total assets and book value, the leverage effect of the MV/TA leads to the sign change of the coefficient. If equity is held constant, lower total debt would lead to lower total assets which make higher MV/TA ratio and higher returns. This indicates that if companies have lower debt, the returns of the listed stocks in Borsa Istanbul increase. This result captures the effect of leverage on the stock returns.5. Conclusion
In this study, our model explains stock returns by using the market risk premium (Rm-Rf), Market Value/Book Value (MV/BV), Market Value/Total Assets (MV/TA). Our aim in choosing these variables is also to capture the affect of leverage on stock returns since the difference between two variables, namely Market Value/Total Assets and Market Value/Book Value, is the leverage. Results of the model indicate that the coefficients of market value/book value and market value/total assets and market risk premium are significant in explaining the stock returns. Market value/book value has a negative coefficient whereas market value/total assets has a positive
coefficient. According to the negative
2, lower price/equity ratios create higher return. The analysts in the financial sector should search for the companies with lower Price/Book ratios compared to the average of comparable firms in the industry to generate higher returns. The coefficients of market value/book value and market value/total assets have different signs and we explain this difference with the leverage effect. Since the only difference between total assets and book value is leverage, it explains the sign difference between MV/BV and MV/TA.Controlling for equity, when total debt of a company is higher, (which also makes total asset high) then MV/TA
becomes lower. According to the positive
3, this result creates lower returns. The returns of the listed stocks in Borsa İstanbul decrease; if these companies have higher debt and vice versa.References
Akdeniz, L., Altay-Salih, A., & Aydogan, K. (2000). Cross Section of Expected Stock Returns in ISE. Russian and
East European Finance and Trade, 36(5), 6–26.
Aksu, M. H., & Onder, T. (2003). The Size and Book-To-Market Effects and Their Role as Risk Proxies in the
Istanbul Stock Exchange. Koç University Working Paper, 2000–04.
Antoniou, A., Garrett, I., & Priestley, R. (1998). Macroeconomic variables as common pervasive risk factors and the empirical content of the arbitrage pricing theory. Journal of Empirical Finance, 5, 221–240. http://dx.doi.org/10.1016/S0927-5398(97)00019-4
Aydoğan, K., & Gürsoy, G. (2000). P/E and Price-to-Book Ratios as Predictors of Stock Returns in Emerging Equity Markets. Emerging Markets Quarterly, 4(4), 60–67.
Banz, R.W. (1981). The relationship between return and market value of common stocks. Journal of Financial
Basu, S. (1977). Investment Performance of Common Stocks in Relation to Their Price-Earnings Ratios: A Test of the Efficient Market Hypothesis. The Journal of Finance, 32(3), 663–682. http://dx.doi.org/10.1111/j.1540-6261.1977.tb01979.x
Bhandari, L. C. (1988). Debt/Equity Ratio and Expected Common Stock Returns: Empirical Evidence. The Journal
of Finance, 43(2), 507–528. http://dx.doi.org/10.1111/j.1540-6261.1988.tb03952.x
Black, F. (1972). Capital Market Equilibrium with Restricted Borrowing. The Journal of Business, 45(3), 444-455. http://dx.doi.org/10.1086/295472
Breeden, D. T.. Gibbons,X. & Litzenberger, R. (1989). Empirical tests of the consumption-oriented CAPM,
Journal of Finance, 44, 231-262.
Chamberlain, G., & Rothschild, M. (1983). Arbitrage Factor Structure and Mean-Variance Analysis on Large Asset Markets, Econometrica, 51, 1281-1304. http://dx.doi.org/10.2307/1912275
Chan, L.K.C., Hamao, Y. & Lakonishok, J. (1991). Fundamentals and stock returns in Japan. Journal of Finance, 46, 1739–1764. http://dx.doi.org/10.1111/j.1540-6261.1991.tb04642.x
Chen, N. (1983). Some empirical tests of the theory of arbitrage pricing, Journal of Finance, 28, 401-418. http://dx.doi.org/10.1111/j.1540-6261.1983.tb03831.x
Chen, N., Roll, R. & Ross, S. A. (1986). Economic Forces and the Stock Market. Journal of Business, 59(3), 383-403. http://dx.doi.org/10.1086/296344
Chui, C.W., Wei, K.C. (1998). Book-to-market, firm size, and the turn-of-the-year effect: evidence from Pacific-Basin emerging markets. Pacific-Basin Finance Journal, 6, 275–293. http://dx.doi.org/10.1016/S0927-538X(98)00013-4
Damodaran, A. (2002). Investment Valuation, Tools and Techniques for Determining the Value of Any Asset, 2.b.,
New York: John Wiley & Sons.
Daniel, K. & Titman, S. (1997). Evidence on the Characteristics of Cross Sectional Variation in Stock Returns.
Journal of Finance, 52(1), 1-33. http://dx.doi.org/10.1111/j.1540-6261.1997.tb03806.x
Fama, E. F., & French, R. K. (1992). The Cross-Section of Expected Stock Returns. The Journal of Finance, 47(2), 427–465. http://dx.doi.org/10.1111/j.1540-6261.1992.tb04398.x
Fama, E. F., & French, R. K. (1993). Common Risk Factors in the Return of Stocks and Bonds. The Journal of
Finance, 33, 3–56. http://dx.doi.org/10.1016/0304-405x(93)90023-5
Fama, E.F. & French K. R. (1995). Size and Book-to-market factors in Earnings and Returns. Journal of
Finance,50(1), 131-155. http://dx.doi.org/10.1111/j.1540-6261.1995.tb05169.x
Fama, E.F., French, K.R. (1996). Multifactor explanations of asset pricing anomalies. Journal of Finance, 51, 55–84. http://dx.doi.org/10.1111/j.1540-6261.1996.tb05202.x
George, T. J., & Hwang, C. Y. (2009). A Resolution of the Distress Risk and Leverage Puzzles in the Cross Section of Stock Returns. Journal of Financial Economics, 96, 56–79. http://dx.doi.org/10.1016/j.jfineco.2009.11.003
Gonenc, H., & Karan, M. B. (2003). Do Value Stocks Earn Higher Returns than Growth Stocks in an Emerging Market? Evidence from the Istanbul Stock Exchange. Journal of International Financial Management and
Accounting, 14(1), 1–25. http://dx.doi.org/10.1111/1467-646X.00088
Huberman, G. (1982). A Simple Approach to Arbitrage Pricing Theory, Journal of Economic Theory, 28, 183-191. http://dx.doi.org/10.1016/0022-0531(82)90098-9
Hughes, P. (1982). A Test of Arbitrage Pricing Theory, unpublished manuscript University of British Colombia.
Ingersoll, J. (1984). Some Results on the APT, Journal of Finance, 34, 1021-1039.
Jagannathan, R., & Wang, Z. (1996). The conditional CAPM and the cross-section of expected returns, Journal of
Finance, 51, 3-53. http://dx.doi.org/10.1111/j.1540-6261.1996.tb05201.x
Korteweg, A. (2010). The Net Benefits to Leverage. The Journal of Finance, 65(6), 2137–2170. http://dx.doi.org/10.1111/j.1540-6261.2010.01612.x
Lintner, J. (1965). The valuation of risk assets and the selection of risky investments in stock portfolios and capital budgets, The Review of Economics and Statistics, 47, 13-37. http://dx.doi.org/10.2307/1924119
Markowitz, H. (1952). The Utility of Wealth, Journal of Political Economy, 60, 151-158. http://dx.doi.org/10.1086/257177
Merton, R.C. (1973). An Intertemporal Capital Asset Pricing Model. Econometrica, 41(5), 867-887. http://dx.doi.org/10.2307/1913811
Muradoglu, Y. G., & Sivaprasad, S. (2012). Using Firm-Level Leverage as an Investment Strategy. Journal of
Forecasting, 31, 260–279. http://dx.doi.org/10.1002/for.1221
Penman, S. H., Scott, A. R., & Tuna, I. (2007). The Book-to-Price Effect in Stock Returns: Accounting for Leverage.
Journal of Accounting Research, 45(2), 427–467. http://dx.doi.org/10.1111/j.1475-679X.2007.00240.x
Reinganum, M. R. (1981). Abnormal Returns in Small Firm Portfolios. Financial Analysts Journal, 37(2), 52-57. http://dx.doi.org/10.2469/faj.v37.n2.52
Rosenberg, B., Reid, K. & Lanstein, R. (1985). Persuasive Evidence of Market Inefficiency, Journal of Portfolio
Management, 11, 9-17. http://dx.doi.org/10.3905/jpm.1985.409007
Roll, R. & Ross, S. (1980). An Empirical Investigation of the Arbitrage Pricing Theory, Journal of Finance, 20, 1073-1103. http://dx.doi.org/10.1111/j.1540-6261.1980.tb02197.x
Ross, S. A., (1976). The Arbitrage Theory of Capital Asset Pricing, Journal of Economic Theory, 13, 341-360. http://dx.doi.org/10.1016/0022-0531(76)90046-6
Sharpe, W. (1964). Capital Asset Prices: A Theory of Market Equilibrium under Conditions of Risk. Journal of
Finance, 19(3), 425-442.
Zhang, J. & Wihlborg, C. (2010). CAPM in Up and Down Markets: Evidence from Six European Emerging Markets.