RESEARCH
Visualizing wax ester fermentation
in single
Euglena gracilis
cells by Raman
microspectroscopy and multivariate curve
resolution analysis
Keita Iwasaki
1, Asuka Kaneko
2, Yuji Tanaka
2,3, Takahiro Ishikawa
2,3, Hemanth Noothalapati
4*and Tatsuyuki Yamamoto
2,4*Abstract
Background: Global demand for energy is on the rise at a time when limited natural resources are fast depleting. To address this issue, microalgal biofuels are being recommended as a renewable and eco-friendly substitute for fossil fuels. Euglena gracilis is one such candidate that has received special interest due to their ability to synthesize wax esters that serve as precursors for production of drop-in jet fuel. However, to realize economic viability and achieve industrial-scale production, development of novel methods to characterize algal cells, evaluate its culture conditions, and construct appropriate genetically modified strains is necessary. Here, we report a Raman microspectroscopy-based method to visualize important metabolites such as paramylon and ester during wax ester fermentation in single Euglena gracilis cells in a label-free manner.
Results: We measured Raman spectra to obtain intracellular biomolecular information in Euglena under anaero-bic condition. First, by univariate approach, we identified Raman markers corresponding to paramylon/esters and constructed their time-lapse chemical images. However, univariate analysis is severely limited in its ability to obtain detailed information as several molecules can contribute to a Raman band. Therefore, we further employed multivari-ate curve resolution analysis to obtain chain length-specific information and their abundance images of the produced esters. Accumulated esters in Euglena were particularly identified to be myristyl myristate (C28), a wax ester candidate suitable to prepare drop-in jet fuel. Interestingly, we found accumulation of two different forms of myristyl myristate for the first time in Euglena through our exploratory multivariate analysis.
Conclusions: We succeeded in visualizing molecular-specific information in Euglena during wax ester fermentation by Raman microspectroscopy. It is obvious from our results that simple univariate approach is insufficient and that multivariate curve resolution analysis is crucial to extract hidden information from Raman spectra. Even though we have not measured any mutants in this study, our approach is directly applicable to other systems and is expected to deepen the knowledge on lipid metabolism in microalgae, which eventually leads to new strategies that will help to enhance biofuel production efficiency in the future.
© The Author(s) 2019. This article is distributed under the terms of the Creative Commons Attribution 4.0 International License (http://creativecommons.org/licenses/by/4.0/), which permits unrestricted use, distribution, and reproduction in any medium, provided you give appropriate credit to the original author(s) and the source, provide a link to the Creative Commons license, and indicate if changes were made. The Creative Commons Public Domain Dedication waiver (http://creativecommons.org/ publicdomain/zero/1.0/) applies to the data made available in this article, unless otherwise stated.
Open Access
*Correspondence: [email protected]; [email protected]
2 Faculty of Life and Environmental Science, Shimane University, Matsue 690-8504, Japan
4 Raman Project Center for Medical and Biological Applications, Shimane University, Matsue 690-8504, Japan
Background
Fossil fuels contribute to two-thirds of the global energy demand out of which oils contribute 33% [1, 2]. In an age of increasing population growth, overconsump-tion, and depleting oil supplies, continued use of petro-leum sourced fuels is both unsustainable and damaging to environment with long-standing negative impacts on public health and global climate [3, 4]. Therefore, there is an urgent need to find suitable renewable energy sources. Microalgal biofuels are currently the most favored sub-stitute for liquid fossil fuels than other nontoxic, eco-friendly alternatives such as plant or animal biomass derived energy. Microalgae offers several advantages: (1) easy and quick growth under various conditions, (2) does not compete for arable land and water with edible crops, and (3) provides carbon neutral renewable energy by con-verting CO2 to useful products such as fatty acids,
alco-hols, and neutral lipids. Many algae generally produce substantial amounts of triacylglycerol of medium-chain fatty acids such as palmitic (C16:0) and stearic (C18:0) acids, sometimes up to 70% of its dry weight [5, 6].
One such microalgae that has received considerable attention in the past few decades as a biotechnologi-cal tool to produce drop-in jet fuel is Euglena gracilis, a photosynthetic unicellular flagellate eukaryote. Euglena,
being a mixotroph, feeds as an autotroph in the pres-ence of sunlight to produce sugars through photosynthe-sis, while survives as a heterotroph taking in dissolved organic compounds as nutrition under dark conditions. One of the main reasons for its attraction is because of its ability to produce wax esters, chiefly myristyl myristate (MM). MM is made up of myristic (C14:0) acid and myri-styl alcohol (C14:0), each of which can individually be utilized for jet fuel because of their low freezing point/ high cetane number compared to other medium-chain fatty acids [7]. Typically, Euglena cells accumulate storage polysaccharide called paramylon granules, a β-1,3-glucan under aerobic conditions. However, such stored para-mylon is broken down to glucose and further converted to wax esters when put under anaerobic conditions. Since the anaerobic cells gain subtle levels of ATP during the process, the phenomenon is called “wax ester fermenta-tion” [8].
Though Euglena cells have huge potential and can serve as tiny factories for biofuel production, inherent problem associated with large-scale culturing is the slow growth rate of algal strains with high oil content [8, 9]. It appears that the synthesis and storage of wax esters as
cytosolic lipid particles is Euglena’s defense mechanism to cope with stress [5]. Therefore, much effort has been put to genetically engineer or optimize culturing condi-tions of algae for enhanced biofuel production [8, 10–13]. To evaluate any constructed algal strain or the choice of culture conditions, polysaccharide/lipid profiles must be characterized. The conventional quantification methods employ labor intensive, time consuming, and destructive chemical extraction procedures followed by expensive mass spectrometric measurements, thereby limiting sci-entific progress.
Therefore, we set out to develop a Raman spectroscopy (RS)-based molecular imaging method to characterize various metabolites in Euglena in a simple and straight-forward manner. Raman spectrum, which is also called a molecular fingerprint, provides wealth of chemical infor-mation with high specificity. Combining RS with a micro-scope endows subcellular resolution. Moreover, it is a rapid, non-destructive, live cell compatible technique that requires no additional dye probes or extensive sample preparation for molecular imaging. Previously, metabolic heterogeneity of live Euglena was studied in real time by stimulated Raman scattering. However, only the heavily crowded C–H-stretching region could be analyzed [14]. Spontaneous RS has also proved to be useful in studying enhanced lipid production in yeasts [15]. In this work, we performed space- and time-resolved Raman imaging of single living Euglena cells under anaerobic conditions and analyzed fingerprint region rich in molecular and structural information to identify/visualize paramylon and products of wax ester fermentation.
We identified Raman spectral markers for β-1,3-glucan/esters and constructed their intracellular distri-bution images by simple univariate approach. To obtain carbon chain length-specific information of lipids and further probe any other unknown components, we employed multivariate curve resolution (MCR) analysis and succeeded in identifying MM (C28), a major product of wax ester fermentation which is an ideal raw material for a drop-in bio jet fuel.
Results and discussion
Raman microspectroscopy and imaging of single Euglena gracilis cells
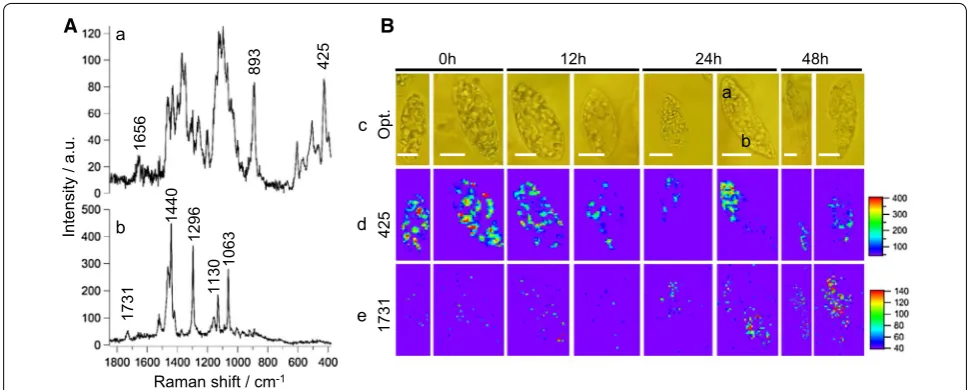
To understand wax ester fermentation in Euglena at the molecular level, we measured space- and time-resolved Raman spectra and images of single cells grown under anaerobic conditions (Fig. 1). As mentioned earlier,
stored polysaccharides in Euglena are converted to wax esters. Therefore, to identify and discuss Raman spectral markers during wax ester fermentation, two most rel-evant space-resolved Raman spectra from a Euglena cell
are presented in Fig. 1A.
Spectrum at point a (Fig. 1A-a) had COO− asymmetric stretching at 1656 cm−1, COO− symmetric stretch, and C–H deformation modes between 1500 and 1200 cm−1,
C–C and C–O stretch modes of pyranose rings between 1150 and 1050 cm−1, and C–C–C ring deformation mode
at 425 cm−1 indicating polysaccharide-rich region. In
addition, we observed a band at 893 cm−1, a region which
is sensitive to glycosidic linkages. In fact, Raman spectro-scopic studies on series of carbohydrate monomers have revealed C–H equatorial bending vibration of β-anomer between 905 and 885 cm−1 [16–18]. We can safely assume
that the observed polysaccharide spectrum may par-ticularly be rich in paramylon, a β-glucan (Scheme 1a). However, actual comparison with pure β-glucan is nec-essary. Major features in Raman spectrum measured at point b (Fig. 1A-b) include C=O stretch of ester linkage at 1731 cm−1, C–H-bending vibrations of the aliphatic
0h 12h 24h 48h
173
14
25
Opt.
a
b
1731
42
5 B
a
b A
Intensity / a.u.
Raman shift / cm-1
c
d
e
89
3
1063
129
6
1130
1656
1440
Fig. 1 Raman microspectroscopy and imaging of single Euglena gracilis cells under anaerobic condition. A Space-resolved Raman spectra measured at polysaccharide-rich region (a), and ester-rich region (b) from a cell at 24 h. B Optical images of single E. gracilis cells (c), time-resolved univariate Raman images of polysaccharides (d), and esters (e). Scale bar in each optical image measures 10 μm and measured points are indicated using alphabets
chain at 1440 cm−1, in-plane CH
2 twist at 1296 cm−1, and
C–C stretch between 1150 and 1050 cm−1. It is
impor-tant to note that the absence of any band in the C=C stretch region around 1650 cm−1 clearly indicates that
this strain only accumulates esters containing saturated hydrocarbon chains (Scheme 1b). It is then straightfor-ward to choose 425 cm−1 and 1731 cm−1 bands to be
markers of paramylon and wax esters, respectively.
To visualize dynamic intracellular distributions of these components, we performed time-resolved Raman imaging experiment of single Euglena cells at 0 h, 12 h, 24 h, and 48 h under anaerobic conditions. Two repre-sentative cells at each time are presented in Fig. 1B. It is apparent from univariate Raman images that cells at 0 h (pre-grown under aerobic conditions) have accumulated polysaccharides, while ester content is negligible. As the culture time progresses, stored polysaccharide content decreases slowly, while wax esters start accumulating, especially from 24 h. This is a clear indication of wax ester fermentation in Euglena.
Identification of carbon chain lengths in wax esters Though we were able to visualize the fatty acid biosyn-thetic machinery at work, there is no information on the
nature of wax esters produced. Because, the C=O stretch of ester linkage (1731 cm−1) used for molecular imaging
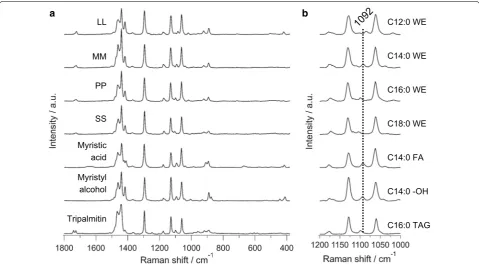
does not indicate carbon chain lengths in compounds containing > 12 carbons [19], which is quite important in the context of its application for biofuel production. Therefore, to characterize the chain length of wax esters in detail within single Euglena cells, we set out to identify Raman markers that are sensitive to carbon chains. To achieve this, we measured series of standard wax esters with different chain lengths together with myristic acid and myristyl alcohol, precursors of MM which is a prom-ising candidate for drop-in jet fuel (Fig. 2).
It is known that the position of C=O-stretching band in fatty acid methyl ester depends on the chain lengths. However, it is useful only for oils containing < 12 carbon atoms and the change in band position is minimal for fatty acids > 12 carbons [19]. Although the overall spectral pattern looked very similar (Fig. 2a), careful screening of C–C-stretching region revealed significant difference that can be attributed to chain lengths (Fig. 2b). Raman bands at 1130 cm−1 and 1063 cm−1 have been assigned to
in-phase and out-of-phase skeletal C–C-stretching vibra-tions, respectively, for all-trans chain conformation. The band in between these two is a superposition of all-trans
LL
Myristic acid
Myristyl alcohol
Tripalmitin MM
PP
SS
a b
C12:0 WE
C14:0 WE
C16:0 WE
C18:0 WE
C14:0 FA
C16:0 TAG C14:0 -OH
C–C stretch with a single gauche defect and C–C stretch-ing of gauche conformation which is indicative of gauche
isomer formation [20–23]. Its position has been found to be sensitive to carbon chain lengths and we observed a systematic shift to higher wavenumber with increasing carbon number (Table 1).
MM and both its precursors which contain C14:0 show Raman band close to 1092 cm−1 while others are shifted
in either direction. Even though we succeeded in identi-fying chain length-specific Raman spectral markers, we must keep in mind that the difference in band position is quite small and that the measured samples were all pure compounds in solid state. This indicator has been shown to fail if the lipids are in liquid state [19].
Extracting pure biomolecular information using MCR analysis
In the present context, Euglena cells contain heteroge-neous distributions of many different biomolecules with varying phases and Raman spectrum measured at any given point in the cell is a mixture of all components. For example, C–C-stretching region of Raman spectrum is quite crowded with overlapping contributions not only from lipids or esters but also from other intracellular bio-molecules such as protein, nucleic acids, polysaccharides, etc. Therefore, simple univariate approach is not suitable for such complex biological samples, especially to pre-dict chain lengths. In fact, if we take a closer look into the space-resolved spectrum from ester-rich region between 1150–1050 cm−1 (Fig. 1A-b), it is hard to find any C–C
gauche band. However, a broad and an intense band can be observed in the same region from polysaccharide-rich Raman spectrum (Fig. 1A-a) indicating the complexity involved. Therefore, we applied MCR analysis to extract pure biomolecular information and to visualize intracel-lular abundance of each component in a straightforward manner.
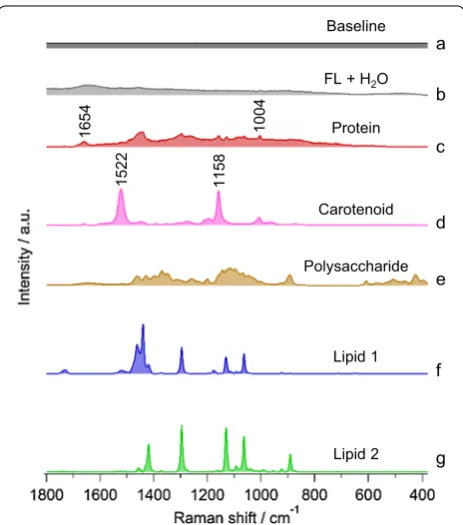
Results of seven components MCR model is given in Fig. 3 in which a straight baseline was intentionally included to eliminate varying offset. Other six compo-nents were automatically extracted. Let us look into the assignment of each in detail. Figure 3b includes O–H-bending vibration of water around ~ 1600 cm−1 and an
overall broad fluorescence background. Raman spectrum in Fig. 3c includes phenylalanine ring breathing mode at 1004 cm−1 and amide I band at 1660 cm−1,
indicat-ing proteins. Next component (Fig. 3d) contains intense bands at 1522 cm−1 and 1158 cm−1 which represent
stretching modes of C=C and C–C of polyene chain in carotenoids, respectively. It is important to note that protein and carotenoid spectra were obtained as a natu-ral consequence of MCR analysis without any a priori knowledge of their presence and, thus, could be very use-ful in exploratory analysis. Spectrum in Fig. 3e can be assigned to polysaccharide. Unexpectedly, we extracted two lipid components, named lipid 1 and 2, as shown in Fig. 3f, g, respectively.
Comparison of MCR‑extracted components with pure standards
To understand the origin of polysaccharide and lipids from MCR analysis more specifically, we compared them with series of pure chemical standards of wax esters
Table 1 Carbon chain length dependence of gauche
conformation sensitive C–C-stretching band in saturated chains
a Gaussian fitting was used to determine band positions and fitting errors are
included
Compound Chain length Band positiona (cm−1)
Lauryl laurate 12:0/12:0 1084.7 ± 0.9 Myristyl myristate 14:0/14:0 1092.2 ± 0.8 Palmityl palmitate 16:0/16:0 1099.1 ± 0.8 Stearyl stearate 18:0/18:0 1103.7 ± 0.9
Myristic acid 14:0 1092.6 ± 0.4
Myristyl alcohol 14:0 1094.1 ± 0.3
Tripalmitin 16:0/16:0/16:0 1098.6 ± 0.7
Baseline
FL + H2O
Protein
Carotenoid
Polysaccharide
Lipid 1
Lipid 2
1004
1522 1158
a
b
c
d
e
f
g
1654
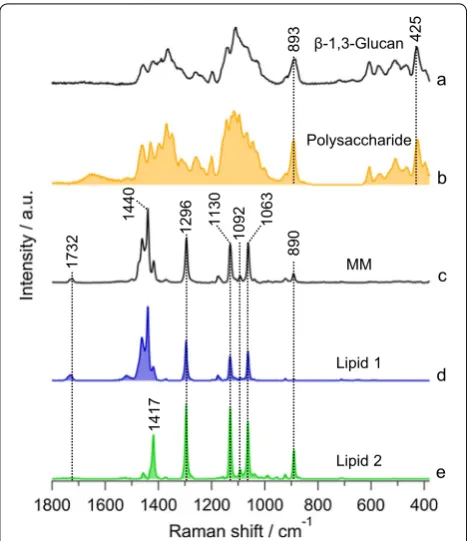
and their precursors. After screening, comparison with expected compounds such as β-1,3-glucan and MM is shown in Fig. 4. This is mainly because Euglena is known to store appreciable amounts of paramylon (a β-1,3-glucan) as energy reserves under aerobic conditions which are almost converted exclusively to wax esters containing saturated carbon chains. Gas chromato-graphic analysis showed esters with C28 to be the major component along with minor contributions from other even numbered esters in C24–C32 range [24]. Indeed, MCR-extracted polysaccharide component matches very well with β-1,3-glucan and can unambiguously be assigned to paramylon in Euglena. It is intriguing that two seemingly similar lipid components were extracted separately in MCR analysis (Fig. 4d, e). Lipid 1 with bands at 1732 cm−1, 1440 cm−1, 1296 cm−1, 1130 cm−1,
1092 cm−1, and 1063 cm−1 matches quite well with MM
and can be assigned to C28 ester containing two satu-rated C14 chains. A closer look into lipid 2 reveals the absence of 1732 cm−1 and C–H-bending vibrations at
1440 cm−1, while 1417 cm−1 and 890 cm−1 are more
pro-nounced. Absence of C=O stretch band of ester raises the question whether lipid 2 is really a lipid/ester. How-ever, the presence of 1092 cm−1 along with other
C–C-stretching vibrational bands indicates C14 carbon chain,
indirectly suggesting that it could either be myristic acid or myristyl alcohol. However, it does not correspond well with neither as expected, especially in C=O stretch and C–H deformation region, essentially leaving the spec-trum unassigned.
MCR analysis of Raman images of standard myristyl myristate
Since lipid 2 extracted from Euglena with 1092 cm−1
band does not match either with wax ester or their pre-cursors, we performed Raman imaging on pure MM solid film (obtained after drying 10 mg/ml MM in hexane) and carried out detailed MCR analysis (Fig. 5). A two-com-ponent MCR model constructed from data of pure MM showed surprising results. The two spectra were, indeed, identical to the two lipid components obtained from the MCR analysis of living Euglena cells, i.e., Fig. 5A-a (MCR_MM1) and Fig. 5A-c (lipid 1) were identical and both correspond well to averaged MM spectrum meas-ured earlier (Fig. 4c). Spectral profile of second compo-nent (MCR_MM2), in which bands at 1732 cm−1 and
1440 cm−1 were missing, was identical to ‘lipid 2’ from Euglena cells, indicating its origin to MM. Only plausi-ble explanation is the presence of crystal polymorphs (several crystalline structures with the same chemical composition).
It is known that long-chain esters/triglycerides exist in three major polymorphic forms, namely α, β′, and β. Their stability varies in the order β > β′ > α. While the subcell structure of α form is hexagonal with no ordered arrangement of chain planes (H), β′ is orthorhom-bic with every second chain being perpendicular to the rest (O⊥) and β is triclinic with all chain planes parallel (T//). In a Raman spectrum, C–H deformation modes
between 1500 and 1400 cm−1 are sensitive to crystal
structure. First set of spectra (MCR_MM1 and lipid 1) in which three defined bands at 1461 cm−1, 1440 cm−1,
and 1417 cm−1 were observed corresponding to β′
poly-morph. In fact, 1417 cm−1 band is associated with
split-ting of the Raman active methylene scissoring mode in β′
form [25–27]. In the second set, MCR_MM2 and lipid 2, intense bands at 1417 cm−1, 1296 cm−1, and 1130 cm−1
that are characteristics of all-trans conformation of car-bon chains in crystalline domains were observed [28]. In addition, 890 cm−1 band corresponding to terminal
C–C-stretching vibration was also prominent. However, it is interesting to note that C=O-stretching (1732 cm−1)
and C–H-bending (1440 cm−1) vibrations in both
spec-tra were absent. Since intensities of Raman bands depend on both crystal orientation and incident polarization, it is possible that these bands are weak in this particular sample due to crystal orientation. However, it may also be due to the presence of two polymorphs of MM in
β-1,3-Glucan
MM Polysaccharide
Lipid 1
Lipid 2
a
b
c
d
e
1732
1417
1296 1130 1063
1440
1092
42
5
89
3
89
0
Euglena cells. This may have serious implications as phys-ical properties like molecular packing and freezing point, which are crucial for MM’s efficient storage and eventual application as a bio jet fuel, will be different for different polymorphs. Polarized-Raman spectroscopic measure-ments should be performed to obtain further insights to make clear distinction between polymorphs.
We then constructed molecular distribution images of MCR-extracted components which revealed heteroge-neous pattern without much resemblance to each other (Fig. 5B). This result further confirms the presence of two different forms in the standard MM sample.
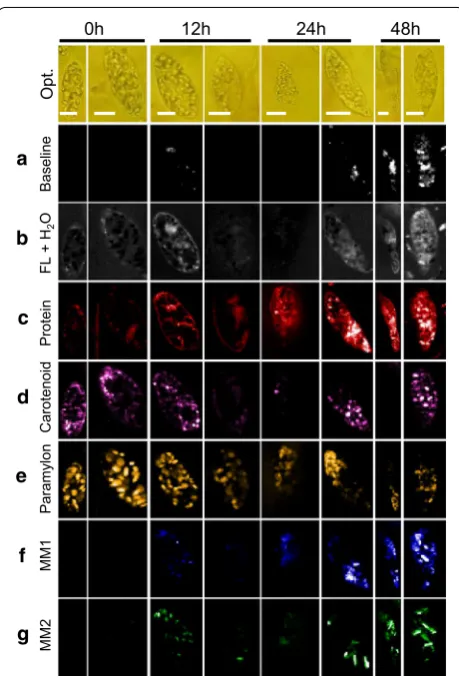
Time‑resolved MCR component images of Euglena cells Once the assignment of all MCR-extracted spec-tral components was accomplished, we constructed time-resolved Raman images to visualize intracellular
biomolecular distribution (Fig. 6). First, let us look into baseline (Fig. 6a). Although there is no difference at early culture times, significant increase in localized areas was observed in cells from 24 h. On the other hand, varying degrees of fluorescence background could be observed in cells at any given time (Fig. 6b). Protein synthesis seems to be active as its intracellular abundance increases and gets more or less evenly distributed throughout the cells as culture time progresses (Fig. 6c). However, irrespective of time, carotenoids were randomly distributed indicat-ing cellular individuality (Fig. 6d). Details on wax ester fermentation, which is our main target, can be visual-ized in Fig. 6e–g. Paramylon accumulated under aero-bic condition during pre-culture seems to decrease with time under anaerobic condition (Fig. 6e). Complementa-rily, abundance of myristyl myristate (MM1 and MM2), which were not present to begin with at 0 h, slowly starts increasing with passing culture time (Fig. 6f, g). Strong accumulation of wax esters in a localized fashion can be observed starting from 24 h. Interestingly, MM1 distri-bution (from MCR analysis) is similar to the abundance images obtained using univariate method (Fig. 1e). How-ever, it is also important to note that MCR analysis led to identification of MM2, whose intracellular distribution pattern is quite different from MM1, reiterating the exist-ence of two forms of myristyl myristate. Further clarifica-tion of these two forms is left for future studies.
Conclusions
In summary, we have demonstrated the unique ability of Raman microscopy coupled with MCR analysis to inves-tigate wax ester fermentation and obtain carbon chain length-specific information in single living Euglena cells. In the present study, conversion of aerobically accumu-lated paramylon to MM, a C28 wax ester (C14:0–C14:0), has been successfully visualized. Interestingly, two poly-morphic forms of MM with different distribution pat-terns may have been separated during MCR analysis for the first time in Euglena cells. Even though this work focused on specifically identifying MM, we believe that this method can be applied to characterize other metabolites in many different cell types, including but not limited to humans, animals, plants, etc. Moreover, this approach is directly applicable to mutant strains or under other culture conditions. Therefore, our approach is expected to further our understanding of lipid metabo-lism in Euglena and its regulatory apparatus at the cellu-lar level to realize microalgae as an economically viable biofuel feedstock. Moreover, it is clear from the present example that simple univariate analysis, though useful to some extent, is limited by overlapping contributions and that multivariate approach is absolutely necessary to study complex samples of biological origin.
MCR_MM1 MCR_MM2 Opt.
B
0 1700 0 500 MCR_MM1
MCR_MM2
Lipid1
Lipid2
1417
1732
A
a
b
c
d
1296 1130 1063 1092 890
1440
1461
Methods
Sample preparation
Euglena gracilis SM-ZK, a non-photosynthetic mutant was used in this study. First, Euglena was pre-cultured aero-bically in Koren–Hutner (KH) medium until stationary phase, diluted 20 times with fresh medium, and cultured aerobically for another 2 days. To perform anaerobic diges-tion, 1.5 ml of aerobically grown culture was taken in an eppendorf tube of the same volume and sealed with para-film. All steps were done on a rotary shaker (120 rpm) at 26 °C under dark conditions [12, 29, 30]. For Raman spec-troscopic measurements, since Euglena are flagellates, 20 µl of culture at each time (0 h, 12 h, 24 h, and 48 h) was put on a concanavalin-A coated glass bottom dish. Then, after standing for about 5 min, a few ml of lukewarm (~ 35 °C) 2% agarose solution was added to further restrict their motion. The glass bottom dish containing Euglena cells was then transferred to the microscope as it is for Raman imag-ing experiment and two cells were measured at each time.
All chemical standards were bought either from Sigma-Aldrich or Wako, Japan, and measured using glass bottom dish.
Raman spectroscopy
Raman spectra were measured using a homemade confo-cal Raman microspectrometer equipped with a He–Ne Laser (632.8 nm) [16]. The laser beam was introduced into an inverted microscope (Olympus, IX70) and tightly focused onto the sample on the microscope stage using oil immersion objective lens (100×, NA = 1.3). Backscattered light including the inelastically scattered photons was col-lected by the same objective lens and passed through an edge filter to remove elastic scattering light. In the Raman path, a 50 μm pinhole was set up to achieve confocality before light entered polychromator (Chromex, 250IS). A liquid nitrogen cooled CCD detector operating at − 120 °C (Princeton Instruments, Spec-10) was used to record Raman spectra. The entrance slit width of the polychroma-tor was set to 50 μm and measurements were done using a 600 g/mm grating, resulting in spectral resolution of ~ 4.5 cm−1. Lateral and axial resolutions were 300 nm and
3 μm, respectively.
For imaging experiments, a step size of 0.6 μm in X- and
Y-direction was used with the help of a piezo stage (Physik Instrumente). Each euglena cell, being relatively large, took about ~ 40 min to scan the whole cell with an exposure of just 1 s/spectrum. Laser power of 4 mW at the sample point was used for all measurements. An exposure time of 30 s and 60 s was used for measuring several points of lipids and β-1,3-glucan standards, respectively, and aver-aged. CCD detector and piezo stage were controlled using the LabVIEW software (National Instruments). All meas-urements were done at room temperature (22 °C).
Data analysis
Data pre-processing such as dark subtraction, intensity correction (using white light spectrum), and spectral de-noising by singular value decomposition (SVD) analy-sis were all carried out in IGOR Pro (Wavemetrics). All standard spectra were an average of several points and the fluorescence background was removed by assuming a poly-nomial baseline.
Raman imaging data from Euglena were analyzed by MCR performed on homemade program written in Python which was used previously [16, 31]. In MCR analysis, matrix approximation sought by a linear combination of desired number of spectral components can be written as follows:
In this low-rank approximation, A is original mapping data of dimension m×n (m denotes number of points (1) A=WH.
0h 12h 24h 48h
Opt.
Baseline
FL +
H2
O
Protein
Carotenoid
Paramy
lo
n
MM
1
MM
2
a
b
c
d
e
f
g
per spectrum and n denotes the total number of spec-tra). W (m×k matrix) represents spectral components and rows of H (k×n matrix) represent intensity profile of each spectral component. The parameter k, the number of components, can be flexibly decided by referring SVD analysis or a priori estimation. W and H were iteratively refined using alternating least squares, so that the Frobe-nius norm ||A−WH||2 is minimized with non-negative
constraints W≥ 0 and H≥ 0. A seven-component model (k= 7; initialized with six random components and one fixed straight baseline) was constructed. To obtain sparser solutions, L1 penalty term (lasso regression) of
α2= 0.008 was applied as follows:
where E is a k×k matrix whose elements are all unity. In addition, L2 penalty term (ridge regression) of β2= 0.008
was also applied as follows:
where I is a k×k identity matrix.
Abbreviations
MM: myristyl myristate; RS: Raman spectroscopy; MCR: multivariate curve resolution; SVD: singular value decomposition.
Acknowledgements Not applicable.
Authors’ contributions
TY and TI designed the study and revised manuscript. YT and TI supported in cell culture. KI and AK conducted Raman measurements. KI analyzed the data and wrote the manuscript. HN supervised Raman spectroscopic measure-ments, data analysis and wrote manuscript. All authors read and approved the final manuscript.
Funding
This work was supported, in part, by the Grant-in-Aid for Scientific Research of JSPS (15H04763), strategic study of Shimane University for TY and also by the Core Research of Evolutional Science and Technology (CREST) from the Japan Science and Technology Agency (JST) for TI.
Availability of data and materials
The authors declare that data supporting the findings in this study are avail-able within the article and raw data can be obtained from corresponding author on reasonable request.
Ethics approval and consent to participate Not applicable.
Consent for publication Not applicable.
Competing interests
The authors declare that they have no competing interests.
Author details
1 The United Graduate School of Agricultural Sciences, Tottori University, Tottori 680-8550, Japan. 2 Faculty of Life and Environmental Science, Shimane University, Matsue 690-8504, Japan. 3 Core Research for Evolutional Science
(2)
WTW+α2EH=WTA,
(3)
HHT+β2I
W =HAT,
and Technology (CREST), Japan Science and Technology Agency (JST), Kawaguchi 332-0012, Japan. 4 Raman Project Center for Medical and Biological Applications, Shimane University, Matsue 690-8504, Japan.
Received: 27 February 2019 Accepted: 16 May 2019
References
1. BP statistical review of world energy—2015. BP p.l.c., June 2016; 2016. 2. Global energy & CO2 status report—2017. International Energy Agency,
March 2018; 2018.
3. Council NR. Hidden costs of energy: unpriced consequences of energy production and use. Washington, DC: The National Academies Press; 2010.
4. Allred BW, Smith WK, Twidwell D, Haggerty JH, Running SW, Naugle DE, et al. Sustainability: ecosystem services lost to oil and gas in North America. Science. 2015;348(6233):401–2.
5. Hu Q, Sommerfeld M, Jarvis E, Ghirardi M, Posewitz M, Seibert M, et al. Microalgal triacylglycerols as feedstocks for biofuel production: perspec-tives and advances. Plant J. 2008;54(4):621–39.
6. Malcata FX. Microalgae and biofuels: a promising partnership? Trends Biotechnol. 2011;29(11):542–9.
7. Klopfenstein WE. Effect of molecular weights of fatty acid esters on cetane numbers as diesel fuels. J Am Oil Chem Soc. 1985;62(6):1029–31. 8. Inui H, Ishikawa T, Tamoi M. Wax ester fermentation and its application for
biofuel production. Adv Exp Med Biol. 2017;979:269–83.
9. Alam F, Date A, Rasjidin R, Mobin S, Moria H, Baqui A. Biofuel from algae— is it a viable alternative? Procedia Eng. 2012;49:221–7.
10. Ogawa T, Tamoi M, Kimura A, Mine A, Sakuyama H, Yoshida E, et al. Enhancement of photosynthetic capacity in Euglena gracilis by expres-sion of cyanobacterial fructose-1,6-/sedoheptulose-1,7-bisphosphatase leads to increases in biomass and wax ester production. Biotechnol Biofuels. 2015;8:80.
11. Radakovits R, Jinkerson RE, Darzins A, Posewitz MC. Genetic engi-neering of algae for enhanced biofuel production. Eukaryot Cell. 2010;9(4):486–501.
12. Tomiyama T, Kurihara K, Ogawa T, Maruta T, Ogawa T, Ohta D, et al. Wax ester synthase/diacylglycerol acyltransferase isoenzymes play a pivotal role in wax ester biosynthesis in Euglena gracilis. Sci Rep. 2017;7(1):13504. 13. Wang Y, Seppanen-Laakso T, Rischer H, Wiebe MG. Euglena gracilis growth
and cell composition under different temperature, light and trophic conditions. PLoS ONE. 2018;13(4):e0195329.
14. Wakisaka Y, Suzuki Y, Iwata O, Nakashima A, Ito T, Hirose M, et al. Probing the metabolic heterogeneity of live Euglena gracilis with stimulated Raman scattering microscopy. Nat Microbiol. 2016;1(10):16124. 15. Kamila K, Huadong P, Bayden RW, Victoria SH. Single cell assessment of
yeast metabolic engineering for enhanced lipid production using Raman and AFM-IR imaging. Biotechnol Biofuels. 2018;11(1):106.
16. Noothalapati H, Sasaki T, Kaino T, Kawamukai M, Ando M, Hamaguchi HO, et al. Label-free chemical imaging of fungal spore walls by Raman micros-copy and multivariate curve resolution analysis. Sci Rep. 2016;6:27789. 17. Corbett EC, Zichy V, Goral J, Passingham C. Fourier transform Raman
studies of materials and compounds of biological importance—II. The effect of moisture on the molecular structure of the alpha and beta anomers of d-glucose. Spectrochimica Acta A Mol Spectrosc.
1991;47(9–10):1399–411.
18. Cael JJ, Koenig JL, Blackwell J. Infrared and raman spectroscopy of carbohydrates : part IV. Identification of configuration- and conformation-sensitive modes for d-glucose by normal coordinate analysis. Carbohydr
Res. 1974;32(1):79–91.
19. Beattie JR, Steven EJB, Bruce WM. A critical evaluation of Raman spectroscopy for the analysis of lipids: fatty acid methyl esters. Lipids. 2004;39(5):407–19.
•fast, convenient online submission
•
thorough peer review by experienced researchers in your field
• rapid publication on acceptance
• support for research data, including large and complex data types
•
gold Open Access which fosters wider collaboration and increased citations maximum visibility for your research: over 100M website views per year
•
At BMC, research is always in progress.
Learn more biomedcentral.com/submissions
Ready to submit your research? Choose BMC and benefit from:
21. Spiker RC Jr, Levin IW. Raman spectra and vibrational assignments for dipalmitoyl phosphatidylcholine and structurally related molecules. Biochim Biophys Acta. 1975;388(3):361–73.
22. Snyder R, Schachtschneider J. Vibrational analysis of the n-paraffins—I: assignments of infrared bands in the spectra of C3H8 through n-C19H40. Spectrochim Acta. 1963;19(1):85–116.
23. Noothalapati H, Iwasaki K, Yoshimoto C, Yoshikiyo K, Nishikawa T, Ando M, et al. Imaging phospholipid conformational disorder and packing in giant multilamellar liposome by confocal Raman microspectroscopy. Spectrochim Acta A Mol Biomol Spectrosc. 2017;187:186–90.
24. Koritala S. Microbiological synthesis of wax esters by Euglena gracilis. J Am Oil Chem Soc. 1989;66(1):133–4.
25. Da Silva E, Bresson S, Rousseau D. Characterization of the three major polymorphic forms and liquid state of tristearin by Raman spectroscopy. Chem Phys Lipids. 2009;157(2):113–9.
26. Motoyama M, Ando M, Sasaki K, Nakajima I, Chikuni K, Aikawa K, et al. Simultaneous imaging of fat crystallinity and crystal polymorphic types by Raman microspectroscopy. Food Chem. 2016;196:411–7.
27. Michiyo M, Masahiro A, Keisuke S, Hiro OH. Differentiation of animal fats from different origins: use of polymorphic features detected by Raman spectroscopy. Appl Spectrosc. 2010;64(11):1244–50.
28. Samuel AZ, Lai BH, Lan ST, Ando M, Wang CL, Hamaguchi HO. Estimat-ing percent crystallinity of polyethylene as a function of temperature by Raman spectroscopy multivariate curve resolution by alternating least squares. Anal Chem. 2017;89(5):3043–50.
29. Tomiyama T, Goto K, Tanaka Y, Maruta T, Ogawa T, Sawa Y, et al. A major isoform of mitochondrial trans-2-enoyl-CoA reductase is dispensable for wax ester production in Euglena gracilis under anaerobic conditions. PLoS ONE. 2019;14(1):e0210755.
30. Mitsuhiro K, Takahiro I. Suppression of DYRK ortholog expression affects wax ester fermentation in Euglena gracilis. J Appl Phycol. 2018;30(1):367–73.
31. Noothalapati H, Iwasaki K, Yamamoto T. Biological and medical applica-tions of multivariate curve resolution assisted Raman spectroscopy. Anal Sci. 2017;33(1):15–22.
Publisher’s Note