DATA AGGREGATION WITH SECURITY FOR
COLLUSION ATTACK IN WIRELESS SENSOR
NETWORK
*R.Ramalakshmi, **S.Subash Prabhu, ***Dr.C.Balasubramanian
*PG scholar, Dept.of CS, **Asst.Prof Dept Of CSE, ***Prof. and head of CSE P.S.R.R college of Engg, Sivakasi,India
ABSTRACT
The sensor network is used to observe surrounding area gathered and spread the information to other sink. The advantage of this network is used to improve life time and energy. The first sensor node or group of sensor nodes in the network runs out of energy. The aggregator node can send aggregate value to the base station. The sensor node can be used to assign initial weights for each node. This sensor node calculates weight for each node. Which sensor node weight should be lowest amount they can act as a cluster head. The joint node can send false data to the aggregator node and then these node controls to adversary. The dependability at any given instant represents an comprehensive behavior of participate to be various types of defects and misconduct. The adversary can send information to aggregator node then complexity will be occurred. These nodes are used to reduce the energy and band width.
Keywords— Sensor network; Collusion attacks; Compromised node.
I.INTRODUCTION
quality one and energy efficient. The fraction of time to send information to sink node. They can be used to check information will be send correct source or not.
II. RELATED WORKS
The secure data aggregation [1] focus an sensor node are deployed in the hostile environment the sensor node are divide into the cluster .The cluster can send information to base station.
The each sensor is based on the distance of readings of such a sensor from estimate of correct value. The each sensor node can assign initial weight. The weight will be compared of each node which node will be lower weight that node act as a cluster head. The remaining node can send information to aggregator node. The cluster head send information to base station. The sensor node are deployed in the hostile environment the sensor node are divide into the cluster .The cluster can send information to base station. The collusion attack occurred. The greedy perimeters stateless routing protocol is used location identify. The attacker high level knowledge about the data aggregation algorithm and it’s parameter. They can conduct IF algorithm
Data Aggregation
The S.Ozdemir presents “Secure data aggregation in wireless sensor networks” the data aggregation is the process of summarizing combining sensor data [5]. In order to reduce the amount of data transmission in the network. They can be used to improve energy and bandwidth. It is used to tree based data aggregation protocol and cluster based data aggregation protocol. The tree based data aggregator protocol is used to construct energy efficient tree. The tree based data aggregator protocol is used to construct energy efficient tree. The cluster based data aggregation protocol is used to GIT, SPT.The GIT is the greedy incremental tree compared to other data centric routing scheme. The SPT is used parent selection of sensor node. The compromised node detection will
IF Algorithm
Iterative Refinement
The P.Laureti, presents iterative filtering vs. iterative refinement algorithm is used to checking malfunction or misbehaves [10]. The cheating behavior will be increased the reputation is so much damaged by her misbehavior node. The entire network performance will be decreased.
Robust Ranking Algorithm
The correlation based ranking algorithm is used to two kinds of rating [8]. The random rating spamming techniques is used to sensor node are deployed in the random manner. The push rating spamming is used to maximum or minimum allowable of rating items. The push rating spamming is used to maximum or minimum allowable of rating items. The positive correlation and negative correlation is used to it.
The positive correlation is the degree in the value of one variable will be predicted in the same direction in the second variable. The data will be changed in the same direction. The negative correlation is used to degree in the value of one variable will be changed in the opposite directions. In this paper trust and reputation system is used to credential based trust management .They can be used to identification of node the will be access in a restriction.
III. SYSTEM DESCRIPTION
The secure data aggregation techniques used to tree topology. The tree topologies are used to type of network topology that includes three specific levels in a topology hierarchy.
A) Tree Topology.
B) Weight Factor Assigned to Each Source. C) Cluster Formation.
D) Secure Data Aggregation.
E) Collusion Attack With False Data.
A) Tree Topology
Figure 1: System Architecture.
B) Weight Factor Assign To Each Source
In this module the weight factor is assigned to each source in the network. The individual id specifies the node location by allocate weight factor to each node. Each node is specific by their locality by transfer weight factor. The allocate of weight factor is based on the liveliness need in any form of network.
C) Cluster Formation
The cluster head formation is the process of first step, indiscriminately select c cluster head with their xi, yi coordinates. Then calculate the distance between each sensor node and the arbitrarily selected cluster head and also get the energy of each node.
In the next step, re-compute the cluster head by using cancroids method. The sensor nodes which have the minimum distance from the cancroids point is a new cluster head.
D) Secure Data Aggregation
The hierarchical secure data aggregation is used to join the data from different source, transmit it with the elimination of the duplication and thereby reducing the number of transmissions and also saves energy. The inbuilt duplications in the raw data gathered from various sensors can be banned by the in-network data aggregation.
E) Collusion Attack With False Data
adversaries compromises two sensor nodes, and change the readings of these values such that the simple average of all sensor readings is slanted towards a lower value. In scenario 3, is used to computes the slanted value of the uncomplicated average of all sensor readings and information the third compromised sensor to report such slanted average as its readings.
IV. IMPLEMENTATION
In this module the weight factor is assigned to each source in the network. The individual id specifies the node location by allocating weight factor to each node. Each node is specifies by their location by assign weight factor. The distribution of weight factor is based on the liveliness need in any form of network. In this module the number of nodes connected into the network can also be identified.
The secure data aggregation techniques can be used to weighted average techniques. In first module used to the five coefficient values are set as follows: p1=0.5, p2=0.1, p3=0.05, p4=0.05 and p5=0.3.Where the summing up of the weights is equal to 1. For this example, of the proposed algorithm proceeds.
Step1
The neighbors of every sensor node v are search and its degree dv is obtained.
Step2
The degree difference of every node v is computed formula
∆𝑣 = 𝑑𝑣 − 𝑀 1 .
Step3
The sum of the distances Dv between an SN and all its neighbors is 𝑑𝑣 = 𝑥2 − 𝑥1 2+ 𝑦2 − 𝑦1 2 2 .
Step4
The mobility speed Mv of every sensor node v is calculated. For example, assume in the past 2 time blocks. 𝑀𝑣 =1
𝑇 𝑥𝑡− 𝑥𝑡−1
2+ 𝑦
𝑡− 𝑦𝑡−1 2 𝑇
𝑡=1
(3). Step 5
The Tv is a cumulative time for a node v to act as an application node is obtained.
Step 6
𝐶𝑣 = 𝑐 ∗𝑟1
𝐸1 4 .
Step 7
The combined weight of each sensor node v is calculated by the formula.
𝑊𝑣 = 𝑝1∆𝑣 + 𝑝2𝐷𝑣 + 𝑝3𝑀𝑣 + 𝑝4𝑇𝑣 + 𝑝5𝑐𝑣 (5).
STEP 8
The node with a minimum Wv is chosen as the cluster head.
STEP 9
Steps 1 to 8 are repeated for processing the remaining nodes until each node is assigned to a cluster.
The cluster head selection process can be used centroid method. The cluster head selection can be used to two phases. The one is set up phase and second is steady state phase.The cluster set up phase is each level divide into the cluster for each level k each node can decide the cluster head for the present surrounding by choosing a nodes randomly.
The node which has the higher energy level will be consider as cluster head (CH). The one cluster is formed and TDMA schedule is fixed for all nodes in cluster by cluster head and data broadcast.
The cluster set up phase algorithm is n is no of sensor node to the base station (BS). 1. For each level k, message transmitted by BS.
2. If (Nodes does not assigned the earlier level and received new message or BS transmit level k=1).
3. Assign level k. 4. End if.
5. End for.
6. BS broadcast hello message, which contains the in sequence of higher limit and minor limit of each level.
7. Each node estimate the distance from the BS based on received signal strength.
The cluster steady state phase algorithm is used to no of sensor node. 1. for each (node N)
2. if node N has uppermost energy level 3. N become CH.
6. N becomes a NCH node.
7. N informs the selects CH and become a member of its cluster. 8. End if.
9. for each (CH).
10. CH generate TDMA schedule for each cluster member. 11. Each cluster associate communicates to the CH in its time 12. End for
The hierarchal protected data aggregation is the process of combine the data from different sources, redirects it with the removal of the duplication and thereby reducing the number of transmissions and also saves energy. The inbuilt duplication in the raw data gathered from various sensors can be excluded by the in-network data aggregation.
The collusion attack scenario is used to IF algorithm.
Input: X, n, m;
Output: The reputation vector r; L 0;
W (0) 1; repeat;
Compute r (L+1); Compute d; Compute w (L+1); L L+1;
Compute d;
Where, X - Value of sensor node, n – No of sensor nodes, m – No of intervals, L - No of iterations, r - Reputation vector, w- Weight age assigned to each sensor node.
V. PERFORMANCE ANALYSIS
The following metrics are employed for the performance analysis.
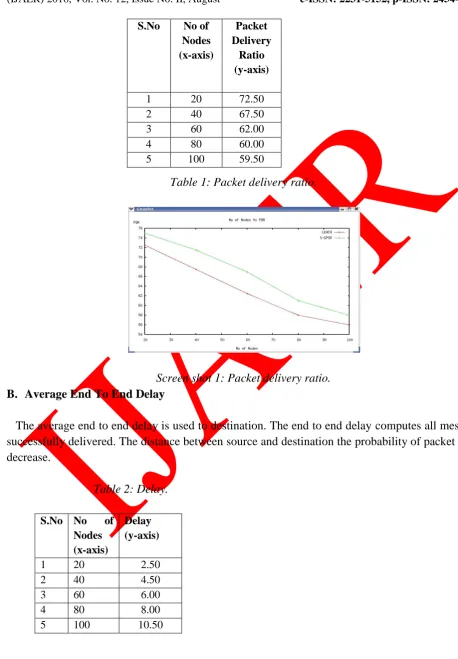
A. Packet delivery ratio
Table 1: Packet delivery ratio.
Screen shot 1: Packet delivery ratio.
B. Average End To End Delay
The average end to end delay is used to destination. The end to end delay computes all message successfully delivered. The distance between source and destination the probability of packet drop decrease.
Table 2: Delay.
S.No No of Nodes (x-axis)
Delay (y-axis)
1 20 2.50
2 40 4.50
3 60 6.00
4 80 8.00
5 100 10.50
S.No No of Nodes (x-axis)
Packet Delivery
Ratio (y-axis)
1 20 72.50
2 40 67.50
3 60 62.00
4 80 60.00
Screen Shot 2: Delay.
Average end to end delay = ⅀ (arrive time-send time) /⅀ (no of connections).
C. Throughput Analysis
The average throughput is used to receive packet size divided by stop time and start time.
Average throughput = (received size) / (stop time – start time) *(8 /1000). Where, received size = store received packets, stop time = simulation stop time, start time = simulation start time.
Table 3: residual Energy
S.No No of Nodes (x-axis)
Residual Energy (y-axis)
1 20 1.78
2 40 1.62
3 60 1.53
4 80 1.45
Screenshot 3: Residual Energy.
VI. SIMULATION RESULT
The simulations results show that first of all form a cluster. There\are four clusters are formed. The every node senses the sensor field and initializes the location of sensor nodes. All sensor nodes get the communications. The dependency on their nearest position connected to each other. This process done in all cluster is shown below,
Screenshot 4: Number of Sensor Node.
Screenshot 5: Sensor Node Connected to Each other.
In next step every sensor node are connected to the cluster head. All data are send to the cluster head.
ScreenShot 6: Sends Data to Cluster Head.
The cluster head can send information to base station. The figure shows below,
VII. CONCLUSION
To provide secure authentication for various message transmission in the network. The proposed work is for enhancing the life time of wireless sensor network using IF algorithm. The IF algorithm is used to improve network life time. They can be used to reduce the energy and the system will be energy efficient. WSN are of two types. One is static sensor node and another one is mobile sensor node. In this paper, static node is implemented in WSN and energy is saved, delay is minimized. Same algorithm (GPSR) is used for mobile WSN to save energy, increase packet delivery ratio and to minimize delay.
REFERENCES
[1] H.S. Lim, E.Bertino and M.Kantarcioglu, “A game theoretic approach for high assurance of data trustworthiness in sensor networks,” in pro.IEEE 28th
Int. conf Data Eng., Apr 2012.
[2] Y. Yu “Trust mechanisms in wireless sensor networks: Attack analysis and countermeasures,”J. Netw. Compute. Appl.vol. 35, 2012
[3] L. Shi, K. M. Hou, H. ying Zhou, and X. Liu, “Energy efficient and fault tolerant multicore wireless sensor network: EMWSN,”In Proc. 7th Int.Conf. Wireless Commun, Netw. Mobile Compute, 2011, pp. 1–4.
[4] C. de Kerchove and P. Van Dooren, “Iterative filtering in reputation systems,” SIAM J. Matrix Anal. Appl., vol. 31, no. 4, pp. 1812, 1834, Mar, 2010.
[5] S.Ozdemir and Y. Xiao, “Secure data aggregation in wireless sensor networks: A comprehensive overview,”Comput. Netw.vol. 53, no. 12, pp. 2022–2037, Aug. 2009.
[6] A. Jøsang and J. Golbeck, “Challenges for robust trust and reputa-tion systems,” in Proc. 5th Int. Workshop Security Trust Manage., Saint Malo, France, 2009, pp. 253–262.
[7] R.Roman, C. Fernandez- Gago, J. Lopez,“Trust and reputation systems for wireless sensor networks,” in Security and Privacy in Mobile and Wireless Networking, S.Gritzalis, T. Karygiannis, U.K: Troubador Publishing Ltd, 2009 pp. 105–128.
[8] K. Hoffman,“A survey of attack and defense techniques for reputation systems,” ACM Compute. Surveys, vol. 42, no. 1, pp. 1:1–1:31, Dec. 2009.
[9] E.Ayday, H. Lee, and F.Fekri, “An iterative algorithm for trust and reputation management,”Proc. IEEE Int. Conf.Symp. Inf. Theory, vol. 3, 2009, pp. 2051–2055.