in the population sciences published by the Max Planck Institute for Demographic Research Konrad-Zuse Str. 1, D-18057 Rostock · GERMANY www.demographic-research.org
DEMOGRAPHIC RESEARCH
VOLUME 11, ARTICLE 15, PAGES 421-454
PUBLISHED 23 DECEMBER 2004
www.demographic-research.org/Volumes/Vol11/15/
DOI: 10.4054/DemRes.2004.11.15
Descriptive Findings
Childbearing patterns for Swedish
mothers of twins, 1961-1999
Jan M. Hoem
Margit Strandberg
1 Introduction 422
2 Twins in the literature; historical trends in Sweden 423
3 Our data and method of analysis 425
4 Twinning at first birth 426
5 Mothers of a pair of twins and mothers of one singleton 428
6 Mothers of a pair of twins and mothers of two singletons 429
7 The third birth to mothers of twins 429
8 Conclusions 430
9 Acknowledgements 430
Notes 431
References 434
Descriptive Findings
Childbearing patterns for Swedish mothers of twins, 1961-1999
Jan M. Hoem 1
Margit Strandberg 2
Abstract
The Nordic population registers provide a unique possibility to study the demographic behavior of very small population groups and rare events. In this paper, we study the childbearing behavior of Swedish mothers of twins between 1961 and 1999, inclusive. -Our most consistent finding is that mothers of twins wait noticeably longer than women with singletons before they have another child. This apart, mothers with twins at their first birth have next-birth fertility patterns very similar to women who have two singletons at their first two births. This commonality in childbearing behavior does not extend to higher-order births. For mothers with a singleton and a pair of twins, the progression to a third birth depends very much on whether the twins came first or second.
Beside these main results our fascinating material also provides a number of descriptive findings. The Swedish twinning rate has increased since the mid-1970s in response to a growing use of fertility-stimulating treatments such as in-vitro fertilization, in parallel with similar developments in many other countries. Such medical procedures are applied mainly to women beyond prime childbearing ages. Nevertheless, we find no simple age pattern in twinning rates. Even in recent years they do not just increase with the woman’s age. By way of contrast, at parities beyond 3, twinning rates increase with parity when we control for calendar period, time since last previous birth, and (NB) the woman’s own age.
________________________
1
Max Planck Institute for Demographic Research, Konrad-Zuse-Straße 1, D-18057 Rostock, Germany, [email protected]
2
1. Introduction
While the literature is rich in studies of the behavior of twins, or of features like their mortality, very little seems to be known about the demographic behavior of the parents of twins. Realizing that the sheer work involved in raising a young pair of twins must be much harder than raising one or two singletons, careful demographers have long suspected that parents of twins have patterns of childbearing and family dynamics that differ from others, and they therefore censor life histories at the arrival of twins. The present paper shows that this is sensible practice, at least for Swedish women between the 1960s and 1990s. Since only about one per cent of births resulted in twins, the loss of information must be negligible in normal investigations of childbearing behavior.
Since twinning is a relatively rare event, special types of data sets are needed for studies of the detailed patterns of behavior of parents of twins, preferably extensive databases like the Nordic population registers (Note 1). The advantage of the complete coverage that they give is that they allow us to map patterns of the demographic behavior even of very small groups and very rare events. In parallel with Walke’s investigation of divorce risks for Swedish parents of twins (Walke, 2002) based on the same data, we tap this exciting data source for information about the childbearing behavior of Swedish mothers of twins in the last forty years of the twentieth century. Most of our report contains a comparison between mothers of twins and mothers of one or two singletons.
Our main new findings, and our corresponding interpretations, are as follows: (1) The second-birth fertility of women whose first birth resulted in twins is much lower than for corresponding mothers with a singleton first birth but it remained roughly at the same level as the third-birth fertility of mothers of two singletons. What counts is the number of children born, not the number of births needed to attain it.
(2) The most important difference between the two groups of women is that mothers of twins wait noticeably longer before they have another child than women with a second singleton do. As we noted, raising twins is much more burdensome than raising one or two singletons, and this is reflected in the waiting time.
(3) Trends in the fertility of mothers of twins largely follow those for mothers of singletons. Similarly rates of twin first births largely follow those for singleton first births. Since twins surely mostly come as a surprise, conception rates of twin and singleton births should move in unison, and any difference in birth rates would be produced by differential fetal loss and selective abortion.One feature interferes in this parallelism, namely an independent upward trend in twinning rates caused by medical interference to help women who have difficulty conceiving.
second birth, mothers who had the twins first have much the higher fertility. Presumably this partly reflects the effect of the age of the twins, in that proceeding to a third birth becomes easier as the twins become older. A further partial explanation may be that women in these two groups have different mixes of stopping rules (Note 2). As we noted above, surely no one actively plans to have twins, so women who first had a singleton and then were surprised by a twin birth presumably have a greater fraction planning to stop after two children, and if not then to stop after three. Women who had the twins first and then a singleton have already proceeded to parity 3 and probably have a greater (albeit small) fraction willing to continue up to a fourth child (Note 3).
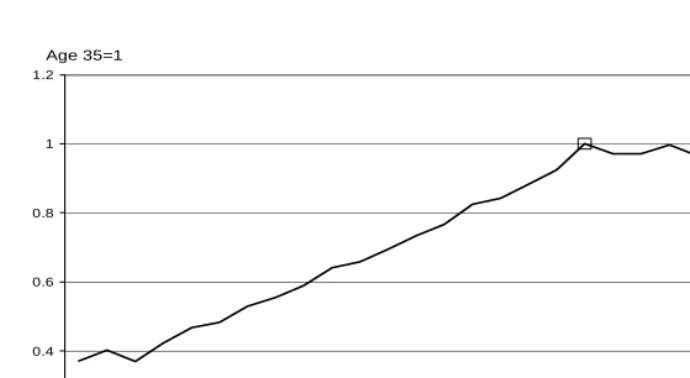
(5) Our main concern is the fertility of mothers of twins, but we cannot resist also reporting briefly on a couple of other features that have already appeared in the literature. First, many previous authors convey a strong impression that twinning rates increase with the woman’s age. This feature is only partly confirmed by our data. We find that the twinning rate does increase up to ages in the thirties but that it actually falls at higher ages. We cannot find any simple relation between twinning and age (Note 4).
Second, a corresponding notion that the twinning probability increases with a woman’s
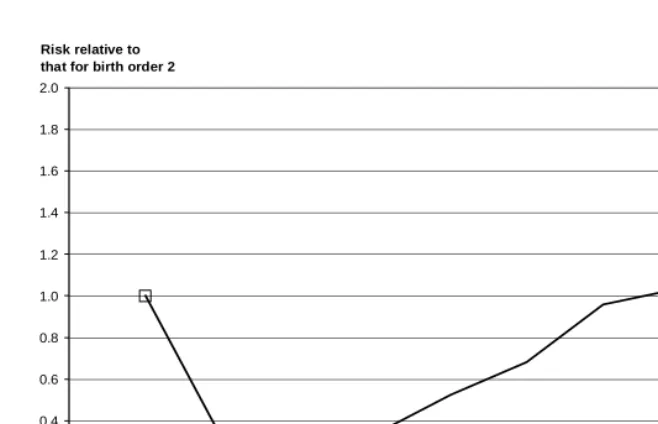
parity turns out to be present in our population for parities above 3, but not for lower parities. Both of these patterns appear when we control for the converse covariate. Such simple descriptive facts should be taken into account in future theorizing about the effect of age and parity on twinning rates.
Our main business is to document the statements in items (1) through (4) above. To put these findings into perspective, however, we first provide a brief account of trends in twin births in Sweden.
2. Twins in the literature; historical trends in Sweden
The previous literature on twins has two main parts. In by far the greater part, the authors explore the behavior of twins, or their morbidity or mortality (Note 5), often thinking in terms of twins as natural experiments. Some typical examples of the latter are Rosenzweig and Wolpin (1980), Grogger and Bronars (1993), Bronars and Grogger (1994), and Behrman et al. (1994) (Note 6).
of the twins themselves. Because we can add to the previous literature with very little effort, however, we also include presently some information on twinning rates by current parity and later a section on twinning rates at first birth (Section 4 below). In each case we control for the other covariates.
The fraction of births that were twin births was very stable at 14 per 1000 total births each year for more than fifty years after 1870 (Figure 1). It then declined gradually to about 8 per 1000 in the 1970s, whereafter it rapidly rose to almost twice that level by the end of the twentieth century, surely mainly as a consequence of medical fertility-stimulating measures used to help childless women. Murphy et al. (1997, 1998) found the same valley-form in data for Great Britain and displayed a chronological coincidence of medical sub-fertility treatment and the rise in birth multiplicity since the 1970s. Tas (1994) and Steegers-Theunissen et al. (1998) have reported similar findings for the Netherlands. A good number of further sets of national twinning rates, many with similar patterns, were given by Eriksson et al. (1995) and by Oleszczuk et al. (1999). The latest contribution with such a pattern known to us is that of Terzera (2002).
The increase in Swedish twinning rates through the 1980s and 1990s was also reflected in the number of children born. In the 1970s, some 1800 twins were born in Sweden each year; two decades later, there were about 3000 (Note 8). By comparison, the number of triplet births was as low as some ten per year during the 1960s and 1970s. In the 1980s, it increased to about thirty per year and reached a record high of sixty in 1993. By the end of the 1990s, the number of triplet births had declined again to around twenty. During the late 1980s and early 1990s, Sweden had an occasional quadruplet birth.
between twinning and age. Nevertheless, a changing age structure at childbearing may easily contribute to the drop recorded between the 1930s and ca. 1970 in Figure 1.
Some authors have also reported a positive association with the woman’s parity (Pollard, 1969; for a discussion see Högberg and Wall, 1992). We find this to be true at parities above 3 (Figure 4) (note 11) and note that a reduction of fertility at higher parities may therefore be another part of the explanation of the drop in Swedish twinning rates up to about 1970, since fertility declined at higher parities during this time. The common view seems to be, however, that a changing composition of the set of childbearing women by age and parity is insufficient to explain completely the reduction in the twinning rate (Note 12). Our own experiments (not displayed here, but see Figure 4 in Strandberg and Hoem, 2002) also show that the Swedish twinning rate increased considerably in the last quarter of the twentieth century even when we control for the changing age distribution among mothers. Evidently, new features have entered into the picture. The standard explanation in the literature is that in-vitro fertilization is a main factor in this development (Note 13). Such treatment is normally administered to women of a relatively high age and only after they have undergone long periods of tests (Note 14).This practice alone would contribute to a relatively high age at twin birth.
3. Our data and method of analysis
We have the advantage over most other students of twinning that we have individual-level data from a large population at our disposal. Our data come from the Swedish population register and cover every Swedish woman recorded in the years 1961 through 1999. The data contain her own birthdate and the dates of each of her births. Each woman’s record is censored at her death or first emigration and at the end of 1999. Our source data include liveborn children only. This means that a stillbirth is not recorded and that a twin birth is counted as a singleton birth if only one child was liveborn.
We analyze our data mostly by means of a multivariate generalization of classical standardization methods. For each birth order we use a competing-risks intensity model (Note 15) of the form
µ
kx( )h=
θ
c a
kh xh, where in calendar period k µkx( )h is the “risk” ofhaving a birth of multiplicity h for a woman currently in age group x (Note 16). Because of the scarcity of births of multiplicity 3 or higher, we operate with h = 1 or 2 and censor a record at any birth of multiplicity above 2. To achieve identification, we let
01
k
c
=1 for a suitablek
0 and01
x
The birth multiplicity h appears in this model in interaction with each of the covariates x and k at the same time. Our reasoning is based on this model. Because it has been much more practical for us and easier to report, we have often fitted models with a simpler interaction structure, as noted in each case below. We pay some attention to strengths and weaknesses of this method of analysis in Section 4 below.
All tables in this paper contain maximum-likelihood estimates of model parameters computed from our data. Figures 1 through 3 are based on population statistics in annual publications from Statistics Sweden. Figure 4 is the result of our own calculations based on the Swedish population register, as are all subsequent diagrams.
In a data set as large as ours, most differences shown turn out to be statistically significant at all normal significance levels, even when they have little substantive content, and normal tests lose their meaning (Note 17). In line with the general policy of this journal, we therefore do not report anything about statistical significance in this paper.
4. Twinning at first birth
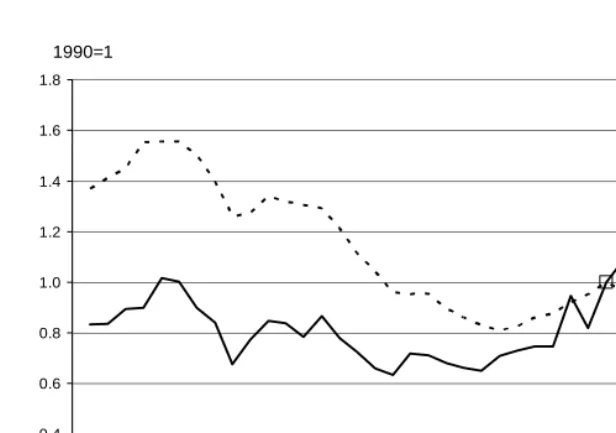
Since 1961, Swedish fertility has gone through what Hoem and Hoem (1996) have called a roller-coaster development. It can be depicted in various ways; in Figure 5 we show it in the form of a series of age-standardized annual intensities (hazards) for singleton first births and a corresponding series for twin first births, using the level in 1990 as a baseline for each curve separately. We see that the two series run largely parallel until the early 1980s, after which the series for twin births has its own upward impetus. This is what we would expect, given that a twin birth most often would come as a surprise, except possibly after medical intervention. (In-vitro fertilizations are used most often for childless women.) If we turn to relative risks, we find that the twin-birth “risk” of a childless Swedish woman was some 0.6 to 0.7 per cent of the corresponding singleton-birth intensity during the first two decades after 1961, but the relation then changed and the relative risk increased to almost 2 per cent by the end of the 1990s (Note 18). Figure 6 shows to what extent the age profile of twin first births is shifted towards somewhat higher ages (Note19).
Figures 5 and 6 are based on Table 1, the two main panels of which contains maximum-likelihood estimates of the parameters of two simplified versions of the intensity model
µ
kx( )h=
θ
c a
kh xh described above. The two columns of the first paneland the two columns of the second panel contain estimates
a
ˆ
xhof the relative risksxh
a
in the modelµ
kx( )h=
θ
c a
k xh (again for h=1,2). This means that we have operated with one “interaction” with the birth multiplicity at a time. For our purpose, this is a sufficiently accurate approximation (Note 20).To better see the trend across periods in the twinning risk, we have plotted the sequence
{
c
ˆ
kh/
c
ˆ
1990,h}
against k in Figure 5, separately for h=1 and h=2. In Figure 6we have plotted the sequence
{
a
ˆ
xh/
a
ˆ
28,h}
against x, again separately for singleton andtwin first births, to better see the age pattern in the twinning risk.
In order to estimate the general fertility level in our data we have fitted the model
( )h
kx
m c a
h k xµ
=
θ
withm
1=
1
and findθ
ˆ
to be 5.3 per 10 000 person-months ofexposure, standardized for multiplicity, period, and age group. The corresponding relative risk of having twins in a first birth, standardized for period and age, is
2
ˆ
m
=0.0093. This figure is given above the first main panel in Table 1 (to the accuracy of four decimals). A similar descriptive estimate is given above the first main panel in all subsequent tables where relevant.5. Mothers of a pair of twins and mothers of one singleton
We now turn to our main topic, namely the fertility of mothers of twins. In our analysis we estimate simultaneously two competing risks again, this time (i) the intensity of having a singleton second birth and (ii) the corresponding intensity for a twin second birth. As in Section 4, we use a standard multiplicative intensity model for each risk, now of the format
µ
ijkt( )h=
θ
a b c d
ij jh kj tj. The index h is used for the multiplicity of thesecond birth. Our covariates are (1) the woman’s age group at first birth, indexed by i, (2) the multiplicity of the first birth, now indexed by j, and (3) the current calendar period (regarded as a time-varying covariate), indexed by k and grouped as in Table 3, which contains our maximum-likelihood estimates of our parameters, except that
estimates
b
ˆ
jhof the relative risksb
jh are given in Table 2 (Note 23). Our duration variable t is time since first birth, grouped as also shown in Table 3 (last main panel). The analysis applies to women born in Sweden with a first birth of multiplicity 1 or 2. (We have left out the few women who had first births of multiplicity above 2.) To ensure parameter identification, we have setb
11=1, precisely one of thea
ij is also set to 1, and so on. This means that the parameters represent relative risks.We estimate the rate of arrival of a second birth for mothers who first had twins to be 0.342 relative to the rate for mothers who first had a singleton birth, standardizing for age at first birth, for calendar period, and for first-birth multiplicity. This means that on average, mothers who delivered twins at their first birth have only about one-third as high an intensity for a second birth as mothers whose first confinement resulted in a
single child. We have also found that
b
ˆ
21=0.338 (Table 2). This is our estimate for the relative risk of having a singleton at the second birth when the mother had twins in her first delivery.In addition, we estimate
b
ˆ
12=0.010 andb
ˆ
22/
b
ˆ
21=0.022 (Note 24). The latter figure means that if these women have a second birth, mothers whose first delivery resulted in twins have about twice as high a chance of giving birth to twins again as women whose first delivery resulted in a singleton (Note 25). This may constitute further evidence of a genetic component in birth twinning.The first panel in Table 3 contains our estimates
{ }
c
ˆ
kj . It displays the trends in our1988-1990 for each first-birth outcome separately in Figure 8. We see that the intensities for a second birth largely have followed the same trends, irrespective of the outcome of the first birth. The most obvious deviations are the much stronger decline in second-birth intensities for mothers of twins between 1965 and 1975, and again after the early 1990s. Meanwhile, the characteristics of twin mothers as a group have changed. In the later period, a greater fraction of them consists of women who have had difficulties getting pregnant and who have had their twins after medical intervention.
In the second panel of Table 3 we display the effect of the age of the mother at first birth, and the final panel in Table 3 as well as Figure 9 shows the extent to which the second-birth intensity for mothers of twins and singletons depends on the duration since their first confinement. We see that mothers of twins have much the lower next-birth intensity and that in general they wait longer before they have another birth. None of this is surprising. Given the strong two-child norm in Sweden, many of the mothers of first-birth twins must have reached their family-size goal, so on average mothers of twins should have a lower propensity to proceed to a second birth than mothers of a first-birth singleton. The progression should also be slower, again given the greater strain of raising twins than a singleton child.
6. Mothers of a pair of twins and mothers of two singletons
Perhaps a more equitable comparison is that of the next-birth intensity of a mother of twins and a comparable mother of two singletons. Both have two children, so we will now compare birth intensities for the third child, taking into account the manner in which parity 2 was attained. Parameter estimates of intensity models similar to those in our previous section are given in Table 4. Let us start by noting that the two groups we now study largely have the same next-birth fertility, and that the trends of each group across calendar time are very close to each other (Figure 10). Once more, twin mothers tend to wait longer before they venture into their next birth than mothers of two singletons do (Figure 11). This apart, the two groups have remarkably similar fertility.
7. The third birth to mothers of twins
two groups must be quite differently composed according to lifetime childbearing plans, as we discussed under item (4) in our introduction and do not repeat here. Second, if the twins came at the first birth, they are older and the situation is therefore more manageable at each stage after the second birth than when the twins came in the second delivery. This shows up in Figure 12, which shows that fertility differences between the two groups diminish as the child’s age increases (Note 28). Surely, the age of the twins is the driving element in this decrease in the relative birth “risks”.
The age of the mother does not seem to have much systematic impact on the third-birth intensities, but the difference between them was smaller in the 1960s than thereafter (Note 29). Since more women were housewives in our first period than in the later ones, we speculate that having a third birth was more manageable than later on even when one of the previous births had resulted in twins.
8. Conclusions
The main contribution of this paper is a mapping of patterns of childbearing behavior by mothers of twins. Our results reflect the obvious expectation that childbearing behavior is dominated by the number of children a woman has had or plans to have, not by the number of confinements used to produce those children. We also show that parents of twins wait longer than comparable parents of singletons do before they proceed to any subsequent birth, presumably because of the greater strain of raising twins. Both of these features correspond to simple common sense and to what demographers have long suspected, but as far as we know they are documented here for the first time. As a by-product we show that twinning rates in Sweden have developed over time in parallel with the introduction and use of medical interventions like in-vitro fertilization, just like in many other populations. Furthermore we show that there is a simple but non-monotonic association between age and twinning when one controls for parity, and also a non-monotonic association between parity and twinning when one controls for the mother’s age. We believe that we have provided a sharper description of the latter patterns than what is available in the previous literature.
9. Acknowledgements
Notes
1. Madrigal (1995) has used a much smaller data set (n=149) to study the ultimate fertility of mothers of twins and mothers of singletons.
2. We owe this interpretation to an anonymous reviewer.
3. Since people’s preferences must be for a number of children and not for a number of births, the early supermortality of twins could disturb this picture (since in our analysis we do not change a mother’s recorded parity at the death of a child), but we believe that it only plays a limited role for our results.
4. Corresponding non-monotonicities have been reported by Fellman and Eriksson (1993) and Eriksson et al. (1995).
5. See, for instance, Andreasson and Brandt (1997) and Baird et al. (1998).
6. Extensive activities in this line at the Max Planck Institute for Demographic Research in recent years have resulted in output by Yashin et al. (1998, 1999a, 1999b), Iachine et al. (1998, 1999a, 1999b), Christensen et al. (2000, 2001, 2003), Tomassini et al. (2001), Rogers et al. (2001), Kohler et al. (1999, 2000, 2001, 2002), and Wienke at al. (2001, 2002).
7. Murphy et al. (1997, 1998) and others use data specified by age of mother and mono- or polyzygoticity of children but do not include parity in their analysis. Some authors, like James (1995), also include the woman’s marital status.
8. Note that these numbers indicate the sample size for our study of the childbearing behavior of mothers of twins.
9. Note that the twinning rate is the fraction of twins among the births. This is something else than the various twin-birth intensities that we present in what follows. A twin-birth intensity is the rate at which women have twin confinements; the twinning rate is the conditional probability that the confinement results in twins, given that there is a confinement.
10. They found a similar pattern by age in triplet rates as well.
not include an explanation here. See Strandberg and Hoem (2002) for more detailed results.
12. See, e.g., Eriksson et al. (1995).
13. See, e.g., Murphy et al. (1997).
14. See, e.g., Lundin (1996). The first children born in Sweden after in-vitro fertilization were delivered in 1982 (Socialstyrelsen, 1998).
15. See Hoem (1987) for a general theory of such simple multiplicative intensity models.
16. We mostly use three-year calendar periods and three-year age groups, as displayed in our tables.
17. In the current setting, the likelihood-ratio test is the natural statistic to use.
18. In the first panel of Table 1, divide the item in the second column by the corresponding item in the first column to get these figures.
19. Note how Figure 6 picks up an aspect of twinning different from that of Figure 3. The difference is that between twin-birth intensities and twinning rates, described in Note 9.
20. We have used a corresponding procedure for all parameter estimates in our subsequent tables and diagrams.
21. We have deleted some in-between age groups so as not to clutter up the diagram needlessly. The curves for the deleted age groups truly lie between the curves we have included.
22. Corresponding trends in age-specific twinning rates appear in Figure 3 in Strandberg and Hoem (2002).
23. Note that the first subscript in
b
jhrepresents the multiplicity of the first birth andthe second subscript the multiplicity of the second birth.
24. The latter value is based on a computation using more decimals than those shown in Table 2.
26. In our data, no woman who had two twin births ever had a third birth, so there is no need to study third births in this group.
27. Our estimate of the relative risk is 1.982, i.e., the former group had about twice as high an intensity as the latter. See just above the first main panel in Table 5.
28. To get the ordinates of the curves in Figure 12 proceed as follows: Locate the two columns of estimates in the third main panel in Table 5. Divide each item in the second column by the corresponding item in the first column. This gives the ordinates on the upper curve in Figure 12. Use the ordinate 1 for all points on the lower curve.
References
Andreasson, Sven and Lena Brandt (1997). Mortality and morbidity related to alcohol.
Alcohol and alcoholism 32 (2), 173-178.
Baird, Janis, Clive Osmond, Ian Bowes, David I. W. Philips (1998). Mortality from birth to adult life: a longitudinal study of twins. Early Human Development
53 (1): 73-79.
Behrman, Jere R., Mark R. Rosenzweig, and Paul Taubman (1994). Endowments and the allocation of schooling in the family and in the marriage market: the twins experiment. Journal of Political Economy 102 (6): 1131-1173.
Bronars, Stephen G. and Jeff Grogger (1994). The economic consequences of unwed motherhood: using twins as a natural experiment. American Economic Review
85 (5): 1141-1156.
Christensen, K.; M. McGue, A. I. Yashin, I. A. Iachine, N. V. Holm, and J. W. Vaupel (2000). Genetic and environmental influences on functional abilities in Danish twins aged 75 years and older. Journal of Gerontology: Medical Sciences
55A (8): M446-M452.
Christensen, K., A. Wienke, A. Skytthe, N. V. Holm, J. W. Vaupel, and A. I. Yashin (2001). Cardiovascular mortality in twins and the fetal origins hypothesis. Twin
Research 4 (3): 344-349.
Christensen, K., H.-P. Kohler, O. Basso, J. Olsen, J. W. Vaupel, and J. L. Rodgers (2003).The correlation of fecundability among twins: evidence of a genetic effect on fertility? Epidemiology 14:1, 60-64.
Eriksson, Aldur W., and Johan Fellman, (1967a). Twinning and legitimacy. Hereditas
57: 395-402
Eriksson, Aldur W., and Johan Fellman, (1967b). Twinning in relation to marital status of the mother. Acta Genetica et Statistica Medica 17: 385-398.
Eriksson, Aldur W., and Johan Fellman (1973). Differences in the twinning trends between Finns and Swedes. The American Journal of Human Genetics 25 (2): 141–151.
Eriksson, A. W., C. Abbot, P. Kostense, J. O. Fellman (1995). Secular changes of twinning rates in Nordic populations (1995). Acta geneticae medicae et
Fellman, Johan O. and Aldur W. Eriksson (1993). Biometric analysis of the multiple maternities in Finland, 1881-1990, and in Sweden since 1751. Human Biology
65 (3): 463-479.
Grogger, Jeff and Stephen Bronars (1993). The socioeconomic consequences of teenage childbearing: findings from a natural experiment. Family Planning Perspectives
25 (4): 156-161 and 174.
Hoem, Britta and Jan M. Hoem (1996). Sweden's family policies and roller-coaster fertility. Journal of Population Problems (Tokyo) 52 (3-4): 1-22.
Hoem, Jan M. (1987). Statistical analysis of a multiplicative model and its application to the standardization of vital rates: A review. International Statistical Review
55: 119-152.
Högberg, Ulf, and Stig Wall (1992). Secular trends of twinning rates in Sweden.
Journal of Biosocial Science 24 (4).
Iachine, I. A., N. V. Holm, J. R. Harris, A. Z. Begun, M. K. Iachina, M. Latinen, J. Kaprio, and A. I. Yashin (1998). How heritable is individual susceptibility to death? The results of an analysis of survival data on Danish, Swedish and Finnish twins. Twin Research 1 (4): 196-205.
Iachine, I. A., K. Christensen, and A. I. Yashin (1999a). Incorporating genetic marker information into the analysis of twin survival data: a simulation study. Odense: Odense University Press.
Iachine, I. A. and A. I. Yashin (1999b). Bivariate quadratic hazard model: results of analysis of the Danish twins survival data. Odense: Odense University Press.
James, William H. (1995). Are "natural" twinning rates continuing to decline? Human
Reproduction 10 (11): 3042-3044.
Kohler, H.-P. J. L. Rodgers, and K. Christensen (1999). Is fertility behavior in our genes: findings from a Danish twin study. Population and Development Review
25 (2): 253-288.
Kohler, H.-P. and K. Christensen (2000). Genetic influences on fertility behavior: findings from a Danish twin study. In: Rodgers, J. C., D. C. Rowe, and W. B. Miller (eds.): Genetic influences on fertility and sexuality. Dordrecht: Kluwer Academic Press: 67-84.
Kohler, H.-P. and J. L. Rodgers (2001). DF-analyses of heritability with double-entry twin data: asymptotic standard errors and efficient estimation. Behavior Genetics
Kohler, H.-P., K. Christensen, A. Skytthe, and L. B. Knudsen (2002). The fertility pattern of twins and the general population compared: Evidence from Danish cohorts 1945-64. Demographic Research 6, Article 14.
Lundin, Susanne (1996). Makten över kroppen. In Lundin, Susanne, Lynn Åkesson (red.), Kroppens tid, identitet och samhälle. Natur och Kultur.
Madrigal, L. (1995). Differential fertility of mothers of twins and mothers of singletons: study in Limon, Costa Rica. Human Biology 67 (5): 779-787.
Murphy, M.; K. Hey; J. Brown; B. Willis; J. D. Ellis; D. Barlow (1997, 1998). Infertility treatment and multiple birth rates in Britain, 1938-94. Journal of
Biosocial Science 29: 235-243, and 30: 128-131.
Oleszczuk, Jaroslaw J.; Donald M. Keith; Louis G. Keith (1999). Projections of population-based twinning rates through the year 2100. Journal of Reproductive
Medicine 44 (11): 913-921.
Pollard, G.N. (1969). Multiple births in Australia, 1944–63. Journal of Biosocial
Science 1: 389–404.
Rodgers, J.C., H.-P. Kohler, K. O. Kyvik, and K. Christensen (2001). Behavior genetic modeling of human fertility: findings from a contemporary Danish twin study.
Demography 38 (1): 29-42.
Rosenzweig, Mark R. and Kenneth I. Wolpin (1980). Testing the Quantity-Quality fertility model: the use of twins as a natural experiment. Econometrica 48:
227-240.
Socialstyrelsen (1998). Förlossningar och barn födda efter provrörsbefruktningar 1982—1995. Stockholm: The (Swedish) National Board of Health and Welfare;
SoS-rapport 1998:7.
Statistiska centralbyrån (SCB). Folkmängdens förändringar 1965. Stockholm: Statistics Sweden.
Statistiska centralbyrån (SCB). Annual publications of population statistics. Stockholm: Statistics Sweden.
Strandberg, Margit and Jan M. Hoem (2002). Patterns of twinning for Swedish women, 1961-1999. MPIDR Working Paper. Download from http://www.demogr.mpg.de/papers/working/wp-2002-031.pdf.
Tas, R. F. J. (1994). Multiple births in the Netherlands, 1900-1993. [Meerlingen in Nederland, 1900-1993.] Maandstatistiek van de Bevolking 42 (2): 20-21.
Terzera, Laura (2002). The evolution of multiple births in Italy. Genus 58 (1): 159-181.
Tomassini, C., F. C. Billari, A. Rosina, and K. Christensen (2001). Born together—die together. Live together—die together. The role of the partner and of the co-twin on longevity at very old ages. Genus 57 (3-4): 63-82.
Walke, Rainer (2002). Twins or two single children: The influence of the multiplicity of the first birth on the divorce risk of Swedish women. Demographic Research 7, Article 9.
Wienke, A., N. V. Holm, A. Skytthe, A., and A. I. Yashin (2001). The heritability of mortality due to heart disease: a correlated frailty model applied to Danish twins.
Twin Research 4 (4): 266-274.
Wienke, A., K. Christensen, A. Skytthe, A. I. Yashin (2002). Genetic analysis of cause of death in a mixture model of bivariate lifetime data. Statistical Modelling 2 (2): 89-102.
Yashin, A.I., I. A. Iachine, and A. Z. Begun (1998). New models for survival studies of twins. Behavior Genetics 28 (6): 486.
Yashin, A.I., I. A. Iachine, and A. Z. Begun (1999a). Genetics of human susceptibility to death and longevity: findings from twin studies. Zeitschrift für Gerontologie
und Geriatrie 32:Supplement 2, II/129.
Yashin, A.I. , I. A. Iachine, and J. R. Harris (1999b). Half of variation in susceptibility to mortality is genetic: findings from Swedish twin survival data. Behavior
Tables and figures
Table 1: Singleton birth or twin birth in the first confinement; relative risks for childless Swedish women
Singleton 1
Twin birth 0.0093a
Periodb Singleton Twin birth Agec Singleton Twin birth
1961-63 1.461 0.0095 15-18 0.071 0.0004 1964-66 1.613 0.0109 19-21 0.376 0.0021 1967-69 1.440 0.0090 22-24 0.664 0.0047 1970-72 1.364 0.0092 25-27 0.964 0.0087 1973-75 1.323 0.0091 28-30 1.000 0.0116 1976-78 1.080 0.0075 31-33 0.752 0.0124 1979-81 0.972 0.0079 34-36 0.445 0.0094 1982-84 0.868 0.0076 37-39 0.223 0.0053 1985-87 0.891 0.0083 40-42 0.085 0.0016 1988-90 1.000 0.0103 43-45 0.019 0.0003 1991-93 0.950 0.0129 46- 0.001 0.0000 1994-96 0.778 0.0128
1997-99 0.674 0.0128
a) Standardized for calendar period and mother's current age. b) Standardized for mother's age.
c) Standardized for calendar period.
Table 2: Singleton birth or twin birth in the second confinement; relative risks for Swedish women according to the multiplicity of their first birth
Second confinement
First confinement Singleton Twin birth
Singleton 1 0.0102
Twin birth 0.3382 0.0074
Table 3: Second confinement; relative risks for Swedish mothers according to the multiplicity of their first birth
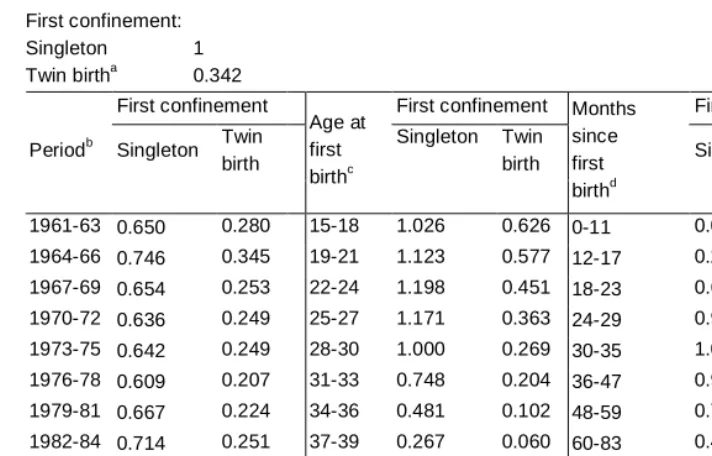
First confinement: Singleton 1 Twin birtha 0.342
First confinement First confinement First confinement
Periodb Singleton Twin birth
Singleton Twin
birth Singleton Twin birth Age at
first birthc
Months since first birthd
1961-63 0.650 0.280 15-18 1.026 0.626 0-11 0.006 0.005 1964-66 0.746 0.345 19-21 1.123 0.577 12-17 0.249 0.127 1967-69 0.654 0.253 22-24 1.198 0.451 18-23 0.652 0.187 1970-72 0.636 0.249 25-27 1.171 0.363 24-29 0.929 0.227 1973-75 0.642 0.249 28-30 1.000 0.269 30-35 1.000 0.240 1976-78 0.609 0.207 31-33 0.748 0.204 36-47 0.965 0.247 1979-81 0.667 0.224 34-36 0.481 0.102 48-59 0.725 0.267 1982-84 0.714 0.251 37-39 0.267 0.060 60-83 0.438 0.207 1985-87 0.842 0.307 40-42 0.115 0.049 84-107 0.234 0.128 1988-90 1.000 0.331 43-45 0.035 108-120 0.131 0.071 1991-93 1.003 0.338 46- 0.007
1994-96 0.876 0.246 1997-99 0.803 0.196
a) Standardized for calendar period, mother's age at first birth, and time since first birth. b) Standardized for mother's and first child's age.
Table 4: Third child; relative risks for Swedish mothers according to whether they had their first two children as one pair of twins or as two singletons
First two confinements: Two singletons 1 One twin birtha 1.010 First two
confinements
First two confinements
First two confinements
Periodb Two singletons
One twin birth
Age at first birthc Two
singletons One twin birth Years since previous birthde Two singletons One twin birth 1961-63 0.880 0.724 15-18 3.322 2.502 0 0.015 0.019 1964-66 0.939 0.885 19-21 2.561 2.286 1 0.524 0.483 1967-69 0.687 0.630 22-24 1.864 1.831 1.5 0.936 0.712 1970-72 0.583 0.610 25-27 1.365 1.492 2 1.031 0.869 1973-75 0.551 0.623 28-30 1.000 1.123 2.5 1.000 0.923 1976-78 0.468 0.531 31-33 0.714 0.870 3 0.967 0.958 1979-81 0.585 0.581 34-36 0.485 0.445 4 0.938 1.037 1982-84 0.664 0.675 37-39 0.309 0.272 5-6 0.698 0.806 1985-87 0.843 0.862 40-42 0.150 0.216 7-8 0.412 0.496 1988-90 1.000 0.970 43-45 0.043 0 9-10 0.230 0.276 1991-93 0.995 1.021 46+ 0.027 0
1994-96 0.719 0.771 1997-99 0.588 0.631
Table 5: Fourth child; relative risks for mothers of one set of twins and one singleton
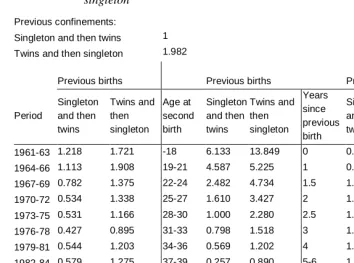
Previous confinements: Singleton and then twins 1 Twins and then singleton 1.982
Previous births Previous births Previous births
Period Singleton and then twins Twins and then singleton Age at second birth Singleton and then twins Twins and then singleton Years since previous birth Singleton and then twins Twins and then singleton
1961-63 1.218 1.721 -18 6.133 13.849 0 0.031 0.073 1964-66 1.113 1.908 19-21 4.587 5.225 1 0.876 1.887 1967-69 0.782 1.375 22-24 2.482 4.734 1.5 1.137 3.370 1970-72 0.534 1.338 25-27 1.610 3.427 2 1.453 3.125 1973-75 0.531 1.166 28-30 1.000 2.280 2.5 1.000 2.313 1976-78 0.427 0.895 31-33 0.798 1.518 3 1.042 2.778 1979-81 0.544 1.203 34-36 0.569 1.202 4 1.203 2.196 1982-84 0.579 1.275 37-39 0.257 0.890 5-6 1.076 1.724 1985-87 0.840 1.490 40-42 0.073 0.771 7-8 0.783 1.045 1988-90 1 2.060 43-45 0 1.303 9-10 0.446 0.759 1991-93 0.916 2.172
1994-96 0.697 1.291 1997-99 0.531 1.085
0 2 4 6 8 10 12 14 16 18
1870 1880 1890 1900 1910 1920 1930 1940 1950 1960 1970 1980 1990 2000
Twin births per 1000 births
Figure 1: Swedish twinning rates, 1871-1998
Note. The fraction of twin births is computed as the number of twin births (counting live and still births) divided by the total number of births in each year.
Sources:
25 26 27 28 29 30 31 32
1965 1970 1975 1980 1985 1990 1995 2000
Age
Singleton births
Twin births
0 0.2 0.4 0.6 0.8 1 1.2
17 18 19 20 21 22 23 24 25 26 27 28 29 30 31 32 33 34 35 36 37 38 39 40 41 42 43 44 45
Age Age 35=1
Figure 3: Index of the twinning rate by age Note. Standardized for calendar year, 1961-98
0.0 0.2 0.4 0.6 0.8 1.0 1.2 1.4 1.6 1.8 2.0
1 2 3 4 5 6 7 8 9 10 11
Birth order Risk relative to
that for birth order 2
Figure 4: Risk of a first twin birth, by order of birth
0.0 0.2 0.4 0.6 0.8 1.0 1.2 1.4 1.6 1.8
1960 1965 1970 1975 1980 1985 1990 1995 2000
1990=1
Twin birth Singleton
Figure 5: First birth; annual index for singleton and twin births, separately Note. Standardized for age.
0 0.2 0.4 0.6 0.8 1 1.2 1.4
15 18 21 24 27 30 33 36 39 42 45
Age Age 28=1
Singelton Twin birth
Figure 6: First birth; age profile of intensities of singleton and twin birth, separately
Note. Standardized for calendar period.
0 1 2 3 4 5 6
1962 1965 1968 1971 1974 1977 1980 1983 1986 1989 1992 1995 1998
1982-84 = 1
19-21 22-24 25-27 28-30 31-33 34-36 37-39 40-42
0 0.2 0.4 0.6 0.8 1 1.2
1962 1965 1968 1971 1974 1977 1980 1983 1986 1989 1992 1995 1998 1991-93 = 1
Singleton first birth Twin first birth
Figure 8: Second birth; annual index for mothers with a singleton or a twin first birth, separately
0 0.2 0.4 0.6 0.8 1 1.2
0 1 1.5 2 2.5 3 4 5-6 7-8 9-10 Age of first child (years) Singleton aged 2,5 years=1
Singleton first birth
Twin first birth
Figure 9: Second birth; duration profiles for mothers with a singleton or a twin first birth, separately
0 0.2 0.4 0.6 0.8 1 1.2
61-63 64-66 67-69 70-72 73-75 76-78 79-81 82-84 85-87 88-90 91-93 94-96 97-99 years
Relative to 1988-90, two singletons
Two singletons first One twin birth
Figure 10: Third child; annual index for mothers with one twin birth vs. with two
singletons
0 0.2 0.4 0.6 0.8 1 1.2
0 1 1.5 2 2.5 3 4 5-6 7-6 9-10
Age of youngest child (years)
R is k re la tiv e to th a t o f m o th e rs w ith tw o s in g le to n s w h er e t he y oun ges t i s o f a ge 2. 5 y ear s
Two singleton births One twin birth
Figure 11: Third child; duration profile for mothers with one set of twins and for
mothers with two singletons
0.0 0.5 1.0 1.5 2.0 2.5 3.0 3.5
0 1 1,5 2 2,5 3 4 5 7-8 9-10
Age of youngest child (years) 2+1 relative to 1+2,
each age
1+2 2+1
Figure 12: Fourth child; relative risks for mothers with a singleton and then twins
(1+2) vs. mothers with twins and then a singleton (2+1) Note. Standardized for calendar period and for the woman's age at second confinement.