DEMOGRAPHIC RESEARCH
VOLUME 31, ARTICLE 16, PAGES 459−496
PUBLISHED 22 AUGUST 2014
http://www.demographic-research.org/Volumes/Vol31/16/ DOI: 10.4054/DemRes.2014.31.16
Research Article
Attrition in the Austrian Generations and
Gender Survey:
Is there a bias by fertility-relevant aspects?
Isabella Buber-Ennser
©2014 Isabella Buber-Ennser.
This open-access work is published under the terms of the Creative Commons Attribution NonCommercial License 2.0 Germany, which permits use, reproduction & distribution in any medium for non-commercial purposes, provided the original author(s) and source are given credit.
1 Introduction 460
2 Determinants of attrition 461
3 Data and method 464
4 Attrition in the Austrian Generations and Gender Survey 467
4.1 Attrition due to non-contact 469
4.2 Attrition due to non-cooperation 474
4.3 Overall dropout 476
5 Discussion 478
6 Acknowledgements 482
References 483
Attrition in the Austrian Generations and Gender Survey:
Is there a bias by fertility-relevant aspects?
Isabella Buber-Ennser1
Abstract
BACKGROUND
In longitudinal research the loss of sample members between waves is a possible source of bias. It is therefore crucial to analyse attrition.
OBJECTIVE
This paper analyses attrition in a longitudinal study on family and fertility, by distinguishing between attrition due to non-contact and attrition due to non-cooperation.
METHODS
Based on the first two waves of the Austrian Generations and Gender Survey, the two components of attrition are studied separately by using bivariate as well as multivariate methods. Moreover, overall dropout – the combination of both components – is analysed. Apart from various socio-economic characteristics and data collection information, the study focuses on fertility-relevant variables such as fecundity, fertility intentions, sexual orientation, and traditional attitudes.
RESULTS
Fecundity, fertility intentions, and homosexual relationships are associated with higher attrition due to non-cooperation in bivariate analyses, but have no explanatory power in the multivariate model. Pregnancy and traditional attitudes towards marriage are associated with significantly lower attrition due to non-cooperation in the multivariate context. Overall dropout is significantly lower only among persons with traditional attitudes towards marriage, although small in size and statistical significance. Moreover, various individual and regional characteristics are significantly associated with dropout, with differences between attrition due to non-contact and attrition due to non-cooperation.
1 Wittgenstein Centre for Demography and Global Human Capital (IIASA, VID/ÖAW, WU), Vienna Institute
CONCLUSIONS
Detailed insights into attrition are not only important when using longitudinal data and interpreting results, but also for the design of future data collections. The Austrian GGS panel has a relatively low dropout (22%) and is affected by a small bias towards family-oriented persons as well as less-educated respondents and persons with migration backgrounds, but the data can be used without concern about selectivity.
1. Introduction
In longitudinal research the loss of sample members between waves – known as attrition – is a common problem and a substantial factor in most panel studies. Attrition may not only decrease the sample size but also may lead to biased estimates if cases are not dropping out randomly from the original sample (Miller and Wright 1995). Non-response is a source of bias in survey estimates if those who respond are different from those who do not with respect to characteristics of interest (Groves 2006). It is therefore crucial to analyse attrition and to find out who left a panel study. As detailed information is available from the first wave – and information increases with each wave – research on the response rate in the second and subsequent waves of a panel can take into account a variety of possible determinants and is therefore going to differ from studying response rates in the initial wave (Lepkowski and Couper 2002).
Non-response may be the consequence of failure to locate a previously interviewed person, failure to contact a person once located, or refusal by a respondent that has been contacted (Lepkowski and Couper 2002). These different types of non-response have different causes (Watson and Wooden 2009). As the distinction between location and contact is often empirically difficult, the response process is usually modelled as the outcome of two sequential events, namely contact and cooperation (e.g., Abraham, Maitland, and Bianchi 2006; Nicoletti and Peracchi 2005; Watson and Wooden 2009). Others study attrition in general, without this differentiation (e.g., Abraham et al. 2006; Behr et al. 2005).
The current paper analyses attrition between wave 1 and wave 2 of the Austrian Generations and Gender Survey (GGS). We distinguish between attrition due to unsuccessful contact and due to non-cooperation. The two components of attrition are studied separately by using bivariate as well as multivariate methods. Moreover, overall dropout – the combination of both components – is analysed.
on family formation and fertility it is crucial to find out if data are possibly biased in this respect, which would have an impact for analyses related to the core questions of the GGS. In addition, insights on attrition are valuable for the design of future panel surveys.
2. Determinants of attrition
Possible candidates for predicting contact and cooperation in longitudinal surveys are characteristics of individuals and households as well as field phase-related characteristics (Fitzgerald, Gottschalk, and Moffitt 1998; Lepkowski and Couper 2002). Numerous studies have analysed the associations between respondents’ characteristics and sample attrition (Becketti et al. 1988; Behr, Bellgardt, and Rendtel 2005; Fitzgerald et al. 1998; D. Watson 2003). Others focused on the data collection process, survey design features, and the interview situation (Nicoletti and Peracchi 2005; Riandey 1988; Watson and Wooden 2009). Furthermore, the sensitivity of the subject plays a role when interviewing respondents (Razafindratsima, Kishimba, and l'équipe Cocon 2004).
Most empirical evidence is based on the Panel Study of Income Dynamics (PSID), the British Household Panel Study (BHPS), the European Community Household Panel (ECHP), the German Socio-Economic Panel (GSOEP), the Dutch Socioeconomic Panel, the National Longitudinal Study of Youth (NLSY), the US Time Use Survey (ATUS), the US Longitudinal Study on Generations, and the Australian Household, Income and Labour Dynamics Survey (HILDA). Moreover, studies based on selected GGS countries and a French longitudinal survey on contraception (CONCON) reveal valuable insights into family and fertility surveys. We summarise the predictors of non-contact, non-cooperation, and overall dropout.
The factors affecting non-cooperation (i.e., response once a contact has been made) include individual characteristics of respondents, their identification with the study, the survey topic, their interview experience in prior waves, and the survey design (Groves and Peytcheva 2008; Watson and Wooden 2009). “A lack of cooperation is mainly the result of a personal decision that reflects personal characteristics, related to the perceived cost of completing the interview and a person’s past experience with the survey” (Nicoletti and Peracchi 2005, p. 774).
The findings on demographic and socio-economic characteristics regarding cooperation can be summarised as the following: being female, being married, or having children is positively related to the probability of future cooperation, whereas being widowed or divorced, not living in a couple, or being a lone parent is negatively related. Response rates are low for people separated or never married, for people who are out of the labour force, for renters (as compared to home owners) and for those who live in metropolitan areas – characteristics regarded as proxies for social integration (Abraham et al. 2006). Moreover, cooperation is low among those on welfare, non-whites, the less educated, and individuals with few working hours or low income – indicators of belonging to the lower proportion of the socioeconomic distribution (Haisken-DeNew and Frick 2005; Moffitt, Fitzgerald, and Gottschalk 1999). In addition, health and religiosity are significant predictors of panel response (Miller and Wright 1995; Razafindratsima et al. 2004).
An overview of the literature suggests that the field phase situation is also an important predictor of cooperation (Vandecasteele and Debels 2007). The interviewer– respondent interaction is crucial, with persons contacted by the same interviewer as in the previous wave being more willing to cooperate again (Behr, Bellgardt, and Rendtel 2003; Groves and Couper 1998; Hox and de Leeuw 2002) and there is a correlation between educational level of interviewer and response rate (Albacete et al. 2012). Sponsorship of the survey, incentives, the mode of data collection, the topic of the survey, and questions perceived as intrusive or offensive are relevant (Groves and Peytcheva 2008; Arnaud Régnier-Loilier, Saboni, and Valdes 2011). Moreover, item non-response on crucial variables is related to dropout in subsequent waves (Loosveldt, Pickery, and Billiet 2002; D. Watson 2003). It is regarded as an indicator of low cooperation, lack of interest in the survey, and unpleasant or negative experiences (Loosveldt et al. 2002; Rendtel 2002).
on employment status diverge as well: on the one hand, being out of the labour force is associated with low response rates (Abraham et al. 2006). On the other hand, in some European countries unemployed persons show an increased response probability in multivariate models (Behr et al. 2005). Diverging results across Europe are also evident for level of education (Behr et al. 2005; Watson 2003). For example, in northern European countries more highly educated people are less likely to drop out, but this effect is reversed in southern European countries where those with higher education are more likely to be lost (Watson 2003). Regarding respondents’ gender, studies on survey response mostly find higher response rates among women than among men. The main reason usually cited for this observation is the fact that women are more often at home (Watson and Wooden 2009). Nevertheless, there is limited evidence that – even conditional on contact – men may be more likely to discontinue survey participation (Nicoletti and Buck 2004; Watson and Wooden 2009). Income distribution also turned out to be relevant to attrition, again with opposite trends in southern and northern European countries (Watson 2003).
Bartus and Spéder (2013) studied the relationship between respondent characteristics and panel continuation in five GGS countries (Bulgaria, France, Georgia, Germany, and Hungary). Whereas dropout is high among men and low among home owners across all countries, the findings for family characteristics and income diverge: in bivariate analyses the authors find that childless persons are underrepresented, while the married, the educated, and persons with relatively higher income are overrepresented in the second wave sample. Bulgaria and Georgia constitute notable exceptions: in Bulgaria, parents of young children and highly educated persons are less likely to continue. In addition, the relationship between dropout and perceived income becomes reversed in Bulgaria and Georgia, where those reporting economic constraints participated more often in the second wave. Evidence from multivariate regression analyses is more mixed. Moreover, detailed studies on attrition in the French GGS (between both waves 1 and 2 and waves 1 and 3), including longitudinal weights based on these analyses, constitute valuable contributions to the literature (Régnier-Loilier and Lincot 2010; Régnier-Loilier 2012; Régnier-Loilier and Guisse 2012).
specific survey, and it turned out that method of contraception does have an effect on attrition (Razafindratsima et al. 2004).
Following the proposed distinction, it is crucial to study attrition in the GGS by family- and fertility-related variables, such as fertility intentions, pregnancy, perceived problems in conceiving a child, and homosexual partnership. We want to find out if item non-response on crucial variables in the GGS is related to attrition. The particular contribution to the literature is twofold: first, to our knowledge, fertility-related aspects have not been studied in detail in panel studies focusing on family formation and fertility. Second, the systematic inclusion of individual and field-phase characteristics and the distinction between contact and cooperation contributes to the literature in disentangling the dropout process. Available data for Austria allowed this approach. The current paper complements recent studies on attrition in the GGS and might stimulate research on further GGS countries or other family surveys.
3. Data and method
The current study is based on the Austrian GGS. The first wave was carried out in 2008/9 and includes 5,000 respondents aged 18 to 45 years. The sample was drawn from the Austrian central register. The response rate in wave 1 was 60.7% (Statistik
Austria 2009). The second wave was carried out four years later,2between September
2012 and May 2013. For further information on data validation we refer to Buber (2013). At the end of the interview in wave 1, respondents were asked whether they agreed to be contacted for another interview three years later. 96% agreed to be contacted again, indicating a high willingness to continue. Regardless of the given answer a letter was sent out to all respondents in spring 2012 asking if they agreed to be contacted and interviewed for a second wave. This letter was also important for further updating the address list of interviewees. It turned out that geographical mobility was substantial, as 800 out of the 5,000 respondents of wave 1 had changed address between wave 1 and wave 2 (information provided by Statistics Austria). If respondents had moved between wave 1 and wave 2 and if they had – according to Austrian law – registered their residential move in the central register, the contact address was updated by Statistics Austria. Due to the access to the central register, the loss of respondents due to unknown address was expected to be comparatively low.
For panel maintenance, Christmas cards were sent out to the respondents. Respondents were informed about the survey they had participated in and findings arising from it. Thereafter, the letter inviting them to take part in the second wave
2 According to international guidelines, the interval between waves is three years (UN 2005). Due to financial
referred to the homepage of the Austrian GGS, with general information on the survey and a downloadable brochure presenting first results for Austria. The interviewers offered a printed version of this brochure to the respondents. To prepare, motivate, and support interviewers, training for the first and the second waves included not only general information on the survey tool (CAPI – computer-assisted personal interview)
and recent trends in fertility in Austria3 but also offered professional soft-skills
trainings. The aim was to prepare interviewers intensively for unusual interview situations, such as the loss of a family member, separation, or an unfulfilled wish to have children. A further approach to gaining high survey participation was the concept of respondents being interviewed by persons of the same gender. The GGS survey included questions on very personal topics, such as fecundity and conception. Matching respondents and interviewers by gender is regarded as a way to facilitate communication (Hyman 1954) and to increase data quality regarding sensitive topics (Catania et al. 1996).
We first provide a description of the small subgroups of respondents no longer in the central register, not living at the given address, unable to be reached, and unable to be interviewed. In a second step we focus on attrition due to non-contact and in a third
step on attrition due to non-cooperation.4 Finally, overall attrition is presented.
Descriptive as well as multivariate methods are used to characterise the two broad groups of dropouts as well as overall dropout.
According to Behr et al. (2005) it is important to analyse attrition with respect to survey-relevant characteristics. In the GGS these are – besides e.g., marital status and parity – fertility-related variables like fecundity, fertility intentions, or traditional attitudes. The GGS includes questions on fecundity. Both the respondent’s problems and, if cohabiting with a partner or living in a living-apart-together relationship, the
partner’s problems conceiving a child were captured.5 The GGS includes different
dimensions of fertility intentions, namely the intention to have a child (1) now, (2)
3 The Austrian Institute for Family Research at the University of Vienna and the Vienna Institute of
Demography (VID) of the Austrian Academy of Science constitute the Austrian country team. They were involved in the preparation of the first and the second waves of the GGS and, among others, supported the survey agency in the interviewer training.
4 For a study on locating, contact, and successful interview we refer to Abraham, Maitland, and Bianchi,
(2006) who distinguish different types of noncontact and model them separately. This paper focuses on unsuccessful contact and refusal and does not further elaborate on unsuccessful locating of sample members, which is associated with mobility and tracking procedures (Watson and Wooden 2009) and mainly addressed by research on survey methodology.
5 The exact wording of the question for own fecundity was: “Some people are not physically able to have
within three years, and (3) ever. Due to the filter structure of the survey, not all respondents were asked these questions. According to international guidelines, women aged 50 years or more, male respondents with a female partner aged 50 years or more, and respondents with same-sex partners were not asked all the questions on pregnancy, fecundity, and fertility intentions. Moreover, fertility intentions within the next three years were skipped in the case of pregnancy. Respondents intending to have a child within the next three years were not asked about any further childbearing plans. Therefore we combined the information on pregnancy, age of female partner, and type of sexual relationship on the one hand, and fecundity and fertility intentions on the other hand. Moreover, traditional attitudes might be relevant to family and fertility behaviour. The GGS includes the attitude towards marriage, captured by the statement “Marriage is an outdated institution”. This item was incorporated in the current study on attrition.
As the Austrian GGS is restricted to the age range 18 to 45 years we are unable to take into account further survey-relevant characteristics included in the GGS that become relevant for individuals at more advanced ages, such as intergenerational exchange and dependencies.
Various socio-demographic, economic, and data collection characteristics were taken into consideration. Apart from the standard variables on marital status, partner status, parity, and household, a combination of these variables was generated to characterise the living arrangements of respondents, distinguishing between (1) being a child in one’s birth family, (2) married couple without children, (3) non-married couple without children, (4) married couple with children, (5) non-married couple with children, (6) single mother, (7) single father, (8) living alone and (9) other living arrangements. Information on the relation to the household members revealed that the latter group comprised shared accommodations, either with relatives (siblings,
grandparents) or with non-relatives, typically shared student flats.6
To capture information on migration background, not only nationality at birth and current nationality but also mother tongue and first language usually spoken at home were taken into consideration. For residential mobility the data included information on intended residential move in wave 1 and degree of certainty (definitely no, probably no, yes), as well as the planned destination for those intending to move (e.g., abroad, within province). The combination of both turned out to be a valuable source of information on dropout.
Different indicators are included in the data to capture regional characteristics and housing. According to the OECD regional typology, we distinguished between predominantly urban (share of population living in rural local units below 15%),
6 Shared living arrangements with relatives were more common (57%) than flatsharing with nonrelatives
intermediate (share of the population living in rural units between 15% and 50%) and predominantly rural areas (OECD 2010). In addition, the nine Austrian provinces and housing conditions (home-ownership, tenant, rent-free accommodation, and other type of housing) were taken into account.
To capture health and wellbeing, self-perceived health and limitations in daily activities because of physical or mental health problems or disability were taken into consideration. Moreover, providing regular personal care to others (not including small children) on the one hand and being able to rely on emotional support on the other were included as a further aspects of health and wellbeing. Emotional support, captured by the question “Over the last 12 months, have you talked to anyone about your personal experiences and feelings?”, was associated with higher attrition in the French GGS (Régnier-Loilier 2012; Régnier-Loilier and Guisse 2012), and might be considered as a proxy for social integration.
Two fieldwork variables are included in the model, namely length of the interview in wave 1 and interviewer ID in wave 2. Interview duration was categorised in (1) less than 45 minutes, (2) 45 minutes up to less than 2 hours, (3) 2 hours and more, (4) no duration given (most probably due to interruptions during the interview). Interviewer characteristics like gender, age, and level of education are not included in the analysis,
as the current paper focuses on respondents’ demographic behaviour and attitudes.7
However, given the possibility of identifying interviewers, an analysis using robust standard errors, which cluster by interviewer, was conducted. Finally, willingness expressed at the end of the wave 1 interview to participate in wave 2 is crucial for panel dropout and was taken into account. The GGS envisages as possible answers (1) yes, (2) no, and (3) don’t know.
4. Attrition in the Austrian Generations and Gender Survey
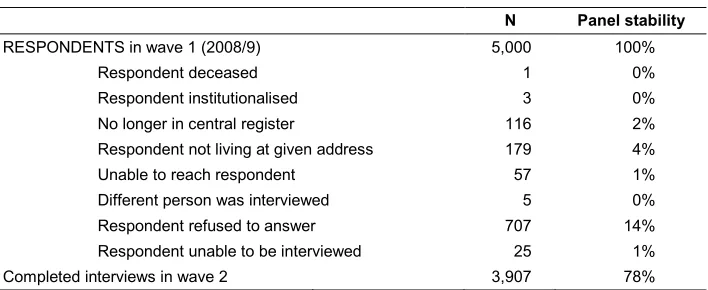
In total, 116 wave 1 respondents could not be found in the central register (Table 1). By Austrian law, first establishment of accommodation in Austria, moving house within Austria, and establishment of a further residence require registration in the central
register.8Reasons for being no longer in the central register in wave 2 are thus either an
unregistered move abroad or an unregistered death while temporarily abroad. In total, 3,907 interviews with wave 1 respondents could be realised in wave 2, which corresponds to a panel stability of 78%. Refusing to participate and not living at the
7 With the exception of one single respondent, respondents were questioned by interviewers of the same
gender. Further information, such as interviewer continuity, is not available.
given address were the main reasons for dropout. Death,9 institutionalisation, inability
to be contacted, inability to be interviewed10, and interview with a different person in
the household were further reasons for dropout, although small in size (Table 1). Panel stability was 65% in the French GGS (Régnier-Loilier and Lincot 2010), 73% in the Bulgarian, 79% in the Hungarian, and 83% in the Georgian GGS, whereas Germany constituted an exceptional situation with panel continuation of only 32% (Bartus and Spéder 2014). Therefore, by international comparison, panel stability in Austria is comparatively high.
Table 1: Panel stability and response rate for the Austrian GGS
N Panel stability
RESPONDENTS in wave 1 (2008/9) 5,000 100%
Respondent deceased 1 0%
Respondent institutionalised 3 0%
No longer in central register 116 2%
Respondent not living at given address 179 4%
Unable to reach respondent 57 1%
Different person was interviewed 5 0%
Respondent refused to answer 707 14%
Respondent unable to be interviewed 25 1%
Completed interviews in wave 2 3,907 78%
Comparing the distribution of numerous socio-economic characteristics of respondents participating in wave 1 and the total of respondents interviewed in wave 2 reveals that, for all included variables, the differences are 2 percentage points or less (see detailed tables in Buber-Ennser 2013), indicating at first glance that panel respondents do not substantially differ from wave 1 respondents and that bias due to attrition in the Austrian GGS is not very big.
9 A death is coded for only one out of 5,000 respondents. One might speculate that some of the 116
respondents who were no longer in the central register at wave 2 had died in the meantime. According to Statistics Austria, which runs the Austrian central register and the survey agency, this can only be the case if a person had died while temporarily abroad. Otherwise, deregistration in the Austrian central register requires a reason, e.g., moving abroad or death. The fact that half of those no longer in the central register had planned a move at wave 1 and that two-thirds had other than Austrian nationality at birth – compared to 17% in the overall wave 1 sample — supports the assumption that the majority of those no longer in the central register at wave 2 had meanwhile moved abroad.
10 According to the survey agency, reasons for being unable to be interviewed are physical, cognitive and/or
We briefly describe the small subgroups of respondents no longer in the central register, not living at the given address, unable to be reached, and unable to be interviewed: respondents who were no longer in the central register and who were not living at the given address can be characterised as young, intending movers, highly educated individuals, to a large extent with migration background. Persons unable to be reached were most often Austrian nationals and almost half of them were residents of Tyrol, a province in the west of Austria. The specific situation when conducting the second wave of the survey in Tyrol is the main reason for the relatively high proportion
of women who could not be reached.11 The small proportion of respondents unable to
be interviewed were most often female, non-Austrian nationals at birth, had rather low education, had a language other than German as their mother tongue or as the first language spoken at home, and their interviews at wave 1 were longer on average
(possibly indicating language problems).12 Moreover, health problems were more often
reported in this group, either via limitations in daily activities or via bad self-perceived health. For further characterisation of these small dropout groups we refer to Buber-Ennser (2013).
4.1 Attrition due to non-contact
Individuals known to be outside of the scope of a survey (those who died, moved to an institution, or moved outside the country) are excluded in the analyses of panel attrition (Behr et al. 2005; Nicoletti and Peracchi 2005; Watson 2003). As we cannot identify individuals who moved abroad, we exclude for the analysis of attrition only persons deceased or institutionalised, reducing the sample to 4,996 wave 1 respondents. Attrition due to non-contact, which was either because the respondent was no longer in the central register, not living at the given address, unable to be reached, or because a different person was interviewed in the household, added up to 357 persons, which corresponds to a proportion of 7%.
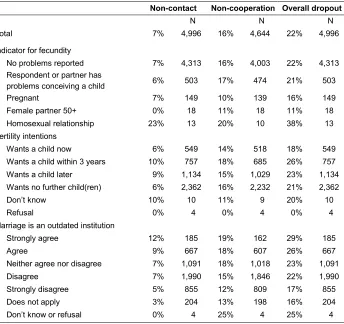
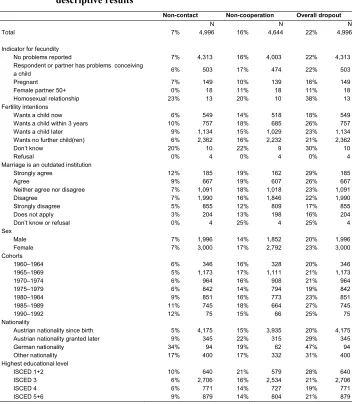
Descriptive results reveal minor variations in the attrition due to non-contact for fecundity (Table 2, column 2). The small group (nine persons) answering the question on their own fecundity problems with “don’t know” had higher dropout (11%). The same holds for those answering in wave 1 the question on partner’s fecundity problems
11 During fieldwork no female interviewer trained by Statistics Austria was available in this province. Female
respondents were assigned either to male interviewers in Tyrol or to female interviewers from other Austrian provinces. In Tyrol the high proportion of (female) respondents who were unable to be reached resulted in high attrition due to noncontact.
12 According to oral information given by the survey agency, some respondents with a mother tongue other
with “don’t know” (7 persons, attrition 29%, results available on request). Given the small numbers in these groups, the relatively high attrition has to be interpreted with caution. Type of sexual relationship was related to attrition: respondents living in a homosexual relationship had higher attrition (23%) due to unsuccessful follow-up. Again, this group was quite small in wave 1 (13 respondents), indicating that neither wave 1 nor wave 2 data allow specific analyses of men and women living in a homosexual relationship. Fertility intentions, a central variable in the GGS, were not associated with attrition due to unsuccessful follow-up in bivariate analyses. However, attitudes towards marriage were associated with dropout, in the sense that those strongly agreeing that marriage is an outdated institution had higher attrition due to unsuccessful follow-up (12%), those agreeing also had comparably high attrition (9%), whereas those strongly disagreeing with this statement had lower attrition (5%).
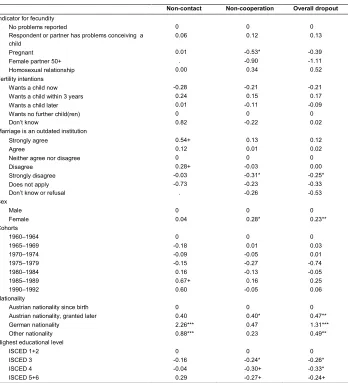
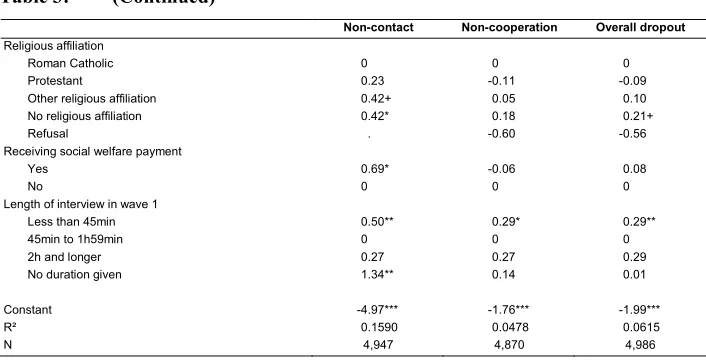
We ran logit regressions to estimate the probability of non-contact (Table 3, column 2). In the multivariate framework, attitudes towards marriage were significantly associated with attrition: persons strongly agreeing that marriage is an outdated institution had significantly higher attrition due to non-contact. Additional groups with significantly higher attrition due to non-contact were: cohorts born 1985–1989 (thus aged 19–23 at wave 1 and 22–27 at wave 2), respondents with other than Austrian
nationality13(particularly German nationals14), self-employed persons, married couples
without children, persons sharing accommodation with others (relatives or non-relatives), members of the urban population, citizens of certain Austrian provinces
(Burgenland, Carinthia, and Tyrol15), individuals who planned to move in wave 1
(particularly if planning to move abroad) and even those merely considering a move, those not willing to be contacted again, persons with other than Roman Catholic or Protestant religion or without any religious affiliation, recipients of social welfare payments at wave 1, and those with rather short interviews in wave 1 (less than 45 minutes) or without coded interview duration in wave 1. Respondents who were on parental leave in wave 1 had significantly lower attrition (as compared to employed individuals). The remaining individual- and fieldwork-related indicators had no
13 To take into consideration the migration background we ran different models including indicators for
nationality, mother tongue, and first language spoken within the family. A detailed differentiation for nationality since birth had the best model fit.
14 Germans constitute the largest migrant group and the share of German students at Austrian universities is
high. These circumstances partly explain the characteristics of respondents who are no longer in the Austrian central register: we assume that some of the respondents with German nationality left Austria between waves 1 and 2 and are therefore no longer in the central register.
15 Attrition by province and gender clearly revealed female respondents in Tyrol as the group with highest
explanatory power in the multivariate logit model; some indicators were dropped due to collinearity.
Table 2: Attrition due to fertility-relevant aspects, descriptive results
Non-contact Non-cooperation Overall dropout
N N N
Total 7% 4,996 16% 4,644 22% 4,996
Indicator for fecundity
No problems reported 7% 4,313 16% 4,003 22% 4,313
Respondent or partner has
problems conceiving a child 6% 503 17% 474 21% 503
Pregnant 7% 149 10% 139 16% 149
Female partner 50+ 0% 18 11% 18 11% 18
Homosexual relationship 23% 13 20% 10 38% 13
Fertility intentions
Wants a child now 6% 549 14% 518 18% 549
Wants a child within 3 years 10% 757 18% 685 26% 757
Wants a child later 9% 1,134 15% 1,029 23% 1,134
Wants no further child(ren) 6% 2,362 16% 2,232 21% 2,362
Don’t know 10% 10 11% 9 20% 10
Refusal 0% 4 0% 4 0% 4
Marriage is an outdated institution
Strongly agree 12% 185 19% 162 29% 185
Agree 9% 667 18% 607 26% 667
Neither agree nor disagree 7% 1,091 18% 1,018 23% 1,091
Disagree 7% 1,990 15% 1,846 22% 1,990
Strongly disagree 5% 855 12% 809 17% 855
Does not apply 3% 204 13% 198 16% 204
Don’t know or refusal 0% 4 25% 4 25% 4
Table 3: Estimated coefficients of logit regressions for attrition
Non-contact Non-cooperation Overall dropout
Indicator for fecundity
No problems reported 0 0 0
Respondent or partner has problems conceiving a child
0.06 0.12 0.13
Pregnant 0.01 -0.53* -0.39
Female partner 50+ . -0.90 -1.11
Homosexual relationship 0.00 0.34 0.52
Fertility intentions
Wants a child now -0.28 -0.21 -0.21
Wants a child within 3 years 0.24 0.15 0.17
Wants a child later 0.01 -0.11 -0.09
Wants no further child(ren) 0 0 0
Don’t know 0.82 -0.22 0.02
Marriage is an outdated institution
Strongly agree 0.54+ 0.13 0.12
Agree 0.12 0.01 0.02
Neither agree nor disagree 0 0 0
Disagree 0.28+ -0.03 0.00
Strongly disagree -0.03 -0.31* -0.25*
Does not apply -0.73 -0.23 -0.33
Don’t know or refusal . -0.26 -0.53
Sex
Male 0 0 0
Female 0.04 0.28* 0.23**
Cohorts
1960–1964 0 0 0
1965–1969 -0.18 0.01 0.03
1970–1974 -0.09 -0.05 0.01
1975–1979 -0.15 -0.27 -0.74
1980–1984 0.16 -0.13 -0.05
1985–1989 0.67+ 0.16 0.25
1990–1992 0.60 -0.05 0.06
Nationality
Austrian nationality since birth 0 0 0
Austrian nationality, granted later 0.40 0.40* 0.47**
German nationality 2.26*** 0.47 1.31***
Other nationality 0.88*** 0.23 0.49**
Highest educational level
ISCED 1+2 0 0 0
ISCED 3 -0.16 -0.24* -0.26*
ISCED 4 -0.04 -0.30+ -0.33*
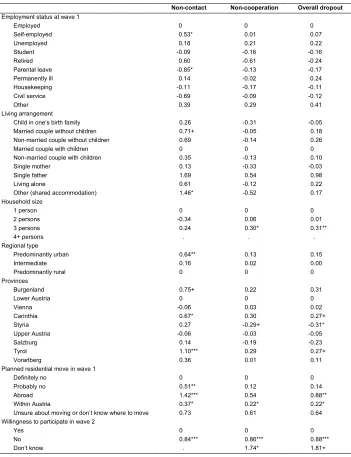
Table 3: (Continued)
Non-contact Non-cooperation Overall dropout
Employment status at wave 1
Employed 0 0 0
Self-employed 0.53* 0.01 0.07
Unemployed 0.18 0.21 0.22
Student -0.09 -0.16 -0.16
Retired 0.60 -0.61 -0.24
Parental leave -0.85* -0.13 -0.17
Permanently ill 0.14 -0.02 0.24
Housekeeping -0.11 -0.17 -0.11
Civil service -0.69 -0.09 -0.12
Other 0.39 0.29 0.41
Living arrangement
Child in one’s birth family 0.26 -0.31 -0.05
Married couple without children 0.71+ -0.05 0.18
Non-married couple without children 0.69 -0.14 0.26
Married couple with children 0 0 0
Non-married couple with children 0.35 -0.13 0.10
Single mother 0.13 -0.33 -0.03
Single father 1.69 0.54 0.98
Living alone 0.61 -0.12 0.22
Other (shared accommodation) 1.46* -0.52 0.17
Household size
1 person 0 0 0
2 persons -0.34 0.06 0.01
3 persons 0.24 0.30* 0.31**
4+ persons . . .
Regional type
Predominantly urban 0.64** 0.13 0.15
Intermediate 0.16 0.02 0.00
Predominantly rural 0 0 0
Provinces
Burgenland 0.75+ 0.22 0.31
Lower Austria 0 0 0
Vienna -0.06 0.03 0.02
Carinthia 0.67* 0.30 0.27+
Styria 0.27 -0.29+ -0.31*
Upper Austria -0.06 -0.03 -0.05
Salzburg 0.14 -0.19 -0.23
Tyrol 1.10*** 0.29 0.27+
Vorarlberg 0.36 0.01 0.11
Planned residential move in wave 1
Definitely no 0 0 0
Probably no 0.51** 0.12 0.14
Abroad 1.42*** 0.54 0.88**
Within Austria 0.37* 0.22* 0.22*
Unsure about moving or don’t know where to move 0.73 0.61 0.64
Willingness to participate in wave 2
Yes 0 0 0
No 0.84*** 0.86*** 0.88***
Table 3: (Continued)
Non-contact Non-cooperation Overall dropout
Religious affiliation
Roman Catholic 0 0 0
Protestant 0.23 -0.11 -0.09
Other religious affiliation 0.42+ 0.05 0.10
No religious affiliation 0.42* 0.18 0.21+
Refusal . -0.60 -0.56
Receiving social welfare payment
Yes 0.69* -0.06 0.08
No 0 0 0
Length of interview in wave 1
Less than 45min 0.50** 0.29* 0.29**
45min to 1h59min 0 0 0
2h and longer 0.27 0.27 0.29
No duration given 1.34** 0.14 0.01
Constant -4.97*** -1.76*** -1.99***
R² 0.1590 0.0478 0.0615
N 4,947 4,870 4,986
Significance levels: + p<0.10; * p<0.05; ** p<0.01; *** p<0.001.
Remark: The model for attrition due to non-cooperation used robust standard errors which cluster by interviewer. Further individual characteristics had no explanatory power. For the entire model we refer to Table A3 in the Appendix.
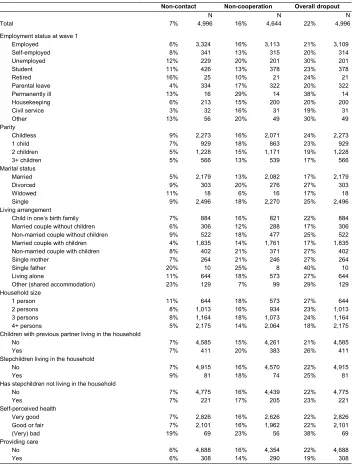
First descriptive results and chi-squared tests had revealed significant differences by level of education and living arrangement: attrition due to unsuccessful follow-up was higher in the lowest (ISCED 1+2) and highest (ISCED 5+6) educational groups, among students, retired, childless, single, divorced and widowed persons, non-married couples without children, and single parents (Table A1). In addition, economic constraints indicated by unemployment, difficulties in making ends meet, and receiving social welfare payments were significantly associated with higher attrition due to non-contact in bivariate statistics. However, these differences failed to show statistical significance in the multivariate framework.
4.2 Attrition due to non-cooperation
As mentioned earlier, at the end of the wave 1 interview respondents were asked if
they agreed to be contacted again.16 All those interviewed in wave 1 – regardless of
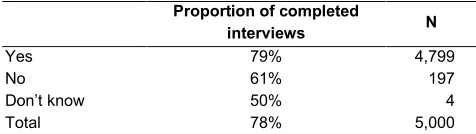
their answer on wanting to be interviewed in a second wave – were politely invited to consider participating in wave 2. This was successful as 61% of those not willing to continue the panel survey were in fact interviewed in wave 2 (Table 4). Our findings indicate that – at least in Austria – it is worthwhile contacting respondents again and asking them to consider participating in the panel, even if in the initial interview they signalled unwillingness to do so.
Table 4: Willingness in wave 1 to participate in wave 2 and completed
interviews in wave 2
Proportion of completed
interviews N
Yes 79% 4,799
No 61% 197
Don’t know 50% 4
Total 78% 5,000
Again, we started by analysing fertility-related aspects. Compared to the mean (16%), attrition due to non-cooperation was substantially lower in the case of pregnancy at wave 1 (10%; Table 2, column 4). The small group of persons living in a homosexual relationship more often refused to participate in wave 2 (20%). Several specifications for problems conceiving a child were considered (Table A2). Both the respondent’s and the partner’s problems with conceiving a child were associated with slightly higher
attrition due to non-cooperation in bivariate analyses.17 Moreover, refusing to answer
questions on fecundity problems in wave 1 was related to high attrition in wave 2, but
due to the small size of this group18 this result has to be regarded with caution, although
there is some indication of a link between the refusal to answer this rather sensitive question and the refusal to participate in wave 2.
16 The exact wording of the question was: “Vieles in einem Menschenleben ist heute so und morgen anders.
Das Generations and Gender Programm erarbeitet derartige Veränderungen. Dürfen wir Sie in drei Jahren wieder kontaktieren?”
17 Attrition due to non-cooperation was 15% among respondents stating that they could certainly conceive a
child, 17% among respondents answering that they could probably conceive a child, 18% among respondents who stated that they probably could not conceive a child, and 17% among those stating that they certainly could not conceive a child. The partner’s problems conceiving a child were associated with slightly higher attrition (17% versus 15%, Table A2)
18 Three respondents refused to answer the question regarding own fecundity; one respondent did not disclose
Regarding fertility intentions, descriptive analyses showed somewhat lower attrition among those wanting a child at the time of the wave 1 interview (14%) and higher attrition if they intended to have a child within the next three years (18%) but no further differences in the other categories (Table 2, column 4). Attrition due to non-cooperation varied substantially by attitude towards marriage, captured via “Marriage is an outdated institution”: (strong) agreement with this statement was associated with higher dropout (18% to 19%), strong disapproval with lower dropout (12%). Dropout among those who refused to answer this question was high (25%), but this group was very small (only four persons).
Although bivariate analyses indicated minor differences in attrition by fecundity, multivariate analyses revealed no significantly higher attrition in the case of problems
conceiving a child.19 On the contrary, pregnancy and very traditional attitudes20 were
associated with significantly lower attrition due to non-cooperation (Table 3, column 3). In the multivariate model, non-response rates were significantly higher among women, Austrian nationals who received Austrian nationality not at birth but later in life, less educated persons, those who planned a residential move, and those who did not want to be contacted again. Moreover, respondents with short interview length in wave 1 and residents of a specific Austrian province (Styria) showed significantly higher response rates. Regression analysis for attrition due to non-cooperation used robust standard errors which cluster by interviewer, thus treating only records with different interviewers as truly independent.
4.3 Overall dropout
Finally, we focus on 4,996 respondents and distinguish between dropout and successful interview only. With this distinction, the overall dropout rate is 22%. Whereas separate analyses on attrition due to unsuccessful contact or refusal allows us to clearly see at which point of the panel study respondents were lost, analyses of general dropout reveals valuable information for data users regarding possible bias in the data. Also, both types of attrition are often combined for generating longitudinal weights. This was, for example, the strategy in the German DemoDiff study (Brüderl et al. 2011).
Overall dropout – the combination of dropout due to non-contact and dropout due to non-cooperation – was relatively high among those intending to have a child within
19 Different specifications and combinations of the two questions on conception were incorporated in
multivariate models to discover the best model fit. Finally, fecundity was captured via an indicator for either own or partner’s problems conceiving a child. The same applies for different specifications of fertility intentions (see Buber-Ennser 2013 for more details).
the next three years (26%), among persons with liberal attitudes towards marriage (29%), and among respondents living in a homosexual relationship at wave 1 (38%) (Table 2, column 6). Overall dropout was relatively low in the case of pregnancy at wave 1 (16%) and among respondents with traditional attitudes towards marriage (17%). Dropout was of the same size among respondents with and without fecundity problems (21% and 22%, respectively).
Multivariate logit regressions revealed that fecundity and fertility intentions were not significantly associated with dropout, whereas respondents with traditional attitudes towards marriage and those expecting a child at wave 1 had significantly lower dropout rates (Table 3, column 4). In addition, women, persons with migration backgrounds, less educated persons (ISCED 1 and 2), residents of specific Austrian provinces (Carinthia and Tyrol), persons with no religious affiliation, persons planning a move, and those not willing to be contacted for another interview had significantly higher attrition. Moreover, a comparatively short interview duration at wave 1 was also associated with higher attrition.
Gender-specific analyses revealed that pregnant women had significantly lower dropout rates, whereas men whose partner was expecting a child did not show significantly lower attrition (results available on request). Traditional attitudes towards marriage were associated with higher dropout among women, not among men. Educational differences were stronger among women than men (the estimated coefficients were statistically significant among women only). Regional variations also differed between women and men: dropout was highest among women living in Carinthia and in Tyrol. Whereas dropout was high in Tyrol due to the special field-phase situation (see above), the high dropout in Carinthia might reflect a politically difficult situation in this part of Austria around the time of wave 2 of the survey (personal communication by Statistics Austria): several cases of mismanagement in the federal government of Carinthia had become public at that time and led to a general disappointment with and distrust of political institutions. As the GGS was financed by the ministry, a political institution, the high dropout might be interpreted as a reaction to the political situation in this part of Austria at the time around GGS wave 2.
components of attrition, and our findings not only underline that different types of non-response have different causes but also that these two components are valuable for future data collection.
In general, model fit remained rather modest. Regarding the low explanatory power of models, Watson and colleagues (2009, p. 179) conclude: “While there is undoubtedly (and thankfully) a large random component to survey nonresponse, it is nevertheless clear that there are strong associations between many observable characteristics of both respondents and interview process and experience that are predictive of nonresponse [.]. Such information […] can provide variables for inclusion in attrition models used in the construction of population weights or as instruments at the analysis stage”. They conclude that poor explanatory power is a desired outcome, in the sense that it reflects the large random component in survey non-response (Watson and Wooden 2009, p. 171). Following their argument, the comparatively low model fit in the current study indicates a large random component in survey non-response in the current data. The remaining unexplained variance could also be attributable to variables or factors that were not included within the analysis but are still associated with demographic behaviour or attitudes.
Summarising, this detailed study of attrition reveals a bias towards family-oriented persons as well as less-educated respondents and persons with migration backgrounds. Nevertheless, the estimated coefficients are small in size and often of low statistical significance. Despite this small bias the study highlights the fact that the Austrian GGS panel data can be used without (much) concern regarding selectivity. These data are a valuable basis for understanding demographic behaviour and the underlying causal mechanisms.
5. Discussion
information on the field phase in waves 1 and 2 were available and allowed a comprehensive investigation of causes and determinants of attrition.
This study on attrition in the Austrian GGS revealed that certain fertility-related aspects were associated with panel dropout. On the one hand, pregnant women and persons with traditional attitudes had lower dropout, indicating that the second wave of the Austrian GGS is somewhat biased towards family-oriented persons. Although the estimated coefficients in the overall model on overall dropout were significant at a 10% and at a 5% level only, these results have to be taken into consideration when analysing and interpreting results based on the longitudinal panel. Distinguishing between attrition due to non-contact and attrition due to non-cooperation revealed that women who were pregnant at wave 1, and thus mothers of toddlers at wave 2, refused to be interviewed significantly less often. We might assume that these young mothers were more interested in the topic of the survey. Fertility intentions at wave 1, on the other hand, are not associated with dropout in wave 2 after controlling for other variables, which is important for studying the realisation of fertility intentions.
Descriptive analyses showed that some groups had comparatively high dropout, namely persons in a homosexual relationship, respondents who refused to answer the question on problems conceiving a child, and persons who answered “don’t know” regarding their partner’s fecundity problems. Nevertheless, multivariate analyses revealed no statistically significant association. Due to the small size of these groups the results have to be regarded with caution, despite their possible indication of a link between the refusal to answer rather sensitive questions and the refusal to participate in wave 2. These questions might have been perceived as intrusive or offensive, thus leading to higher non-response in the second wave (Groves and Peytcheva 2008; Arnaud Régnier-Loilier et al. 2011). Item non-response on crucial variables is regarded as an indicator of low cooperation, lack of interest in the survey, and an unpleasant or negative experiences (Loosveldt et al. 2002; Rendtel 2002). In addition, the answer “don’t know” on willingness to participate in a second wave was related to higher dropout and might be an indicator of not being interested in a second interview. Overall dropout was comparatively high when wave 1 interviews were very short. On the one hand, this was the case when respondents had no children and no partner and thus did not have to answer the corresponding questions. Typically, young men and women had short interviews at wave 1. The fact that the length of interview at wave 1 remained significant when controlling for age, family status, household situation, and various other characteristics might indicate that a very short interview time is related to no interest in the topic and the tendency to answer questions quickly without further deliberation.
attrition due to non-cooperation. On the one hand, young adults, respondents with other than Austrian nationality, self-employed persons, married couples without children, and urban dwellers had significantly higher attrition due to non-contact. These characteristics were also related to higher overall dropout in the French GGS (Régnier-Loilier 2012). In addition, individuals who planned a move in wave 1 (particularly when planning to move abroad), those not willing to be contacted again, persons with other than Catholic or Protestant religion or with no religious affiliation, recipients of social welfare payments at wave 1, and those with rather short interview durations in wave 1 had significantly higher attrition due to non-contact. Regional variation in dropout due to non-contact was due to the specific field phase situation in one province. On the other hand, attrition due to non-cooperation was significantly higher among women, Austrian nationals who received Austrian nationality not at birth but later in life, less educated people, persons who planned a residential move or were unclear about moving, and those who did not want to be contacted again. These results stress the importance of including detailed information on residential move and migration background.
Regarding the respondents’ gender, studies on survey response mostly find higher response rates among women than men. The main reason usually cited for this observation is the fact that women are more often at home (Watson and Wooden 2009). Nevertheless, there is limited evidence that – even when successfully contacted – men may be slightly more likely to discontinue survey participation (Nicoletti and Buck 2004; Watson and Wooden 2009). The fact that women more often refused to participate in wave 2 was interpreted by interviewers at Statistics Austria with the following assumption or observation: if men agree to participate in a survey, they are to some extent more convinced of the survey itself and thus more likely to answer in a second wave. Women, on the other hand, reflect about panel participation later, i.e., after the first interview has taken place. They are therefore more likely to refuse participation in a second wave. This explanation is based on personal experience and ensuing reflections of interviewers of the Austrian GGS wave 1 and wave 2, not on empirical material. Nevertheless, we are convinced that interviewers acquire a lot of knowledge during their work – some of the Austrian interviewers have had over twenty years’ survey experience – and it might be worth conducting qualitative interviews to gain further insight into the interview process.
situation become evident once more. In this regard, Austria is in line with countries like France, Germany, and Hungary, where highly educated persons and those with relatively more income have lower dropout. The opposite is the case in Bulgaria and Georgia: in Bulgaria, highly educated persons were less likely to continue, and both in Bulgaria and Georgia those who reported economic constraints participated in the second wave more often (Bartus and Spéder 2013).
Our findings on attrition are valuable for the design of future data collections. First, panel maintenance in the Austrian GGS was high compared to other surveys (both GGS and non-GGS). What was crucial therefore was access to the central register by the survey agency Statistics Austria. By Austrian law, first establishment of accommodation in Austria, house moving within Austria, and establishment of a further
residence must all be recorded in the central register.21 If respondents had moved
between waves (and 16% of respondents did so) they were contacted at their new address for the second wave. This turned out to be key for panel maintenance, and future data panel collections should elaborate the possibility of using central registers. Second, we discovered that those pregnant at wave 1 and those with traditional attitudes towards marriage were less likely to drop out than those with non-traditional marriage attitudes. Earlier studies on fertility data pointed out a ‘family bias’ in social-science surveys, with the fertility of younger cohorts being overstated, because respondents with young children are easier to reach by interviewers (Festy and Prioux 2002), whereas childless respondents are considered to be “reluctant to participate because they are of the opinion that the theme of the survey is not relevant to them” (Kreyenfeld et al. 2011, p. 352). Our results on pregnancy and attitudes towards marriage are in line with this research evidence, by extending on the longitudinal data perspective. Identifying strategies to circumvent this would be helpful for future family surveys.
Third, as indicators for model fit reveal that attrition associated with demographic behaviour and attitudes is primarily associated with non-contact rather than refusal, efforts to improve the tracking of respondents would be a better strategy for survey participation than, for example, incentives.
Finally, regarding the willingness of respondents to continue in a panel survey, it is worth reiterating that in Austria all persons were asked at the end of the wave 1 interview if they agreed to be contacted again and, regardless of their answer, were later politely invited once more to consider participating in wave 2. It turned out that this attempt at encouraging participation was successful, as 61% of those who had not been willing to continue the panel survey at the end of wave 1 were successfully interviewed in wave 2.
Two main conclusions are key: first, the Austrian GGS panel has a relatively low dropout rate (22%) and is affected by a small bias towards family-oriented persons as
well as less educated respondents and persons with migration background, but the data can be used without (significant) concern about selectivity. Second, the results are relevant not only to data users but also to future data collection.
6. Acknowledgements
References
Abraham, K.G., Maitland, A., and Bianchi, S.M. (2006). Nonresponse in the American time use survey: Who is missing from the data and how much does it matter?
The Public Opinion Quarterly 70(5): 676–703. doi:10.1093/poq/nfl037.
Albacete, N., Lindner, P., Wagner, K., and Zottel, S. (2012). Household Finance and Consumption Survey des Eurosystems 2010. Methodische Grundlagen für
Österreich. Geldpolitik & Wirtschaft 3(12).
Bartus, T. and Spéder, Z. (2013). Attrition in the Generations and Gender Survey.
Unpublished Paper, Hungarian Demographic Research Institute Budapest. Becketti, S., Gould, W., Lillard, L.A., and Welch, F. (1988). The panel study of income
dynamics after fourteen years: An evaluation. Journal of Labor Economics 6(4):
472–492. doi:10.1086/298192.
Behr, A., Bellgardt, E., and Rendtel, U. (2003). Comparing poverty, income inequality and mobility under panel attrition: A cross country comparison based on the European Community Household Panel Wiesbaden: Statistisches Bundesamt. (Working Paper No. 12).
Behr, A., Bellgardt, E., and Rendtel, U. (2005). Extent and determinants of panel
attrition in the European Community Household Panel. European Sociological
Review 21(5): 489–512. doi:10.1093/esr/jci037.
Brüderl, J., Ludwig, V., Pforr, K., and Schumann, N. (2011). Praktische
Anwendungsbeispiele zum Umgang mit den pairfam-Daten (Welle 1). Pairfam Technical Paper : Universität Mannheim.
Buber-Ennser, I. (2013). Attrition in the Austrian GGS. VID working paper 10(2013):
1–63.
Buber, I. (2013). Some technical details on the Austrian Generations and Gender Survey Wave 2. Vienna: Vienna Institute of Demography. (Research Report 36). Catania, J., A., Binson, D., Canchola, J., Pollack, L.M., Hauck, W., and Coates, T.J.
(1996). Effects of interviewer gender, interviewer choice, and item wording on
responses to questions concerning sexual behavior. Public Opinion Quarterly
60(3): 345–375. doi:10.1086/297758.
Festy, P. and Prioux, F. (2002). An evaluation of the Fertility and Family Surveys
Fitzgerald, J., Gottschalk, P., and Moffitt, R. (1998). An analysis of sample attrition in
panel data: The Michigan Panel Study of Income Dynamics. The Journal of
Human Resources 33(2): 251–299. doi:10.2307/146433.
Groves, R.M. (2006). Nonresponse rates and nonresponse bias in household surveys.
The Public Opinion Quarterly 70(5): 646–675. doi:10.1093/poq/nfl033.
Groves, R.M. and Couper, M.P. (1998). Nonresponse in household surveys. New York:
John Wiley. doi:10.1002/9781118490082.
Groves, R.M. and Peytcheva, E. (2008). The impact of nonresponse rates on
nonresponse bias: A meta-analysis. The Public Opinion Quarterly 72(2):
167–189. doi:10.1093/poq/nfn011.
Haisken-DeNew, J.P. and Frick, J.R. (eds.). (2005). DTC Desktop companion to the
German Socio-Economic Panel (SOEP). Berlin: DIW.
Hox, J. and de Leeuw, E. (2002). The influence of interviewers' attitude and behaviour on household survey non-response: An international comparison. In: Groves,
R.M., Dillman, D.A., Eltinge, J.L., and Little, R.J.A. (eds.). Survey nonresponse.
New York: John Wiley & Sons: 103–120
Hyman, H.H. (1954). Interviewing in social research. Chicago: University of Chicago
Press.
Kreyenfeld, M., Zeman, K., Burkimsher, M., and Jaschinski, I. (2011). Fertility data for German-speaking countries: What is the potential? Where are the pitfalls?
Comparative Population Studies/ Zeitschrift für Bevölkerungswissenschaft 36
(2–3): 349–380. doi: 10.4232/10.CPoS-2011-06en.
Lepkowski, J.M. and Couper, M.P. (2002). Nonresponse in the second wave of longitudinal household surveys. In: Groves, R.M., Dillman, D.A., Eltinge, J.L.,
and Little, R.J.A. (eds.). Survey Nonresponse. New York: John Wiley & Sons:
259–272.
Loosveldt, G., Pickery, J. and Billiet, J. (2002). Item nonresponse as a predictor of unit
nonresponse in a panel survey. Journal of Official Statistics 18(4): 545–557.
Miller, R.B. and Wright, D.W. (1995). Detecting and correcting attrition bias in
longitudinal family research. Journal of Marriage and Family 57(4): 921–929.
doi:10.2307/353412.
Moffitt, R., Fitzgerald, J., and Gottschalk, P. (1999). Sample attrition in panel data: The
role of selection on observables. Annals of Economics and Statistics 55/56:
Nicoletti, C. and Buck, N.H. (2004). Explaining interviewee contact and co-operation in the British and German Household Panels. In: Ehling, M. and Rendtel, U. (eds.).
Harmonization of panel surveys and data quality. Wiesbaden: Statistisches Bundesamt: 143–166.
Nicoletti, C. and Peracchi, F. (2005). Survey response and survey characteristics:
Microlevel evidence from the European Community Household Panel. Journal
of the Royal Statistical Society A 168(4): 763–781. doi:10.1111/j.1467-985X. 2005.00369.x.
Razafindratsima, N., Kishimba, N. and l'équipe Cocon. (2004). La déperdition dans la
cohorte Cocon entre 2000 et 2002. Population (French Edition) 59(3/4):
419–448. doi:10.2307/3654990.
Régnier-Loilier, A. (2012). Présentation, questionnaire et documentation de la troisième vague de l'étude des relations familiales et intergénérationelles (Erfi-GGS 2011). Paris: INED. (Documents de travail: 187).
Régnier-Loilier, A. and Guisse, N. (2012). Dictionnaire des codes. Troisième vague de l'enquête Érfi. Paris: INED.
Régnier-Loilier, A., Saboni, L. and Valdes, B. (2011). Presentation and modifications to the Generations and Gender Survey Questionnaire in France (Wave 2). L' Étude des relations familiales et intergénérationnelles (Érfi). Paris: INED. (Documents de travail: 173).
Rendtel, U. (2002). Attrition in household panels: A survey. Frankfurt/Main: University of Frankfurt/Main. (Working Paper no. 4).
Riandey, B. (1988). La qualité du suivi des échantillons dans les enquêtes
démographiques: un bilan. Population (French Edition) 43(4/5): 829–854.
doi:10.2307/1533494.
Statistik Austria. (2009). Generations and Gender Survey. Familienentwicklung in
Österreich. Welle 1 – Generationen und Geschlechterrollen. Endbericht. Vienna: Statistik Austria.
UN. (2005). Generations & Gender Programme: Survey Instrument. New York and
Geneva.
Vandecasteele, L. and Debels, A. (2007). Attrition in Panel Data: The Effectiveness of
Watson, D. (2003). Sample attrition between waves 1 and 5 in the European
Community Household Panel. European Sociological Review 19(4): 361–378.
doi:10.1093/esr/19.4.361.
Watson, N. and Wooden, M. (2009). Identifying factors affecting longitudinal survey
response. In: Lynn, P. (ed.). Methodology of longitudinal surveys . Chichester:
Appendix
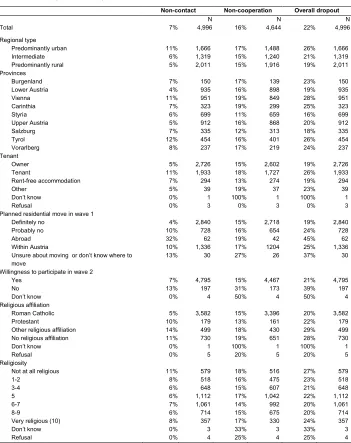
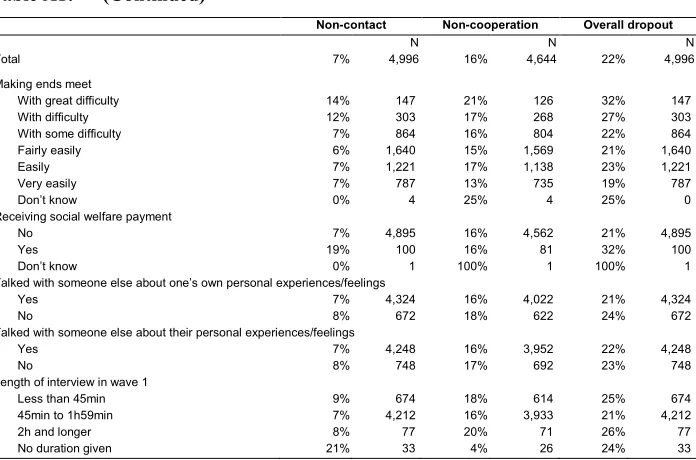
Table A1: Attrition due to non-contact, non-cooperation and overall dropout, descriptive results
Non-contact Non-cooperation Overall dropout
N N N
Total 7% 4,996 16% 4,644 22% 4,996
Indicator for fecundity
No problems reported 7% 4,313 16% 4,003 22% 4,313
Respondent or partner has problems conceiving
a child 6% 503 17% 474 22% 503
Pregnant 7% 149 10% 139 16% 149
Female partner 50+ 0% 18 11% 18 11% 18
Homosexual relationship 23% 13 20% 10 38% 13
Fertility intentions
Wants a child now 6% 549 14% 518 18% 549
Wants a child within 3 years 10% 757 18% 685 26% 757
Wants a child later 9% 1,134 15% 1,029 23% 1,134
Wants no further child(ren) 6% 2,362 16% 2,232 21% 2,362
Don’t know 20% 10 22% 9 30% 10
Refusal 0% 4 0% 4 0% 4
Marriage is an outdated institution
Strongly agree 12% 185 19% 162 29% 185
Agree 9% 667 19% 607 26% 667
Neither agree nor disagree 7% 1,091 18% 1,018 23% 1,091
Disagree 7% 1,990 16% 1,846 22% 1,990
Strongly disagree 5% 855 12% 809 17% 855
Does not apply 3% 204 13% 198 16% 204
Don’t know or refusal 0% 4 25% 4 25% 4
Sex
Male 7% 1,996 14% 1,852 20% 1,996
Female 7% 3,000 17% 2,792 23% 3,000
Cohorts
1960–1964 6% 346 16% 328 20% 346
1965–1969 5% 1,173 17% 1,111 21% 1,173
1970–1974 6% 964 16% 908 21% 964
1975–1979 6% 842 14% 794 19% 842
1980–1984 9% 851 16% 773 23% 851
1985–1989 11% 745 18% 664 27% 745
1990–1992 12% 75 15% 66 25% 75
Nationality
Austrian nationality since birth 5% 4,175 15% 3,935 20% 4,175
Austrian nationality granted later 9% 345 22% 315 29% 345
German nationality 34% 94 19% 62 47% 94
Other nationality 17% 400 17% 332 31% 400
Highest educational level
ISCED 1+2 10% 640 21% 579 28% 640
ISCED 3 6% 2,706 16% 2,534 21% 2,706
ISCED 4 6% 771 14% 727 19% 771
Table A1: (Continued)
Non-contact Non-cooperation Overall dropout
N N N
Total 7% 4,996 16% 4,644 22% 4,996
Employment status at wave 1
Employed 6% 3,324 16% 3,113 21% 3,109
Self-employed 8% 341 13% 315 20% 314
Unemployed 12% 229 20% 201 30% 201
Student 11% 426 13% 378 23% 378
Retired 16% 25 10% 21 24% 21
Parental leave 4% 334 17% 322 20% 322
Permanently ill 13% 16 29% 14 38% 14
Housekeeping 6% 213 15% 200 20% 200
Civil service 3% 32 16% 31 19% 31
Other 13% 56 20% 49 30% 49
Parity
Childless 9% 2,273 16% 2,071 24% 2,273
1 child 7% 929 18% 863 23% 929
2 children 5% 1,228 15% 1,171 19% 1,228
3+ children 5% 566 13% 539 17% 566
Marital status
Married 5% 2,179 13% 2,082 17% 2,179
Divorced 9% 303 20% 276 27% 303
Widowed 11% 18 6% 16 17% 18
Single 9% 2,496 18% 2,270 25% 2,496
Living arrangement
Child in one’s birth family 7% 884 16% 821 22% 884
Married couple without children 6% 306 12% 288 17% 306
Non-married couple without children 9% 522 18% 477 25% 522
Married couple with children 4% 1,835 14% 1,761 17% 1,835
Non-married couple with children 8% 402 21% 371 27% 402
Single mother 7% 264 21% 246 27% 264
Single father 20% 10 25% 8 40% 10
Living alone 11% 644 18% 573 27% 644
Other (shared accommodation) 23% 129 7% 99 29% 129
Household size
1 person 11% 644 18% 573 27% 644
2 persons 8% 1,013 16% 934 23% 1,013
3 persons 8% 1,164 18% 1,073 24% 1,164
4+ persons 5% 2,175 14% 2,064 18% 2,175
Children with previous partner living in the household
No 7% 4,585 15% 4,261 21% 4,585
Yes 7% 411 20% 383 26% 411
Stepchildren living in the household
No 7% 4,915 16% 4,570 22% 4,915
Yes 9% 81 18% 74 25% 81
Has stepchildren not living in the household
No 7% 4,775 16% 4,439 22% 4,775
Yes 7% 221 17% 205 23% 221
Self-perceived health
Very good 7% 2,826 16% 2,626 22% 2,826
Good or fair 7% 2,101 16% 1,962 22% 2,101
(Very) bad 19% 69 23% 56 38% 69
Providing care
No 6% 4,688 16% 4,354 22% 4,688