http://www.sciencepublishinggroup.com/j/acm doi: 10.11648/j.acm.20180704.15
ISSN: 2328-5605 (Print); ISSN: 2328-5613 (Online)
Performance Evaluation of Machine Learning Methods for
Breast Cancer Prediction
Yixuan Li
1, Zixuan Chen
2, *1
School of Mathematics and Statistics, University of Sheffield, Sheffield, UK
2School of Information, Zhejiang University of Finance and Economics, Hangzhou, China
Email address:
*
Corresponding author.
To cite this article:
Yixuan Li, Zixuan Chen. Performance Evaluation of Machine Learning Methods for Breast Cancer Prediction. Applied and Computational Mathematics. Vol. 7, No. 4, 2018, pp. 212-216. doi: 10.11648/j.acm.20180704.15
Received: September 14, 2018; Accepted: October 16, 2018; Published: October 18, 2018
Abstract:
Breast cancer is the most common invasive cancer in women and the second main cause of cancer death in females, which can be classified Benign or Malignant. Research and prevention on breast cancer have attracted more concern of researchers in recent years. On the other hand, the development of data mining methods provides an effective way to extract more useful information from complex database, and some prediction, classification and clustering can be made according to extracted information. In this study, to explore the relationship between breast cancer and some attributes so that the death probability of breast cancer can be reduced, five different classification models including Decision Tree (DT), Random Forest (RF), Support Vector Machine (SVM), Neural Network (NN) and Logistics Regression (LR) are used for the classification of two different datasets related to breast cancer: Breast Cancer Coimbra Dataset (BCCD) and Wisconsin Breast Cancer Database (WBCD). Three indicators including prediction accuracy values, F-measure metric and AUC values are used to compare the performance of these five classification models. comparative experiment analysis shows that random forest model can achieve better performance and adaptation than other four methods. Therefore, the model of this study is approved to possess clinical and referential values in practical applications.Keywords:
Data Mining, Breast Cancer, Classification Models, Prediction1. Introduction
Breast cancer is a horrific disease for women all over the world, which brings both physical and psychological damage. It also affects great amounts of women. In 2017, around 252710 new diagnoses of breast cancer were expected in women, and around 40610 women almost died from the disease [1]. Breast cancer can be divided into benign and malignant. According to the judgment of breast cancer, experts and doctors will make different treatment projects for therapy. If there happens misdiagnoses, it will lead improper treatments and let people lose the best time for curing, which will lead dreadful results. Therefore, the selection of model for predicting the nature of breast tumor is significantly important.
This study chooses five different classification models for classifying the nature of breast tumor for female patients,
The remainder of this paper is organized as follows. A related work about data mining and the application in breast cancer are presented in Section 2. In Section 3, we provide the description of the data, the process of data preprocessing and the modeling method employed in this study. Section 4 gives a detailed evaluation of comparative experiments based on prediction accuracy, F-measure metric and receiver operating characteristic curve (ROC curve). In the last Section, we conclude this paper and present potential future works.
2. Related Work
Data mining generally refers to the process of searching hidden information from a large amount of data through algorithms. In recent years, data mining has attracted great attention from the information industry. The main reason is that there exists mass of data, which can be widely used, and there is an urgent need to transform these data into useful information and knowledge. The information and knowledge acquired can be widely used in a variety of applications, including business management, production control, market analysis, engineering design and scientific exploration. This study is focused on the breast cancer, from the area of clinical medicine. Breast cancer is the most common invasive cancer in women, and worth catching the attention of doctors and experts. They diagnose whether patients have breast cancer by judging the nature of the cancer (benign/malignant). Many scientists denote themselves to develop appropriate approaches as to the better accuracy, therefore, a great variety of classical statistic methods, data mining models and optimization algorithms are applied into medical study and help them predict the illness. For instance, Chaurasiaet et al. [4] employed the Naive Bayes, Radial Basis Function Network and Decision Tree to develop the prediction models for breast cancer survivability. Cakir and Demirel [5] developed a new software called “Treatment Assistant” which combine D-class Lifeboat (IB1), Multilayer Perception and Decision Table, in order to give better determination of breast cancer treatment methods. Takadaet et al. [6] used alternating decision trees to develop a novel computational technique for predicting the pathological complete response to neoadjuvant chemotherapy in primary breast cancer patients.
This study used five different classification models for prediction: DT, RF, SVM, NN and LR. DT is a prediction model which represents the mapping between object attributes and object values. Liu et al. [7] focus on designing differentially private decision tree and its ensemble counterpart to perform the classification task. The goal is to guarantee highly accurate and stable performance of the classification task. RF is operated by constructing a multitude of decision trees at training time and outputting the class that is the mode of the classes or mean prediction of individual trees. It also corrects the habit of overfitting to their training set from decision tree. There are some remarkable instances of using RF for prediction, as improving environmental planning-scale wetland identification [8], intensively managed reclamation zone of eastern China [9], risk
prediction in a wide variety of medical fields [10], and so on. NN is traditionally used to refer to a network or circuit of neuros. Clark [11] took some examples of models streamlined for collective computation, NN in theoretical neurobiology and synthetic NN in details. LR is a kind of generalized linear model which is taken to apply to a binary dependent variable. Suthar et al. [12] used LR model to examine students’ mathematical beliefs and also found relationships between students’ beliefs on mathematics and achievement of university students. After that, this study makes a comparison of predicting accuracy about the nature of breast tumor for female patients among two different datasets, between RF and other data mining models.
3. Data Preprocessing and Modeling
Method
This section introduces the datasets which are implemented in this paper, the preprocessing of our data, and variety of classification models leveraged for the prediction of female breast tumor.
3.1. The Source of the Dataset
All the models introduced in this study are verified on two datasets, which are separately from BCCD and WBCD. The BCCD data is composed of 116 instances, reported by March 6th, 2018, with 10 attributes for each case. The independent attributes are: age, BMI, glucose, insulin, HOMA, leptin, adiponectin, resist in and MCP.1, all of which are anthropometric data and parameters. The dependent attribute is classification, which is presented by integer 1 and 2, where 1 stands for healthy controls and 2 stands for patients.
The WBCD data involves 699 instances, reported by July 15th, 1992. This dataset contains sample code number and 10 attributes for each case. The independent attributes are Clump Thickness, Uniformity of Cell Size, Uniformity of Cell Shape, Marginal Adhesion, Single Epithelial Cell Size, Bare Nuclei, Bland Chromatin, Normal Nucleoli and Mitoses. All of them are represented by the integer in the range of 1 to 10. The dependent attribute is class, which presented by integer 2 and 4, where 2 stands for benign and 4 stands for malignant.
3.2. Data Preprocessing
There are 16 instances in the WBCD dataset which contains a single missing attribute value and may also make negative influence to the end result of the experiment. Therefore, this study excludes these data and reduced the dataset to the 683 instances.
The first column of the WBCD dataset is sample code number, which is nothing to do with the final results. Then we use function “data3 = data2[,-1]” of the R programming language to delete it.
3.3. Modelling Method
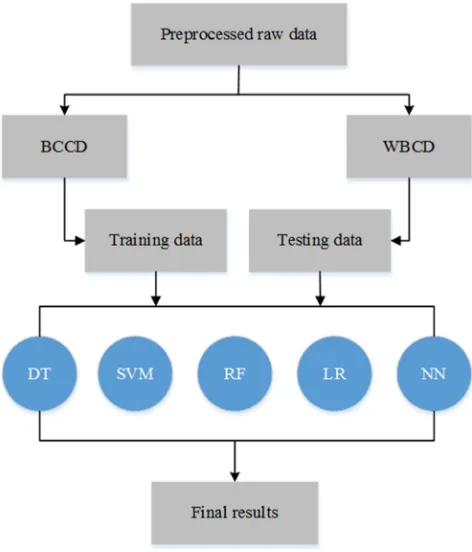
respectively are DT, SVM, RF, LR and NN. The goal of this study is to choose the model with the highest prediction accuracy as the primary model. Figure 1 presents the process of the proposed model.
This study firstly employs RF to build the classification model to predict the class of breast tumor for female patients (Benign/Malignant). Both of two breast cancer datasets are split randomly into two separate subsets according to the ratio of 7 to 3 (70% as the training data and 30% as the test data). For one thing, the training data is applied to train the classification model by setting the parameters of RF in order to better fit the model. For another, the test data is applied to test the predictability of the trained model through RF. Moreover, the study validates the efficiency of this classification model. After obtaining the result of prediction accuracy, the study compares RF with other machine learning models, such as DT, SVM, LR and NN. The experimental results illustrate that RF has the best performance on classification accuracy in comparison with other four models.
Figure 1. Process of the proposed model.
4. Experimental Results
This section focuses on the evaluation of comparative experiment based on five classification models, whose performances of over two breast cancer datasets will also be presented.
The study applies five classification models to analyze the database, which are DT, SVM, RF, LR and NN. This study combines both accuracy and F measure metric as the index for choosing the primary analytic model. Accuracy emphasizes on the performance of the classifier and it calculates the proportion that true positive items occupy among the sum of
true positive items and false positive items. The score of F-measure metric is the harmonic average of the precision and recall.
The metrics used in this section include:
Accuracy TN TP
FN FP TN TP
F measure metric 2 ∗ Precsion ∗ Recall
Precision Recall
Precision TP
FP TP
Recall TP
FN TP
The higher F-measure signifies the higher efficiency of the models, where 1 is the best value of F-measure while 0 is the worst. The F-measure metric values and the prediction accuracy of BCCD data are shown in Figure 2 and Table 1 below. Figure 2 is a histogram which is used to compare the accuracy and F-measure metric directly of five different models in BCCD dataset. Its detailed information of accuracy and F-measure metric are shown in Table 1. Additionally, both indexes of accuracy and F-measure metric for WBCD dataset are shown in Figure 3 and Table 2. According to the results of the experiments, RF obtains the highest accuracy and F-measure in two datasets, which indicates its superiority to other methods. Therefore, we choose RF as the primary analytic model.
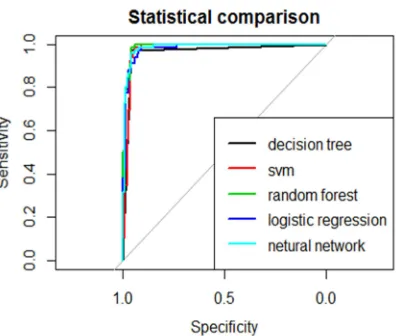
For the purpose of verifying the performance of ensemble, the study performs prediction on different randomly split training and testing data 50 times. After that, the ROC curve of each classification models in one graph are drawn as to obtain the conclusion intuitively. The ROC curve of BCCD data and WBCD are shown in Figure 4 and Figure 5 respectively. The ROC curve takes the specificity (the percentage of right classification on negative class) as x-axis and sensitivity (the percentage of correct classification on positive class) as y-axis. Additionally, the AUC (area under the ROC curve) describe the probability when the prediction of true positive instance is higher than the true negative instance. They are shown in Table 3 and Table 4 respectively.
Figure 3. The accuracy and F-measure metric of five classification models for WBCD data.
Table 1. The detailed information about accuracy and F-measure metrics of five classification models for BCCD data.
Classification model DT SVM RF LR NN
Accuracy 0.686 0.714 0.743 0.657 0.600
F-measure metric 0.717 0.762 0.780 0.616 0.570
Table 2. The detailed information about accuracy and F-measure metrics of five classification models for WBCD data.
Classification model DT SVM RF LR NN
Accuracy 0.961 0.951 0.961 0.937 0.956
F-measure metric 0.941 0.934 0.955 0.938 0.945
Figure 4. Whole ROC curves for BCCD data.
Figure 5. Whole ROC curves for WBCD data.
Table 3. AUC value of BCCD data.
Classification model DT SVM RF LR NN
AUC 0.683 0.763 0.785 0.737 0.748
Table 4. AUC value of WBCD data.
Classification model DT SVM RF LR NN
AUC 0.963 0.977 0.989 0.981 0.985
On the basis of data shown in the AUC form, all of them are greater than 0.5 and less than 1. It means using these models for prediction is better than random prediction. Combining those two tables, the AUC value of RF is greater than other AUC values of rest four classification models. The higher AUC value is, the higher accuracy rates of classifier are. Therefore, RF is the most suitable models for prediction on those two datasets.
5. Conclusion
In this study, the method of DT, SVM, RF, LR and NN models are employed as the classification to predict the nature of breast cancer with other attributes. The results of prediction will help to decrease the rate of misdiagnoses and make the suitable treatment projects for therapy. There are two datasets used in this study. This study firstly collects the raw data of the BCCD dataset which contains 116 volunteers with 9 attributes and raw data of WBCD dataset which contains 699 volunteers and 11 attributes. Then we preprocesses the raw data of WBCD dataset and obtained the data that contains 683 volunteers with 9 attributes and the index indicating whether the volunteer has the malignant tumor. After comparing the accuracy, F-measure metric and ROC curve of five classification models, the result has shown that RF is selected as the primary classification model in this study. Therefore, the results of this study provide a reference for experts to distinguish the nature of breast cancer.
Currently, the factors of malignant breast cancer become more and more complex. In this study, there are still some limitations that should be solved in further work. For example, though there also exist some indices people have not found yet, this study only collects the data of 10 attributes in this experiment. The limited raw data has an effect on the accuracy of results. In addition, the RF also can be combined with other data mining technologies to obtain more accurate and efficient results in the future work.
References
[1] Harbeck, N. & Gnant, M. (2017). Breast cancer. The Lancet, 389, 1134-1150.
[2] Wass, J. (2007). The R language. Scientific Computing, 24, 40-41.
[4] Chaurasia, V., Pal, S., & Tiwari, B. B. (2018). Prediction of benign and malignant breast cancer using data mining techniques. Journal of Algorithms & Computational Technology, 12(2), 119-126.
[5] Cakir, A. & Demirel, B. (2011). A software tool for determination of breast cancer treatment methods using data mining approach. Journal of Medical Systems, 35(6), 1503-1511.
[6] Takada, M., Sugimoto, M., & Ohno, S. et al. (2012). Prediction of the pathological response to neoadjuvant chemotherapy in patients with primary breast cancer using a data mining technique. Breast Cancer Research and Treatment, 134(2), 661-670.
[7] Liu, X. Q., Li, Q. M., & Li, T. (2017). Differentially private classification with decision tree ensemble. Applied Soft Computing, 62, 807-816.
[8] O’Neil, G. L., Goodhall, J. L., & Watson, L. T. (2018). Evaluating the potential for site-specific modification of LiDAR DEM derivatives to improve environmental
planning-scale wetland identification using random forest classification. Journal of Hydrology, 559, 192-208.
[9] Zhang, H., Gao, C., & Zhang, M. (2017). Prediction of soil organic carbon in an intensively managed reclamation zone of eastern China: a comparison of multiple linear regressions and the random forest model. Science of the Total Environment, 592, 704-713.
[10] Li, L., Paxton, E. W., & Fan, J. (2017). Predicting risk for adverse health events using random forest. Journal of Applied Statistics, 45(12), 2279-2294.
[11] Clark, J. W. (1991). Neural network modeling. Physics in Medicine & Biology, 36, 1259-1317.