VOLUME 37, ARTICLE 11, PAGES 295
,
324
PUBLISHED 10 AUGUST 2017
http://www.demographic-research.org/Volumes/Vol37/11/ DOI: 10.4054/DemRes.2017.37.11
Descriptive Finding
Evolution of the shape of the fertility curve:
Why might some countries develop a bimodal
curve?
Marion Burkimsher
© 2017 Marion Burkimsher.
This open-access work is published under the terms of the Creative Commons Attribution NonCommercial License 2.0 Germany, which permits use, reproduction, and distribution in any medium for noncommercial purposes, provided the original author(s) and source are given credit.
2 Literature overview 296
3 Data 297
4 First-birth fertility rates 297
5 Second-birth fertility rates 305
6 Possible causes 313
6.1 Impact of the fall of communism 313
6.2 Impact of immigration 314
7 The Netherlands and the United States: Special cases 318
8 Outstanding questions 320
9 Acknowledgements 321
http://www.demographic-research.org 295
Evolution of the shape of the fertility curve:
Why might some countries develop a bimodal curve?
Marion Burkimsher1
Abstract
BACKGROUND
Few previous studies have compared how the shape of the fertility curve has evolved in different countries. This study remedies this lack by investigating first- and second-birth fertility curves for 22 highly developed countries.
METHODS
Using age-specific fertility rate data for first and second births held in the Human Fertility Database, line graphs and contour plots were drawn to illustrate the evolution of the fertility curves of the 1968 to 1980 cohorts of women. Additional period data for the Netherlands and the United States was also used to investigate the more unusual scenarios of these two countries. For Switzerland, the fertility curves for Swiss national and foreign women were investigated.
RESULTS
For some countries the transition from an early to a late fertility schedule goes through a phase when the first birth fertility curve is bimodal. In other countries a premodal ‘shoulder’ is apparent.
CONCLUSIONS
The existence of a bimodal fertility curve suggests the polarisation of women into one group that remains longer with an early fertility schedule and a second group that moves more rapidly on to a later schedule. For most countries this seems to be a transitional phase. Evidence of foreigner fertility contributing to an early bulge in the fertility curve is demonstrated for Switzerland, suggesting it could be common in other developed countries with high rates of immigration.
CONTRIBUTION
This examination of the trends in the shape of the fertility curves for 22 countries reveals several contrasting progressions, which hopefully will prompt further investigation as to their cause.
1
1. Introduction
The fertility curve, a plot of birth rate by age for women through their reproductive life, is usually bell-shaped, with a single mode. Across the developed world, the curve for first births has evolved from being left-skewed to being more symmetrical as women enter into motherhood later (Frejka and Sardon 2006). In parallel, the fertility curve has been getting wider as the variability of the age of entry into motherhood has increased, causing the TFR to rebound in recent years (Burkimsher 2015). However, the evolution in the shape of the fertility curve has rarely been investigated. This descriptive paper compares the development of cohort fertility curves of 22 countries to identify common trends and pinpoint outliers. We suggest several potential causative mechanisms. The unresolved question from this work is whether the development of a bimodal curve is a normal process or whether it is a symptom of polarisation in a society. The data presented here provides a base from which, with supplementary resources, that question may be answered.
2. Literature overview
Previous investigations of bimodal fertility curves have been patchy. Some apply mathematical models to describe these complex curves; e.g., Peristera and Kostaki (2007), Mazzuco and Scarpa (2011), Bermúdez et al. (2012). Other work is more empirically focused, investigating the following countries: the United Kingdom, Ireland, New Zealand, Australia, and the United States (Chandola and Coleman 2002); the Netherlands (Coleman and Garssen 2002); the United States (Sullivan 2005); South Africa (Garenne et al. 2001); Chile and Uruguay (Lima et al. 2015).
http://www.demographic-research.org 297
3. Data
The data used in this analysis is from the Human Fertility Database (http://www.humanfertility.org). We present the data for age-specific fertility rates for first- and second-order births. At the present time, 21 countries have biological birth order data in the HFD that covers a sufficiently long time span to study trends. In addition, for Switzerland, we use the data in the Human Fertility Collection (see Burkimsher 2011).
One important decision was whether to study period or cohort fertility curves. In previous studies the development of the pre-mode bulge was noticed when studying period data. However, examination of cohort curves reveals that the development of the early ‘shoulder’ is even more pronounced if examined from a cohort perspective. For the special cases of the Netherlands and United States, discussed in greater detail in section 7, we look not only at cohort rates but also at period age-specific fertility rates from the 1950s onwards and hazard rates for the 1940s and subsequent cohorts.
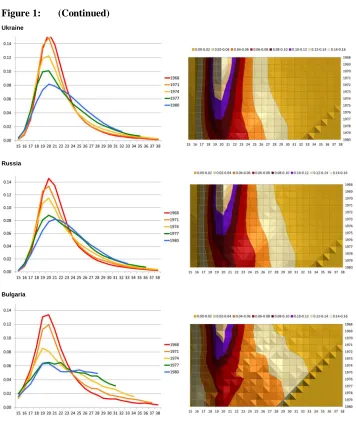
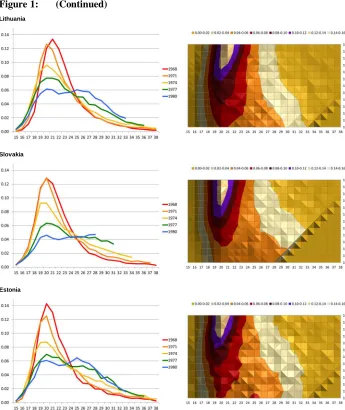
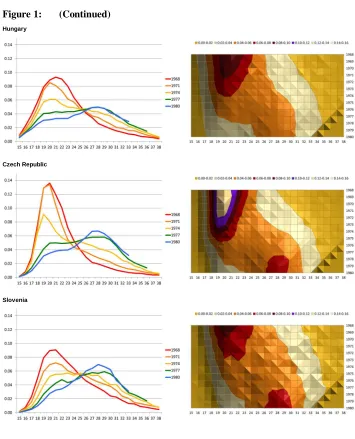
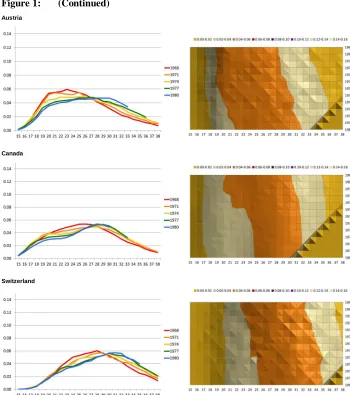
4. First-birth fertility rates
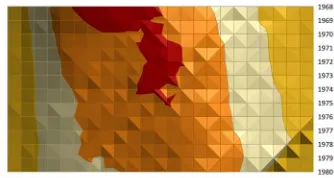
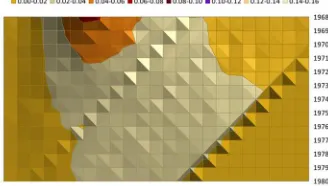
The results are presented in graph form for each country (Figure 1). The line graphs are the fertility curves for cohorts born in 1968, 1971, 1974, 1977, and 1980. In addition to a line graph for each country there is also a contour plot illustrating how the early peak migrates rightwards (later).
Figure 1: (Continued) Ukraine
Russia
http://www.demographic-research.org 299
Figure 1: (Continued) Lithuania
Slovakia
Figure 1: (Continued) Hungary
Czech Republic
http://www.demographic-research.org 301
Figure 1: (Continued) Sweden
Finland
Figure 1: (Continued) Austria
Canada
http://www.demographic-research.org 303
Figure 1: (Continued) Portugal
Taiwan
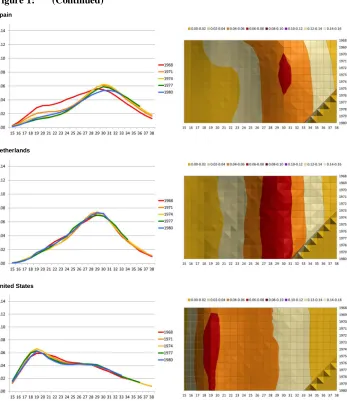
Figure 1: (Continued) Spain
Netherlands
United States
http://www.demographic-research.org 305
rates across a wide range of ages. Finally, for some countries and some cohorts a well-defined double peak is seen.
The ordering of the country plots is intentional. We propose that each country is at a different point on the trajectory from early to late fertility schedules: The evolution of the shape of the curve gives an indication of what stage the country is at.
We start with countries that are still at the stage of an intense early fertility peak for first births: Belarus, Ukraine, and Russia. However, each of these shows signs of the peak declining and starting to migrate later, with a postmodal ‘shoulder’ developing.
Following these are countries where the early peak, in the process of transitioning to a later peak, passes through a phase of bimodality (Bulgaria to Sweden): This is the stage when the early mode has declined in intensity but the later mode is only starting to develop. For Bulgaria the early peak is still higher than the later peak, Estonia has almost equal peaks, and Hungary through to Sweden have established a later, higher peak. A ‘crossover point’ at ages 24–26 is clearly visible in the line graphs: This is the age with the most stability in fertility rates across cohorts. It is noteworthy that all the countries from Belarus through to Slovenia are in Eastern Europe and the early peak for age at first birth was (and in some cases still is) at ages 20–21.
The following countries (Finland to Spain) have seen relatively steady transitions to a later fertility schedule. However, the development of an early ‘shoulder’ can be seen in the later cohorts, caused by significant falls in fertility rates for women in their mid-20s. For some countries there was a slight fall in peak rates after the 1968 cohort, followed by a subsequent modest rise to the 1980 cohort. Spain, however, follows the reverse pattern. In Austria, Portugal, Taiwan, and Japan there has been a steady fall in peak rates across the cohorts in tandem with the transition to a later schedule.
Finally, we have the Netherlands and the United States, which are dramatically different from the other countries in that they show no significant trends or change in shape of their fertility curves across the cohorts born 1968–1980. In section 7 we look more closely at these two countries.
5. Second-birth fertility rates
Figure 2: Line graphs and contour plots of the ASFR2 cohort fertility curves Belarus
Ukraine
http://www.demographic-research.org 307
Figure 2: (Continued) Bulgaria
Lithuania
Figure 2: (Continued) Estonia
Hungary
http://www.demographic-research.org 309
Figure 2: (Continued) Slovenia
Sweden
Figure 2: (Continued) Norway
Austria
http://www.demographic-research.org 311
Figure 2: (Continued) Switzerland
Portugal
Figure 2: (Continued) Japan
Spain
http://www.demographic-research.org 313
Figure 2: (Continued) United States
It would appear that for almost all countries except the United States, the modal age of second birth is moving towards the narrow age range of 28–32. This is the case even for countries where the modal age of first birth remains quite low. For example, in Russia the modal age of first birth for the 1980 cohort is 21; however, for this same cohort the modal age for a second birth is 29.
Comparing Figures 1 and 2 shows that the transition from an early mode to a later mode is much smoother for second births than for first. The fall in peak rates progresses in tandem with an increase in the width of the fertility curve and the new, later, schedule of timing of second birth steadily establishes itself. There is not the same apparent split into two subpopulations as seen in the case of the first-birth schedule transition.
6. Possible causes
As discussed in the literature overview (section 2), the usual explanation of a bimodal distribution is the coexistence of two subpopulations which are following different norms. However, we now briefly examine two other potential causes.
6.1 Impact of the fall of communism
the following years, together with the progressive opening up of those societies to western norms and the increasing availability of modern contraceptives, had a profound impact, especially on young adults (Frejka 2008). The TFR1 fell precipitously in the 1990s before hitting minimum levels in the period 1996–2002 (Burkimsher 2015; Frejka 2008; Frejka and Gietel-Basten 2016). There was then a modest recovery in period fertility rates, driven primarily by women who had postponed their entry into motherhood during the 1990s. What we are probably observing in the cohort fertility curves of Eastern European countries is the outcome of this transition: One segment of women postponed their first birth awaiting an improved economic climate, whilst another group retained the tradition of young age at first birth. Over successive cohorts the proportion of older first-time mothers increased and the share of young mothers declined. The bimodal pattern suggests that there were two subpopulations coexisting at one time, but this generally seems to have been a temporary phase before older childbearing took over as the norm.
6.2 Impact of immigration
http://www.demographic-research.org 315
Figure 3a: Switzerland: period fertility rates, ASFR1, of the Swiss, foreign, and combined populations
Swiss nationals
Foreign nationals
Combined Swiss and foreign population
0.00 0.02 0.04 0.06 0.08 0.10 0.12 0.14
15 16 17 18 19 20 21 22 23 24 25 26 27 28 29 30 31 32 33 34 35 36 37 38 2000 2007 2014 0.00 0.02 0.04 0.06 0.08 0.10 0.12 0.14
15 16 17 18 19 20 21 22 23 24 25 26 27 28 29 30 31 32 33 34 35 36 37 38 2000 2007 2014 0.00 0.02 0.04 0.06 0.08 0.10 0.12 0.14
Figure 3b: Switzerland: period fertility rates, ASFR2, of the Swiss, foreign, and combined populations
Swiss nationals
Foreign nationals
Combined Swiss and foreign population
0.00 0.02 0.04 0.06 0.08 0.10 0.12 0.14
15 16 17 18 19 20 21 22 23 24 25 26 27 28 29 30 31 32 33 34 35 36 37 38 2000 2007 2014 0.00 0.02 0.04 0.06 0.08 0.10 0.12 0.14
15 16 17 18 19 20 21 22 23 24 25 26 27 28 29 30 31 32 33 34 35 36 37 38 2000 2007 2014 0.00 0.02 0.04 0.06 0.08 0.10 0.12 0.14
http://www.demographic-research.org 317
Figure 3c: Graph of ASFR1 of Swiss and foreign populations in 2014 and the modified ASFR1 curve using the maximum foreign population (age 33 in 2014)
However, immigrant fertility rates are distorted, as explained by Parrado (2011), Dubuc (2012), Robards and Berrington (2016), and Burkimsher, Rossier, and Wanner (unpublished). Sometimes the TFR1 exceeds unity – a logical impossibility in cohort terms as childlessness cannot be less than zero. The TFR of migrants is biased upwards because migrants, who are observed in their country of arrival only after their migration, are not included in the denominator of the fertility rate during the years preceding their migration when they are typically childless. This distorts the fertility curves of a migrant population, as described by Burkimsher, Rossier, and Wanner (unpublished). In that paper they outline a simple method for removing the distortion by using the maximum foreign population as denominator in the ASFR calculation. With this ‘correction’ applied, the bimodal shape disappears (Figure 3c). To briefly conclude, the bimodality in the ASFR1 curves of a migrant population is not due to the polarisation of the behaviour of two subgroups but is caused by the changing denominator (the rapidly expanding population of women in their 20s) in the ASFR1 calculation.
Emigration could also impact the fertility curves of countries where there is a net outflow of young women. As they leave their home country, commonly in their 20s and childless, they will cause a dip in the population denominator. This could be a contributory cause of the bimodal fertility curves in the Eastern European countries where there have been strong emigration flows.
0.0000 0.0100 0.0200 0.0300 0.0400 0.0500 0.0600 0.0700
15 17 19 21 23 25 27 29 31 33 35 37 39 41 43 45 47 49
AS
FR
1
7. The Netherlands and the United States: Special cases
Because the Netherlands and the United States are so very different from all the other countries and also from each other, and yet both exhibit stable patterns for the cohorts 1968–1980, we decided to look at a much broader span of cohorts for them, 1932–1992 (Figure 4a). In addition, we also looked at the plots for hazard rates, considering only those women ‘at risk’ of a first birth (Figure 4b). Finally, we also compared their period ASFR1 graphs for 1952/1953–2012/2013 (Figure 4c).
Over the past sixty years the Netherlands has experienced a smooth transition towards later entry into motherhood. The early peak rate of the 1932 cohort declined but the modal age at 29–30 has been established since 2000 with the passing through of the 1972 cohort (Figure 4a). The development of a minor early ‘shoulder,’ noted by Coleman and Garssen (2002), can be seen in the 1972 and 1982 cohort curves and the 1992 and 2002 period curves. However, it is very modest and disappeared subsequently.
http://www.demographic-research.org 319
Figure 4b: Hazard rates of first birth for specified cohorts considering only those ‘at risk’
Netherlands hazard rates United States hazard rates
Figure 4c: Period age-specific fertility rates considering whole population Netherlands cohort ASFR1 United States cohort ASFR1
States went through from 1973–1975, a process similar to that which the Eastern European countries experienced post-1989. However, unlike the trends seen in the former communist countries, in the United States the bimodal pattern has become ever more accentuated since the 1970s. Although teenage fertility rates in the United States have declined significantly (Lindberg, Santelli, and Desai 2016), the early mode is still evident, with a dip in hazard rates for women around age 23. Is this evidence of the polarization of American society along racial, regional, educational, and socioeconomic fault lines? Or is it another example of the demographic distortion caused by the ongoing influx of childless migrants in their 20s to the country, as described in the previous section? Or could both factors contribute? We are not aware of any data sources currently available that could resolve this question.
8. Outstanding questions
Analysis of the evolution of the shape of the fertility curves has rarely been tackled. The empirical data presented here is intended to stimulate further investigation into the causes. The differential diffusion of later childbearing norms after the fall of communism may explain the pattern seen in the Eastern European countries. But why was the fertility curve ever smoothly monomodal? Why did it start to then split into two subpopulations, with the trendsetters moving to a later fertility schedule and those left behind ‘stuck,’ at least temporarily, in the traditional norm?
The impact of immigration and the associated distortion of fertility indicators may be more applicable to the western countries, but this requires confirmation with appropriate data.
Another question is whether these divisions will subside or continue. For the Eastern Europe countries the indications are that the situation is temporary, whilst in the United States the division seems persistent. Is this because of entrenched polarisation or does it stem from large and continuing migrant inflows?
http://www.demographic-research.org 321
9. Acknowledgements
Most of the data used in this study comes from the Human Fertility Database, a joint project of the Max Planck Institute for Demographic Research (Germany) and Vienna Institute of Demography (Austria). The database is available at
www.humanfertility.org. The main data for producing Figures 1 and 2 is the version of 27/03/2017 and file name is asfrVHbo (ASFR1 and ASFR2). In addition, Figure 4b uses the hazard rates (m1x in file cft, ftables) and Figure 4c the period fertility rates (asfrRRbo).
Data on births by citizenship (Swiss/foreign) and population by age, were supplied by the Swiss Federal Statistical Office.
References
Bermúdez, S., Blanquero, R., Hernández, J.A., and Planelles, J. (2012). A new parametric model for fitting fertility curves.Population Studies 66(3): 297–310.
doi:10.1080/00324728.2012.695802.
Bongaarts, J. and Sobotka, T. (2012). A demographic explanation for the recent rise in European fertility. Population and Development Review 38(1): 83–120.
doi:10.1111/j.1728-4457.2012.00473.x.
Burkimsher, M. (2011). Modelling biological birth order and comparison with census parity data in Switzerland: A report to complement the Swiss data in the Human Fertility Collection (HFC). Rostock: Max Planck Institute for Demographic Research (MPIDR Technical Report TR-2011-005).
Burkimsher, M. (2015). Europe-wide fertility trends since the 1990s: Turning the corner from declining first birth rates. Demographic Research 32(21): 621–656.
doi:10.4054/DemRes.2015.32.21.
Burkimsher, M., Rossier, C., and Wanner, P. (unpublished). Comparing the fertility of immigrants with native Swiss: Measurement challenges faced by demographers; contrasting challenges for family formation for native Swiss and immigrants.
Chandola, T. and Coleman, D.A. (2002). Heterogeneous fertility patterns in the English-speaking world: Results from Australia, Canada, New Zealand and the United States. Population Studies 56(2): 181–200. doi:10.1080/ 00324720215929.
Coleman, D.A. and Garssen, J. (2002). The Netherlands: Paradigm or exception in Western Europe’s demography? Demographic Research 7(12): 433–468.
doi:10.4054/DemRes.2002.7.12.
Dubuc, S. (2012). Immigration to the UK from high-fertility countries: Intergenerational adaptation and fertility convergence. Population and Development Review38(2): 353‒368.doi:10.1111/j.1728-4457.2012.00496.x.
Frejka, T. (2008). Determinants of family formation and childbearing during the societal transition in Central and Eastern Europe.Demographic Research 19(7): 139–170 (Special Collection 7: Childbearing Trends and Policies in Europe).
doi:10.4054/DemRes.2008.19.7.
http://www.demographic-research.org 323
Frejka, T. and Sardon, J.P. (2006). Childbearing trends and prospects in low-fertility countries: A cohort analysis. Dordrecht: Springer Netherlands.
Garenne, M., Tollman, S., Kahn, K., Collins, T., and Ngwenya, S. (2001). Understanding marital and premarital fertility in rural South Africa. Journal of Southern African Studies 27(2): 277–290.doi:10.1080/03057070125205.
Lima, E.E.C., Zeman, K., Castro, R., Nathan, M., and Sobotka, T. (2015). Bi-modal age-specific fertility profiles in Latin America: The case of Chile and Uruguay. Paper presented at the Annual meeting of the Population Association of America, San Diego, April 30–May 2, 2015.
Lindberg, L., Santelli, J., and Desai, S. (2016). Understanding the decline in adolescent fertility in the United States, 2007–2012. Journal of Adolescent Health 59(5): 577–583.doi:10.1016/j.jadohealth.2016.06.024.
Mazzuco, S., and Scarpa, B. (2011). Fitting age-specific fertility rates by a skew-symmetric probability density function. Padua: Department of Statistical Sciences, University of Padua (Working paper 10).
Parrado, E.A. (2011). How high is Hispanic/Mexican fertility in the United States? Immigration and tempo considerations. Demography 48(3): 1059–1080.
doi:10.1007/s13524-011-0045-0.
Peristera, P. and Kostaki, A. (2007). Modeling fertility in modern populations.
Demographic Research 16(6): 141–194.doi:10.4054/DemRes.2007.16.6.
Robards, J. and Berrington, A. (2016). The fertility of recent migrants to England and Wales. Demographic Research 34(36): 1037–1052. doi:10.4054/DemRes. 2016.34.36.