ISSN 0975-928X
Research Article
Exploiting legume EST databases for the development of gene-derived
SSR-markers in medicinal legume
Mucuna pruriens
L. (DC.)
Prateek Shetty1, Shruthi Sharma2and N Sathyanarayana3**
1
Dept. of Plant Biology, University of Michigan, USA 2
Dept. of Biotechnology, Sir M Visvesvaraya Institute of Technology, Bangalore, India. 3
Dept. of Botany, Sikkim University, Gangtok, India.
(Received: 21st May 2015; Accepted: 11th Sep 2015)
Abstract
This paper reports method for the development of microsatellite markers in Mucuna pruriens from a deluge of EST sequence data of related legume species available in public database. Totally, 2,86,488 EST sequences from four legume species viz., Vigna unguiculata, Glycine max, Phaseolus vulgaris and Cicer arietinum generated 22,457 SSRs comprising of 29.08% di-, 46.41% tri-, 7.29% tetra-, and 17.22% penta-nucleotide repeats. Based on 22,457 SSR containing sequences, 522 primer combinations were designed and 50 were screened against a diverse panel of 25 genotypes, of which 3 produced polymorphic profiles with an average PIC of 0.65. The work demonstrates low cost method for microsatellite development in resource poor medicinal plants and is first such report on sequence based marker development in M. pruriens.
Key words
EST- SSR, M. pruriens, orthologues, MISA, gene ontology. Introduction
Mucuna pruriens L. (DC.) described as a self-pollinated species is a tropical legume classified within the phaseoloid clade of Leguminosae which also include soybean, common bean, mung bean and relatives. Reported to be native of Eastern India and Southern China (Wilmot Dear, 1987), it is now distributed in several parts of the World including tropics exhibiting tremendous diversity of morphological forms and biochemical variants. The plant commands rich history in Ayurvedic system of Indian medicine where it is used as an integral part of over 200 drug formulations (Oudhia, 2002). It is reported to possess anti-diabetic, anti-neoplastic, anti-microbial, aphrodisiac, learning and memory enhancing properties (Oudhia, 2002). Importantly, its efficacy in the treatment of Parkinson’s disease is well recognized both in alternative and allopathic system of medicine. When used as drug, L-Dopa, which is copiously present in its seeds acts as a precursor for the synthesis of neurotransmitter drug dopamine, thus balancing its deficiency in the brain cells of Parkinson’s patients (Farooqi et al. 1999; Kavitha and Thangamani, 2014). More recently it is also shown to promote male fertility in rats by recovering spermatogenic losses (Singh et al., 2013). Besides medicinal properties, M. pruriens also fixes nitrogen and is a well-known green manure cover crop (Bressani et al., 2002). It possesses high seed protein content and distinct nutritional benefits thus offering a promising candidate to bridge the gap between increasing demand for high protein and its limiting sources, especially in Asia and Sub-Saharan Africa (Leelambika et al., 2010).
Deployment of molecular markers can propel breeding efforts in resource poor medicinal plants. In M. pruriens, DNA markers such as Randomly Amplified Polymorphic DNA (RAPD) and Amplified Fragment Length Polymorphisms (AFLP) have been used previously for germplasm characterization (Padmesh et al., 2006; Sathyanarayana et al., 2010); genetic diversity analysis (Capo-chichi et al., 2001; and Leelambika et al., 2010) and development of frame-work linkage map (Capo-Chichi et al., 2004). However, owing to widely known limitations of these dominant markers (Jonah et al., 2011), there is a need to develop co-dominant markers particularly SSRs to support the breeding efforts in this speices for L-Dopa and other economic traits. Once developed, they can also be used for taxonomy and evolutionary studies in Mucuna sp.
ISSN 0975-928X
1042
populations or germplasm collections as they arederived from the transcription products (Varshney et al., 2005); and (iv) transferable to other species and can be used for comparative genomics as most are derived from the conserved coding sequences (Guo et al., 2006).
In this background, the present work was aimed to explore potential use of public legume EST databases for the development of gene-derived SSR-markers in medicinal legume Mucuna pruriens L. (DC.). For doing this, we hypothesized that the sequences which shared high percentage of homology between the species are most likely present in M. pruriens; and such sequences were used to generate EST-SSR markers and subsequently assessed for their ability to reveal polymorphism information and genetic diversity estimates.
Materials and methods
Development of sequence resources:Sequence information obtained from four closely related legume species viz. Vigna unguiculata, Glycine max (L.) Merrill, Phaseolus vulgaris L. and Cicer arietinum L. via orthologues were used. The transcriptome sequences of all the species were downloaded from the TIGR plant transcript assemblies (http://plantta.jcvi.org) and TIGR gene
indices (http://compbio.dfci.
harvard.edu/tgi/plant.html). A total of 2,86,488 sequences across all the four species were downloaded and analyzed for the presence of SSRs (Table 1).
In silico SSR screening:Microsatellite detection was done by a modified version of MIcro SAtellite identification tool (MISA) (http://pgrc.ipk-gatersleben.de/misa/misa.html). It allows for identification and localization of perfect as well as compound microsatellites. MISA scripts, in this study, were modified to omit mononucleotide repeats by default; produce output for only those repeats equal to or greater than 15bp; include only SSRs with at least 200bp on either side and compute sequence length and display in an output file.
Identification of orthologues:To identify orthologues among the 22,457 microsatellites obtained, Blastn (Altschul et al., 1990) analysis was performed. The sequences containing SSR information of each species were separated into different files and blasted against each other. The
result was parsed using the
―BlastParser‖(http://geneproject.altervista.org/) to identify sequences that are represented in more than one species (with 85 - 100% homology). The sequences thus obtained were divided into
sequences common between three and two species respectively.
Primer design and in silico validation:The input sequences from 522 orthologues were fed into BatchPrimer3 (Frank et al., 2003) for primer design.The primers thus generated were validated for efficiency by running them along with corresponding sequences in In silico PCR tool available at http://insilico.ehu.es/userseqs allowing only a maximum of two mismatches at 3’ end.
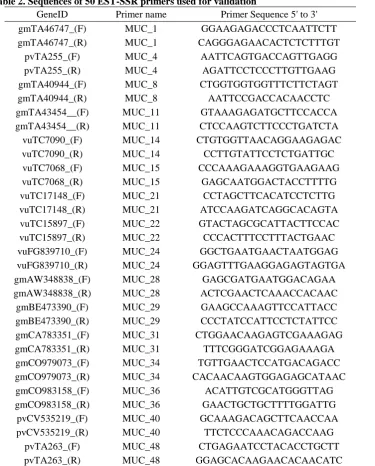
Amplification& SSR validation:From 522 primers, 50 were randomly selected (Table 2) for validation of EST-SSRs based on wet-lab experiments by screening against a panel of 25 diverse genotypes (Table 3). The amplification protocol used was as follows:
The reactions were carried out in 25µl reaction mixture containing 0.3mM dNTP’s, 10mM Tris-HCl, 3mM MgCl2, 50mM KCl, 0.1% Triton
X-100, 1.0U Taq DNA polymerase, 0.2µM forward and reverse primers (all Eurofins Genomics India Pvt. Ltd.) and 50ng of genomic DNA. Amplification was performed in PTC-200 (MJ Research, USA) with an initial denaturation of 94°C for 3min followed by a touch-down cycle profile: 94°C for 30s, 60°C (−0.5°C/cycle) for 30s, and 72°C for 60s during 10 cycles until reaching the optimal annealing temperature of 55°C. At this temperature, 33 more cycles were achieved to complete the amplification. The products were held at 4°C. Reaction mixture in which template DNA was replaced by distilled water was used as negative control. Amplified products were resolved on 3% agarose gel (0.5X TBE) followed by ethidium bromide staining.
Genetic variability and data analysis:Each EST-SSR marker was treated as unit character and scored as a binary code (1/0). The results were analyzed using NTSYS-pc version 2.21c (Rohlf 2009) with SIMQUAL option based on Jaccard’scoefficient to generate similarity coefficients among all the possible pairs and ordered in similarity matrix (Jaccard 1908). The resulting matrices were subjected to clustering method by UPGMA (Sokal and Michener 1958). To find the robustness of the phenogram, bootstrapping was carried out (1000 replicates) with Winboot software (Yap and Nelson 1996). The goodness of fit of the clustering to the data matrix was calculated by the COPH and MXCOMP programs. Expected heterozygosity (He) was calculated as He= 1- ∑Pi2, where Pi is the
frequency of the ith allele. Observed heterozygosity (Ho) was calculated as the number of
heterozygous genotypes divided by the total number of genotypes. Polymorphic information content (PIC) was calculated as PICi= 1− ∑ Pij
2
ISSN 0975-928X
where Pij is the frequency of jth pattern for marker
i and summation extends over n patterns (Anderson et al., 1993).
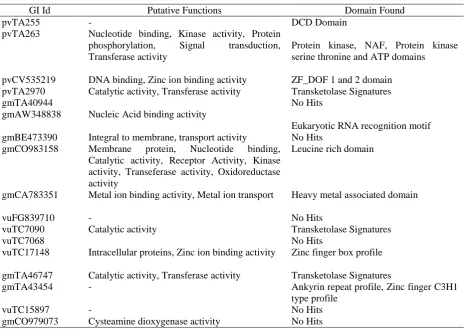
Gene ontology and domain analysis:For primer pairs which produced amplification, the corresponding amplified sequences from the source crops were retrieved and subjected to gene ontology and domain analysis. This exercise was carried out in 2 stages. (a) BLASTX analysis: First step of the domain analysis involved using the blastx tool. This tool converts all the amplified sequences into the 6 open reading frames and match protein sequences in the non-redundant database against it, giving the most probable translation of the amplified sequence. (b) Scanprosite analysis: Scan prosite is a web tool that gives us the various domains present with an amino acid chain. The presence of these domains will allow an easier understanding of the probable interactions that can take place between the genes and their putative functions.
Results and discussion
Frequency and distribution of EST-SSR:A total of 2,86,488 sequences were analyzed that identified 22,457 SSRs from 19,854 (12.76%) SSR-containing unique ESTs (Figure 1) which comprised of 29.08% di, 46.41% tri, 7.29% tetra, and 17.22% penta nucleotide repeats. Among the dinucleotide repeats, motif AG/CT (64.57%) was the most frequent one followed by AT/AT (29.63%) and among trinucleotide repeats, AAG/CTT (25.88%) was most common followed by AAC/GTT (12.61%), AAT/ATT (12.02%) and ATC/ATG (11.84%).
Development of EST-SSR markers and their polymorphism: From the SSR-containing ESTs, a total of 522 sequences were further shortlisted based on their presence in more than one species of which 98 were represented in three, 474 in two and none in all the four species. After designing the primers for all of them, 50 primer pairs (Table 2) were randomly chosen for amplification and polymorphism studies by applying them against a panel of 25 morphologically and genetically diverse M. pruriens genotypes (Table 3). Out of these, 17 primers showed amplification and three exhibited polymorphic profiles in M. pruriens
genotypes. A total of 14 polymorphic alleles were detected from these three primers (Table 4).
Genetic variability and data analysis:The number of alleles detected per locus for the three polymorphic primers ranged from 4 to 6, with an average of 4.66 alleles per locus. The He
ranged from 0.71 to 0.73 (with an average of 0.72) and the Ho ranged from 0.58 to 0.74 (with
an average of 0.67) (Table 4). The PIC ranged
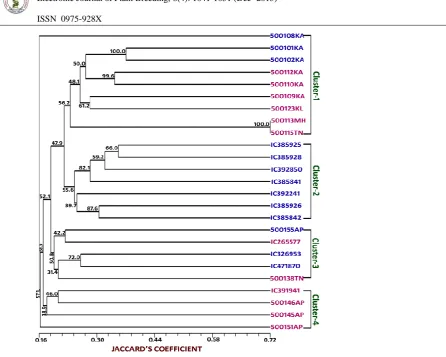
from 0.64 to 0.67, with an average of 0.65. The UPGMA dendrogram (Figure 2) grouped 25 M. pruriens accessions into four major clusters mainly based on varietal differences. Cluster-1 majorly grouped M. pruriens var. pruriens accessions along with two M. pruriens var. utilis accessions (500101KA, 500102KA). Cluster-2 comprised exclusively M. pruriens var. utilis accessions. Cluster-3 showed intermixing of M. pruriens var.
utilis and M. pruriens var. pruriens; while cluster-4 contained all the M. pruriens var. pruriens
accessions. Accession 500108KA belonging to M. pruriens var. utilis distinctly out grouped from the above clusters. Likewise, accession 500151AP which is M. pruriens var. pruriens outgrouped clusters-3 and 4 showing its distinctiveness in the
M. pruriens var. pruriens collection.
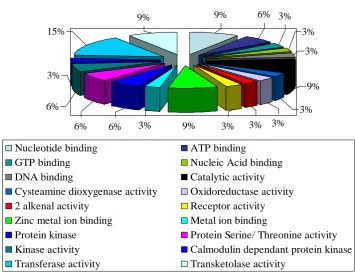
Gene ontology and domain analysis:To find the putative functions of all the amplified sequences, gene ontology studies were done. The obtained results were divided into 3 groups (Figure 3): (a) Cellular component functions: 7 sequences showed similarity with cellular putative proteins. 33% of the sequences shared similarity with proteins integral to the membrane and other membrane proteins and 17% with intercellular proteins and plastids. (b) Molecular function: 34 sequences showed putative functions under this category. 13% sequences showed high similarity with transferase activity related proteins, 10% showed homology with protein kinase, protein serine/ threonine kinase activity and nucleotide binding activity. (c) Biological process functions: 13 sequences showed putative functions under metabolic functions category; 23% of the sequences were homologous with metabolic process related proteins and 15% with phosphorylation proteins, oxidation reduction related proteins and protein phosphorylation proteins. This kind of study would give us an in-depth understanding of the interactions of these genes at the protein level with the results obtained detailed in Table 5.
ISSN 0975-928X
1044
reveal high level of allelic polymorphisms,co-dominant mode of inheritance, transferability across species and high reproducibility are well recognized (Kuleung et al., 2004; Miah et al., 2013).
The frequency of EST-SSRs (12.76%) discovered in the present study is much higher compared to earlier reports in A. hypogaea (3.62%; Liang et al., 2009), M. truncatula (0.4%; Chandra, 2011) and P. sativum (3.2%; Gong et al., 2010). However, the redundancy in sequences obtained from dbEST was compensated by choosing the processed TIGR Plant Transcript assemblies and TIGR gene indices. Nonetheless, independent assembly using the TGICL package may also be used for this purpose.
The frequency and type of SSRs obtained was consistent among the analyzed legume species. In all these cases, trinucleotide repeats were the most frequent which is in consensus with other legume species (Cardle et al., 2000; Gao et al., 2003; Varshney et al., 2004). However, in case of C. arietnium dinucleotide repeats were present in higher frequency than trinucleotides repeats.
It was observed that the highest percentage of SSR containing sequences was present in Vigna unguicularis (0.0798%) followed by Cicer arietinum (0.077%), Phaseolus vulgaris (0.061%) and Glycine max (0.068%). The contribution of G. max and P. vulgaris sequences to the final primer design was higher compared to C. arietinum which accounted lowest. Amplification and polymorphism percentage (17.65%) was higher for the primers designed from sequences that were common in 3 species as compared to two. This may be due to the amount of sequence information available and the extent of evolutionary distance between the species used.
Earlier reports indicate that the transferability of EST-SSRs from one species to another ranged from 40–89% (Thiel et al., 2003; Holton et al., 2002; Eujayl et al., 2004; Gao et al., 2003, Yu et al., 2004; Saha et al., 2004 & 2005; Varshney et al., 2005). In the present study, the percentage of transferability achieved for M. pruriens (34%) was lower than those reported for M. truncatula to V. faba (43%), Cicer sp. (39%) and P. sativum (40%) (Gutierrez et al., 2005), and higher than that reported for P.vulgaris to G.max (20%), and Dipterix (6%) (Garcia et al., 2010). The results thus demonstrate reasonable success of this technique for development of newer genomic resources.
The set of 3 EST-SSR primers used in this study revealed a total of 14 polymorphic alleles,
with an average of 4.66 per locus. The He, Ho
and PIC values were 0.72, 0.67 and 0.65, respectively. Earliest study using RAPD (Leelambika et al., 2010; Leelambika and Sathyanarayana, 2011) found heterozygosity in M. pruriens accessions to be 0.24 (estimating 18 accessions) and 0.14 (estimating 35 accessions), respectively. Higher heterozygosity estimates obtained in the present study reflect the ability of SSR markers to reveal unique alleles in the population. Similarly, the UPGMA tree based on similarity estimates grouped the 25 accessions into four major clusters based on varietal differences. The grouping of two M. pruriens var. utilis
accessions (500101KA, 500102KA) along with
Mucuna var. pruriens in cluster-I, as well as a few intermixed accessions found in cluster-II might be naturalized hybrids of Mucuna var. pruriens x M. pruriens var. utilis. This is not uncommon in M. pruriens natural population as these botanical varieties exhibit considerable inter-varietal compatibility. Such hybrids are also reported in earlier works of Padmesh et al. (2006). Likewise the out-grouping of accession 500108KA (M. pruriens var. utilis) might be due to unique morpho-agronomic characters displayed by the plant such as: white flower colour, non-itching pod, high seed pod and seed yield and longer life cycle. Also, the accession 500151AP which out grouped clusters 3 and 4 exhibited higher yields and other agronomic characters in comparison to other M. pruriens var. pruriens accessions in that group (data not shown).
Gene Ontology and domain data mining exercise allowed us to correlate the presence of the domains with their putative functions. In cases where the putative functions were not able to be assigned, using the domain information obtained, it was possible to understand the role of the gene. One reason why a few sequences showed no hits on scan prosite is due to the presence of low homologous sequences that were obtained after blastx analysis. A few sequences with as low as 17% coverage were obtained. This isn’t conducive for the detection of domains.
Conclusion
ISSN 0975-928X
EST markers that can be achieved through this method. Besides, dropping sequencing costs offers transcriptome analysis and genotyping by sequencing as some of the potential options for the development of species specific markers - the success of which might open up newer vistas for molecular breeding applications in medicinal legume species in general and M. pruriens in particular.
Acknowledgments
The authors acknowledge financial support from the Dept. of Science & Technology (DST), Govt. of India; Dept. of Biotechnology (DBT), Govt. of India, and Kirkhouse Trust (KHT), UK. NS thanks Sikkim University, Gangtok and Sri Krishnadevaraya Educational Trust (Sri KET), Bangalore, India for the laboratory and field facilities.
References
Adalberto T. Castelo, Wellington Martinsand Guang R. Gao. 2002. TROLL—Tandem Repeat Occurrence Locator. Bioinformatics.,8:634. Altschul S.F., Gish W., Miller W., Myers E.W. and
Lipman D.J. 1990. "Basic local alignment search tool." Journal of Molecular Biology.,215:403-410.
Amaresh Chandra.2011. Use of EST Database markers from M. Truncatula in the transferability to other forage legumes. Journal of Environmental Biology.,32: 347-354.
Bressani R. 2002.Factors influencing nutritive value in food grain legumes: Mucuna compared to other grain legumes. In: Flores BM, Eilittä M, Myhrman R, Carew LB and Carsky RJ (Ed) Food and Feed from Mucuna: Current Uses and the Way Forward. Workshop, CIDICCO, CIEPCA and World Hunger Research Center, Tegucigalpa, Honduras, April 26-29, 2000, pp. 164-188.
Capo-Chichi L.J.A., Weaver D.B.and Morton C.M.2001. AFLP assessment of genetic map of velvetbean (Mucuna spp.) based on AFLP markers. Theoretical and Applied Genetics.,103:1180-1188.
Capo-Chichi L.J.A., Weaver D.B. and Morton C.M. 2004. An intraspecific genetic map of velvetbean (Mucuna spp.) based on AFLP markers. Theoretical and Applied Genetics.,108:814-821.
Cardle L., Ramsay L., Milbourne D., Macaulay M., Marshall D. and Waugh R.2000. Computational and experimental characterization of physically clustered simple sequence repeats in plants. Genetics.,156: 847-854.
Chen C.X., Zhou P., Choi Y.A., Huang S. and Gmitter F.G. 2006. Mining and characterizing microsatellites from citrus ESTs. Theoretical and Applied Genetics.,112:1248-1257. Cordeiro G.M., Casu R., McIntyre C.L., Manners J.M.
and Henry R.J. 2001.Microsatellite markers from sugarcane (Saccharum spp.) ESTs cross
transferable to erianthus and sorghum. Plant Science.,160(6):1115-1123.
Eujayl I., Sledge M.K., Wang L., May G.D., Chekhovskiy K., Zwonitzer J.C. and Mian M.A. 2004.Medicago truncatula EST-SSRs reveal cross-species genetic markers for
Medicago spp. Theoretical and Applied
Genetics.,108(3):414-422.
Faircloth B.C. 2008. MSATCOMMANDER: detection of microsatellite repeat arrays and automated, locus-specific primer design. Molecular
Ecology Resources.,8:92-94.
doi:10.1111/j.1471-8286.2007.01884.x. Farooqi A.A., Khan M.M. and Vasundhara M. 1999.
Production technology of medicinal and aromatic crops. Natural Remedies Pvt. Ltd., Bangalore, India, pp. 26-28.
Frank M. You, Naxin Huo, Yong Qiang Gu, Ming-cheng Luo, Yaqin Ma, Dave Hane, Gerard R Lazo, Jan Dvorak and Olin D Anderson. 2003. BatchPrimer3: a high throughput web application for PCR and sequencing primer designi. BMC Bioinformatics.,9:253. doi:10.1186/1471-2105-9-253
Gous Miah , Mohd Y. Rafii, Mohd R. Ismail, Adam B. Puteh, Harun A. Rahim, Kh. Nurul Islam and Mohammad Abdul Latif. 2013. A Review of Microsatellite Markers and Their Applications in Rice Breeding Programs to Improve Blast Disease Resistance. International Journal of Molecular Science.,14: 22499-22528. Guo W.Z., Wang W., Zhou B.L. and Zhang T.Z. 2006.
Cross-species transferability of G. arboreum -derived EST-SSRs in the diploid species of
Gossypium. Theoretical and Applied
Genetics.,112: 1573–1581.
Gutierrez M.V., Vaz Patto M.C., Huguet T., Cubero J.I., Moreno M.T. and Torres A.M. 2005. Cross-species amplification of Medicago Truncatula
microsatellites across three major pulse crops.
Theoretical and Applied Genetics.,110(7):
1210-1217.
Holton T.A., Christopher J.T., McClure L., Harker N. and Henry R.J. 2002.Identification and mapping of polymorphic SSR markers from expressed gene sequences of barley and wheat.
Molecular breeding.,9(2):63-71.
Jonah P.M., Bello L.L., Lucky O., Midau O. and Moruppa S.M. 2011. Review: The Importance of Molecular Markers in Plant Breeding Programmes.Global Journal of Science Frontier Research.,11(5).
Kantety R.V., La Rota M., Matthews D.E. and Sorrells M.E.2002. Data mining for simple sequence repeats in expressed sequence tags from barley, maize, rice, sorghum and wheat. Plant Molecular Biology.,48: 501–510.
Kuleung C., Baenziger P.S. and Dweikat I. 2004.Transferability of SSR markers among wheat, rye, and triticale. Theoretical and Applied Genetics.,108(6):1147-1150.
Kavitha C. and Thangamani C. 2014. Amazing bean
Mucuna pruriens: A comprehensive review.
Journal of Medicinal plant research.,
ISSN 0975-928X
1046
Kolpakov R. et al. 2003. Mreps: efficient and flexibledetection of tandem repeats in DNA. Nucleic Acids Research.,31: 3672–3678.
Leelambika M., Mahesh S., Jaheer M. and Sathyanarayana N. 2010. Comparative evaluation of genetic diversity among Indian
Mucuna species using morphometric,
biochemical and molecular approaches. World Journal of Agricultural Sciences.,6(5):568– 578.
Oudhia P. 2002. Kapikachu or Cowhage (M. pruriens) Crop Fact Sheet. Version of 5-9.
Padmesh P., Reji J.V., Jinish Dhar M. and Seeni S. 2006. Estimation of genetic diversity in varieties of Mucuna pruriens using RAPD.
Biologia Plantarum.,50:367–372.
Powell W., Machray G.C. and Provan J. 1996: Polymorphism revealed by simple sequence repeats. Trends Plant Sciences.,1(7):215-222. Robertha A.V. Garcia, Priscila N. Rangel, Claudio
Brondani, Wellington S. Martins, Leonardo C. Melo, Monalisa S. Carneiro, Tereza C.O. Borba and Rosana P.V. Brondani. 2011. The characterization of a new set of EST-derived simple sequence repeat (SSR) markers as aresource for the genetic analysis of Phaseolus vulgaris.BMC Genetics.,12:41.
Rozen S. and Skaletsky H.J. 2000. Primer3 on the WWW for general users and for biologist programmers. In: (Eds Krawetz S, Misener S).Bioinformatics Methods and Protocols: Methods in Molecular Biology, Humana Press, Totowa, NJ.,132: 286-365.
Saha M.C., Mian M.A, Eujayl I., Zwonitzer J.C., Wang L. and May G.D. 2004. Tall fescue EST-SSR markers with transferability across several grass species. Theoretical and Applied Genetics.,109(4):783-91.
Saha M.C., Mian R., Zwonitzer J.C., Chekhovskiy K. and Hopkins A.A. 2005. An SSR- and AFLP-based genetic linkage map of tall fescue (Festuca arundinacea Schreb.). Theoretical and Applied Genetics.,110(2):323-336. Sathyanarayana N., Vikas P.B., Bharath Kumar T.N. and
Rajesha R. 2010. RAPD markers for genetic characterization of Mucuna species. Indian Journal of Genetics.,70 (3): 296-298.
Singh A.P., Sarkar S., Tripathi M. and Rajender S. 2013.
Mucuna pruriens and its major constituent L-DOPA recover spermatogenic loss by combating ROS, loss of mitochondrial membrane potential and apoptosis. PLoS ONE.,8(1): e54655.
Sreenu V.B., Ranjitkumar G., Swaminathan S., Priya S., Bose B., Pavan M.N., Thanu G., Nagaraju J. andNagarajaram H.A. 2003. MICAS: a fully automated web server for microsatellite extraction and analysis from prokaryote and viral genomic sequences. Applied Bioinformatics.,2(3):165-8.
Temnykh S., DeClerckG., LukashovaA., Lipovich L., Cartinhour S. and McCouch S.2001. Computational and experimental analysis of
microsatellites in rice (Oryza sativa L.): frequency, length variation, transposon associations, and genetic marker potential.Genome research., 11:1441-1452. Thiel T., Michalek W., Varshney R.K. and Graner A.
2003.Exploiting EST databases for the development and characterization of gene-derived SSR-markers in barley (Hordeum
vulgare L.). Theoretical and Applied
Genetics.,106(3):411-422.
Varshney R.K., Prasad M., Zhang H., Kota R., Sigmund R., Scholz U., Stein N. and Graner A. 2004. EST-derived markers and transcript map of barley: a resource for interspecific transferability and comparative mapping in cereals. In: Proc 9th Intern Barley Genet Symp (Eds J. Spunar and J. Janikova), Brno, Czech Republic, pp. 332-338.
Varshney R.K., Graner A. and Sorrells M.E. 2005.Genic microsatellite markers in plants: features and applications. Theoretical and Applied Genetics.,23(1):48-55.
Wellington Santos Martins, Divino César Soares Lucas, Kelligton Fabricio de Souza Neves, and David John Bertioli, 2009. WebSat ‐ A web software for microsatellite marker development.
Bioinformation.,3(6): 282–283.
Wilmot-Dear C.M. 1987. A revision of Mucuna in the Indian subcontinent and Burma. Kew Bulletin.,42: 23-46.
Xuanqiang Liang, Xiaoping Chen, Yanbin Hong, Haiyan Liu, Guiyuan Zhou, Shaoxiong Li and Baozhu Guo. 2009. Utility of EST-derived SSR in cultivated peanut (Arachis Hypogaea L.) and Arachis wild species. BMC Plant Biology.,9:35.
Yu J.K., La Rota M., Kantety R.V. and Sorrells M.E. 2004.EST derived SSR markers for comparative mapping in wheat and rice.
Molecular Genetics and
Genomics.,271(6):742-751.
ISSN 0975-928X
Table 1. Details on the the sequences analyzed from different legume species. for identifying EST-SSRs Species Total number of
sequences examined
Total number of identified SSRs
Number of SSR containing sequences
Largest incidence of SSR
Unit size
Number of SSRs
Glycine max 231658 18873 16559 3 8010
Phaseolus
vulgaris 20629 1851 1578 3 736
Cicer
arietinum 1272 112 106 2 56
Vigna
anguicularis 32929 3708 3148 3 1646
Table 2. Sequences of 50 EST-SSR primers used for validation
GeneID Primer name Primer Sequence 5' to 3'
gmTA46747_(F) MUC_1 GGAAGAGACCCTCAATTCTT
gmTA46747_(R) MUC_1 CAGGGAGAACACTCTCTTTGT
pvTA255_(F) MUC_4 AATTCAGTGACCAGTTGAGG
pvTA255_(R) MUC_4 AGATTCCTCCCTTGTTGAAG
gmTA40944_(F) MUC_8 CTGGTGGTGGTTTCTTCTAGT
gmTA40944_(R) MUC_8 AATTCCGACCACAACCTC
gmTA43454__(F) MUC_11 GTAAAGAGATGCTTCCACCA
gmTA43454__(R) MUC_11 CTCCAAGTCTTCCCTGATCTA
vuTC7090_(F) MUC_14 CTGTGGTTAACAGGAAGAGAC
vuTC7090_(R) MUC_14 CCTTGTATTCCTCTGATTGC
vuTC7068_(F) MUC_15 CCCAAAGAAAGGTGAAGAAG
vuTC7068_(R) MUC_15 GAGCAATGGACTACCTTTTG
vuTC17148_(F) MUC_21 CCTAGCTTCACATCCTCTTG
vuTC17148_(R) MUC_21 ATCCAAGATCAGGCACAGTA
vuTC15897_(F) MUC_22 GTACTAGCGCATTACTTCCAC
vuTC15897_(R) MUC_22 CCCACTTTCCTTTACTGAAC
vuFG839710_(F) MUC_24 GGCTGAATGAACTAATGGAG
vuFG839710_(R) MUC_24 GGAGTTTGAAGGAGAGTAGTGA
gmAW348838_(F) MUC_28 GAGCGATGAATGGACAGAA
gmAW348838_(R) MUC_28 ACTCGAACTCAAACCACAAC
gmBE473390_(F) MUC_29 GAAGCCAAAGTTCCATTACC
gmBE473390_(R) MUC_29 CCCTATCCATTCCTCTATTCC
gmCA783351_(F) MUC_31 CTGGAACAAGAGTCGAAAGAG
gmCA783351_(R) MUC_31 TTTCGGGATCGGAGAAAGA
gmCO979073_(F) MUC_34 TGTTGAACTCCATGACAGACC
gmCO979073_(R) MUC_34 CACAACAAGTGGAGAGCATAAC
gmCO983158_(F) MUC_36 ACATTGTCGCATGGGTTAG
gmCO983158_(R) MUC_36 GAACTGCTGCTTTTGGATTG
pvCV535219_(F) MUC_40 GCAAAGACAGCTTCAACCAA
pvCV535219_(R) MUC_40 TTCTCCCAAACAGACCAAG
pvTA263_(F) MUC_48 CTGAGAATCCTACACCTGCTT
pvTA263_(R) MUC_48 GGAGCACAAGAACACAACATC
ISSN 0975-928X
1048
Table 3. Mucuna pruriens accessions analyzed through EST-SSR markers
Sl. No.
Accession Name Accession Number
Place of collection Latitude and longitude
1. M. pruriens var. utilis 500102KA Karnataka -
2. M. pruriens var. utilis 500101KA Karnataka -
3. M. pruriens var. utilis 500108KA Karnataka 13°14’ N, 77°62’ E
4. M. pruriens var. utilis IC385925 Jharkand 24°26’ N, 87°24’ E
5. M. pruriens var. utilis IC385928 NBPGR -
6. M. pruriens var. utilis IC392850 NBPGR, Orissa 22°06’ N, 86°40’ E
7. M. pruriens var. utilis IC385841 NBPGR, Jharkand 24°62’ N, 87°84’ E
8. M. pruriens var. utilis IC392241 NBPGR, Jharkand 23°78’ N, 86°43’ E
9. M. pruriens var. utilis IC385926 NBPGR, Jharkand 24°26’ N, 87°24’ E
10. M. pruriens var. utilis IC385842 NBPGR, Jharkand 24°48’ N, 86°69’ E
11. M. pruriens var. utilis IC326953 Himachal Pradesh 30°90’ N, 77°09’ E
12. M. pruriens var. utilis IC471870 NBPGR, Delhi 28°62’ N, 77°23’ E
13. M. pruriens var. utilis 500155AP Andhra Pradesh -
14. M. pruriens var. pruriens 500112KA Karnataka 12°18' N, 76°42' E
15. M. pruriens var. pruriens 500113MH Maharashtra 20°00’ N, 73°77’ E
16. M. pruriens var. pruriens 500110KA Karnataka 13°33’ N, 77°10’E
17. M. pruriens var. pruriens IC265577 NBPGR, Kerala 9°58’ N, 76°52’ E
18. M. pruriens var. pruriens IC391941 NBPGR, Orissa 21°65’ N, 85°63’ E
19. M. pruriens var. pruriens 500138TN Tamil Nadu 10°38’ N, 78°82’ E
20. M. pruriens var. pruriens 500123KL Kerala -
21. M. pruriens var. pruriens 500109KA Karnataka 13°56’ N, 75°38’ E
22. M. pruriens var. pruriens 500115TN Tamil Nadu -
23. M. pruriens var. pruriens 500144AP Andhra Pradesh 18°03’ N, 78°18’ E
24. M. pruriens var. pruriens 500146AP Andhra Pradesh 18°39’ N, 78°10’ E
25. M. pruriens var. pruriens 500151AP Andhra Pradesh 19°37’ N, 78°30’ E
Table 4. Diversity statistics for the 3 EST-SSR loci described by the number of alleles (Na) per
locus, expected (He) and observed (Ho) heterozygosities, and polymorphism information content (PIC)
observed in the 25 M.pruriens genotypes.
LocusName Na He Ho PIC
MUC_4 4 0.72 0.71 0.64
MUC_31 6 0.73 0.74 0.67
MUC_48 4 0.71 0.58 0.64
Total 14 2.16 2.03 1.95
Mean 4.66 0.72 0.67 0.65
ISSN 0975-928X
Table 5. Details of Gene ontology and domain analyses conducted
GI Id Putative Functions Domain Found
pvTA255 - DCD Domain
pvTA263 Nucleotide binding, Kinase activity, Protein phosphorylation, Signal transduction, Transferase activity
Protein kinase, NAF, Protein kinase serine thronine and ATP domains
pvCV535219 DNA binding, Zinc ion binding activity ZF_DOF 1 and 2 domain pvTA2970 Catalytic activity, Transferase activity Transketolase Signatures
gmTA40944 No Hits
gmAW348838 Nucleic Acid binding activity
Eukaryotic RNA recognition motif gmBE473390 Integral to membrane, transport activity No Hits
gmCO983158 Membrane protein, Nucleotide binding, Catalytic activity, Receptor Activity, Kinase activity, Transeferase activity, Oxidoreductase activity
Leucine rich domain
gmCA783351 Metal ion binding activity, Metal ion transport Heavy metal associated domain
vuFG839710 - No Hits
vuTC7090 Catalytic activity Transketolase Signatures
vuTC7068 No Hits
vuTC17148 Intracellular proteins, Zinc ion binding activity Zinc finger box profile
gmTA46747 Catalytic activity, Transferase activity Transketolase Signatures
gmTA43454 - Ankyrin repeat profile, Zinc finger C3H1
type profile
vuTC15897 - No Hits
gmCO979073 Cysteamine dioxygenase activity No Hits
ISSN 0975-928X
1050
Figure 2. Dendrogram of the 25 M.pruriens genotypes obtained after UPMGA cluster analysis. Blue- M.
pruriens var. utilis; Pink- M. pruriens var. pruriens
a) Cellular Putative Functions
17%
17%
33%
33%
ISSN 0975-928X
b) Biological Putative Functions
c) Molecular Putative Functions
Figure 3. Putative functions of the 17 amplified sequences based on Gene Ontology analysis 15%
15% 23%
8% 8% 8%
8% 15%
Transmembrane transport Metal ion transport
Signal transduction Small GTPase mediated signal transduction Metabolic process Oxidation reduction process
Protein phosphorylation Phosphorylation
15%
3%
6%
6% 6% 3% 9% 3% 3%
9% 9% 6% 3%
3%
3%
3% 3%
9%
Nucleotide binding ATP binding
GTP binding Nucleic Acid binding
DNA binding Catalytic activity
Cysteamine dioxygenase activity Oxidoreductase activity
2 alkenal activity Receptor activity
Zinc metal ion binding Metal ion binding
Protein kinase Protein Serine/ Threonine activity
Kinase activity Calmodulin dependant protein kinase