RESEARCH
Comprehensive characterization
of toxicity of fermentative metabolites
on microbial growth
Brandon Wilbanks
1and Cong T. Trinh
1,2*Abstract
Background: Volatile carboxylic acids, alcohols, and esters are natural fermentative products, typically derived from anaerobic digestion. These metabolites have important functional roles to regulate cellular metabolisms and broad use as food supplements, flavors and fragrances, solvents, and fuels. Comprehensive characterization of toxic effects of these metabolites on microbial growth under similar conditions is very limited.
Results: We characterized a comprehensive list of thirty-two short-chain carboxylic acids, alcohols, and esters on microbial growth of Escherichia coli MG1655 under anaerobic conditions. We analyzed toxic effects of these metabo-lites on E. coli health, quantified by growth rate and cell mass, as a function of metabolite types, concentrations, and physiochemical properties including carbon number, chemical functional group, chain branching feature, energy density, total surface area, and hydrophobicity. Strain characterization revealed that these metabolites exert distinct toxic effects on E. coli health. We found that higher concentrations and/or carbon numbers of metabolites cause more severe growth inhibition. For the same carbon numbers and metabolite concentrations, we discovered that branched chain metabolites are less toxic than the linear chain ones. Remarkably, shorter alkyl esters (e.g., ethyl butyrate) appear less toxic than longer alkyl esters (e.g., butyl acetate). Regardless of metabolites, hydrophobicity of a metabolite, gov-erned by its physiochemical properties, strongly correlates with the metabolite’s toxic effect on E. coli health.
Conclusions: Short-chain alcohols, acids, and esters exhibit distinctive toxic effects on E. coli health. Hydrophobicity is a quantitative predictor to evaluate the toxic effect of a metabolite. This study sheds light on degrees of toxicity of fermentative metabolites on microbial health and further helps in the selection of desirable metabolites and hosts for industrial fermentation to overproduce them.
Keywords: Escherichia coli, Toxicity, Alcohols, Carboxylic acids, Esters, Growth inhibition, Energy density, Partition coefficient, Hydrophobicity, Total surface area
© The Author(s) 2017. This article is distributed under the terms of the Creative Commons Attribution 4.0 International License
(http://creativecommons.org/licenses/by/4.0/), which permits unrestricted use, distribution, and reproduction in any medium,
provided you give appropriate credit to the original author(s) and the source, provide a link to the Creative Commons license, and indicate if changes were made. The Creative Commons Public Domain Dedication waiver (http://creativecommons.org/
publicdomain/zero/1.0/) applies to the data made available in this article, unless otherwise stated.
Background
During anaerobic digestion of organic matters, organ-isms naturally produce volatile organic acids and alcohols to balance cellular redox states. These molecules, along with esters generated from condensation of alcohols and acids, are of particular interest for not only fundamen-tally studying their functional roles to regulate cellular
metabolisms and microbiomes [1] but also harnessing them as food supplements, natural flavors and fragrances, solvents, and fuels [2].
A diverse class of microbes can naturally produce these volatile metabolites, some being harnessed for industrial-scale production. For instance, Escherichia coli, a facultative, gram-negative bacterium found in the lower intestine of animals, is widely used as an industrial workhorse microorganism for biocatalysis. E. coli pos-sesses a native mixed acid fermentative metabolism that has been metabolically engineered to produce many fer-mentative metabolites, including alcohols (e.g., ethanol
Open Access
*Correspondence: [email protected]
1 Department of Chemical and Biomolecular Engineering, University
[3, 4], isopropanol [5], butanol [6], isobutanol [7], pen-tanol [8], and hexanol [9]), diols (e.g., 1,3-propanediol [10] and 1,4-butanediol [11]), acids (e.g., pyruvate [12], lactate [13], and short–medium-chain carboxylic acids [14]), diacids (e.g., succinate [15] and adipate [16]), and esters (e.g., acetate esters [17], propionate esters [18, 19], butyrate esters [18–20], pentanoate esters [18, 19], and hexanoate esters [18, 19]).
Fermentative metabolites, however, can become inhibi-tory to microbial growth by directly interfering with cell membrane and/or intracellular processes [21–29]. Cur-rently, data on toxic effects of a comprehensive set of fer-mentative metabolites on microbial growth under similar growth conditions are very limited. Availability of these data can help identify and better understand most toxic metabolites to microbes during fermentation. It also pro-vides design criteria for selecting desirable metabolites and microbes for industrial production as well as guid-ing effective engineerguid-ing strategies to alleviate toxicity. For instance, various engineering approaches have been implemented to enhance microbial tolerance against some fermentative metabolites including increasing the ratio of saturated and unsaturated fatty acid composi-tions [30], raising the average chain length of fatty acid moieties in cell membrane [31], enhancing the ratio of trans- and cis-unsaturated fatty acids of cell membrane [32], and expressing efflux pumps [33] or chaperones [34]. Genome and evolutionary engineering have also been explored to enhance tolerance [24, 35–37].
In this study, we characterized the toxic effects of a comprehensive set of thirty-two fermentative metabolites including eight carboxylic acids, eight alcohols, and six-teen esters on E. coli health. We analyzed the toxic effects of these metabolites as a function of metabolite types, concentrations, and physiochemical properties including
carbon number, chemical functional group, chain branching feature, energy density, total surface area, and hydrophobicity.
Results and discussion
To study the toxic effects of fermentative metabolites on E. coli health, growth kinetics were generated for each metabolite using industrially relevant concentrations (0, 2.5, 5.0, and 7.5 g/L) and additional concentrations as needed for certain metabolites. Both growth rate and OD during the first 24 h period were extracted to evalu-ate E. coli health. For the reference growth condition without an exogenously added chemical, wildtype E. coli MG1655 grew at a rate of 0.61 ± 0.03 1/h and an OD of 1.40 ± 0.06 (Additional file 1: Figures S1–S3).
Toxic effects of alcohols
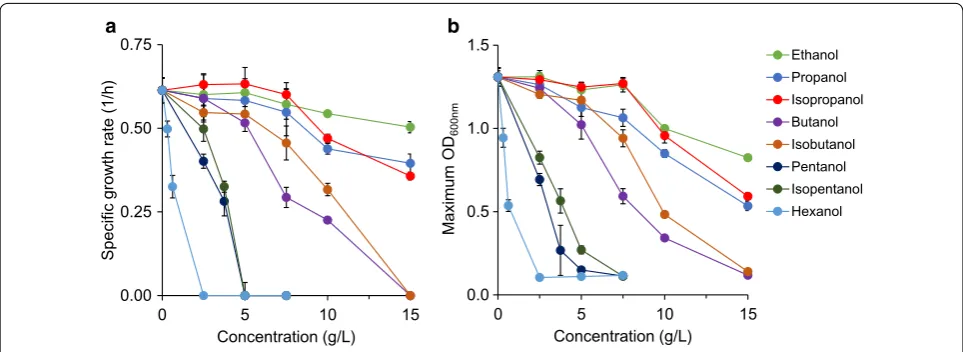
The first alcohol of interest, ethanol, was found to be essentially non-toxic up to 7.5 g/L (Additional file 1: Fig-ure S1A). At 10 g/L ethanol, specific growth rate and OD decreased by only 12% and 25% each as compared to the reference (without supplementation of toxins) (Fig. 1). At the highest measured concentration of 15 g/L, growth rate was further reduced by only 18%, but OD was nearly 40% lower at 0.82 ± 0.01. This trend of limited growth inhibition by ethanol is consistent with a previous report, where the growth rate of E. coli was reduced 25% in a complex medium containing 20 g/L ethanol [38].
Propanol toxicity at concentrations of up to 7.5 g/L was similar to that of ethanol, but at 15 g/L it was more toxic (Additional file 1: Figure S1B). Specific growth rate was 0.40 ± 0.03 1/h (nearly 50% lower than the reference) and OD was 0.53 ± 0.03 (~ 60% lower than the reference) (Fig. 1). Isopropanol toxicity exhibited relatively similar trends like propanol toxicity with slightly higher growth
0.0 0.5 1.0 1.5
0 5 10 15
Maximum
OD
600nm
Concentration (g/L)
Ethanol Propanol Isopropanol Butanol Isobutanol Pentanol Isopentanol Hexanol
0.00 0.25 0.50 0.75
0 5 10 15
et
ar
ht
wor
g ci
fic
ep
S(
1/h)
Concentration (g/L)
a b
and OD at most concentrations tested (Fig. 1, Additional file 1: Figure S1C).
Butanol was the first alcohol to display strong toxic effects before 10 g/L (Additional file 1: Figure S1D). At 7.5 g/L, growth rate (0.29 ± 0.03 1/h) and OD (0.50 ± 0.05) were reduced more than 50% as compared to the reference (Fig. 1). Growth was entirely inhibited in butanol at 15 g/L. Our data presented for butanol toxic-ity are consistent with a previous study reporting that growth of E. coli DH5α in YPD medium was reduced by 80% in 1% v/v (~ 8.1 g/L) butanol and stopped at 2% v/v (~ 16.2 g/L) [39]. Isobutanol was less toxic than butanol at all concentrations, with the exception of 15 g/L, where no growth was observed for both compounds (Additional file 1: Figure S1E). At 7.5 g/L, isobutanol was less inhibi-tory than butanol for E. coli growth, with higher specific growth rate and OD by approximately 25% (Fig. 1). Find-ings of isobutanol toxicity presented here are consistent with Atsumi et al.’s report [24]. The difference in toxic effects of isobutanol and butanol is consistent with the data from Huffer et al.’s report [25]. Remarkably, based on Huffer et al.’s data, microbial health is less inhibited in isobutanol than butanol not only for E. coli but also for some other bacterial, eukaryotic, and archaeal species.
For pentanol and isopentanol, no growth was observed at any studied concentrations above 5 g/L (Additional file 1: Figures S1F, G). Pentanol terminated all growth at 5 g/L, and at 3.75 g/L specific growth rate was just 0.28 ± 0.04 1/h (Fig. 1, Additional file 1: Figure S1F). Unlike pentanol, isopentanol at 5 g/L allowed for growth, with a reduced specific growth rate of 0.20 ± 0.04 1/h and an OD of 0.27 ± 0.02 (Fig. 1, Additional file 1: Figure S1G). At 2.5 g/L, isopentanol suppressed specific growth rate and OD, respectively, by 12 and 8% less than did pentanol.
Hexanol was the most toxic among alcohols used in this study. It eliminated all growth at only 2.5 g/L. A far reduced concentration of 0.625 g/L still cut growth rate by over 45% and OD by nearly 60% as compared to the reference (Fig. 1, Additional file 1: Figure S1H).
Overall, alcohols are toxic to microbial growth, and degrees of toxicity depend on alcohol types and concen-trations. Increasing alcohol concentrations decrease both specific growth rate and OD. Shorter chain length alco-hols (ethanol, propanol, isopropanol) require higher con-centrations to impact growth.
Toxic effects of carboxylic acids
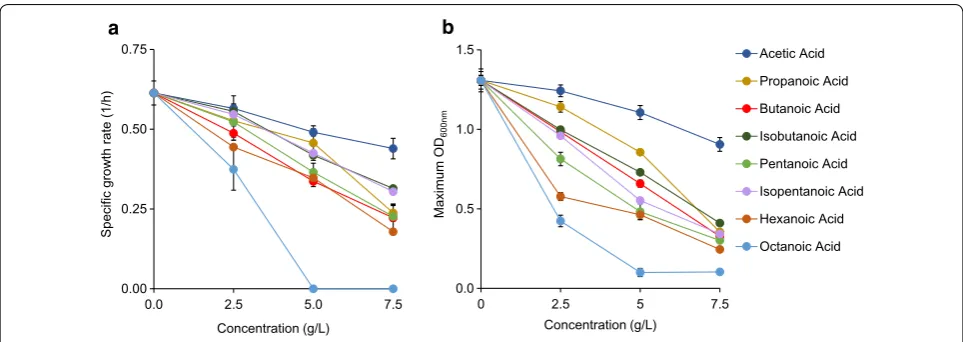
Acetic acid was marginally toxic up to 7.5 g/L, at which growth rate (0.44 ± 0.03 1/h) and OD (0.91 ± 0.01) were each reduced by ~ 20% compared to the reference (Fig. 2, Additional file 1: Figure S2A). Propionic acid at an identi-cal concentration was found to be much more toxic than acetic acid, with specific growth rate (0.24 ± 0.03 1/h) and OD (0.35 ± 0.014) being decreased ~ 60 and ~ 75%, respectively (Fig. 2, Additional file 1: Figure S2B).
Butanoic acid at 7.5 g/L was seen to be slightly more inhibitive of growth rate and OD than propionic acid, whereas concentrations of 2.5 and 5 g/L appeared simi-larly toxic like propionic acid (Fig. 2, Additional file 1: Figures S2C). Isobutanoic acid was found to be less toxic than butanoic acid, following the chain branching trend seen in alcohols (Fig. 2, Additional file 1: Figure S2D). At 2.5, 5.0, and 7.5 g/L, cells grew 6, 5, and 15% faster in isobutanoic acid than butanoic acid.
The pair of pentanoic and isopentanoic acids was also used. At each concentration, isopentanoic acid was less toxic than pentanoic acid. Pentanoic and isopentanoic acids sustained growth at 7.5 g/L to ODs of 0.30 ± 0.05 and 0.34 ± 0.02, and specific growth rates reached
0.00 0.25 0.50 0.75
0.0 2.5 5.0 7.5
cifi
ce
pS)
h/
1(
et
ar
ht
wor
g
Concentration (g/L)
a
0.0 0.5 1.0 1.5
0 2.5 5 7.5
Maximum OD
600nm
Concentration (g/L)
Acetic Acid Propanoic Acid Butanoic Acid Isobutanoic Acid Pentanoic Acid Isopentanoic Acid Hexanoic Acid Octanoic Acid
b
0.23 ± 0.04 and 0.30 ± 0.02 1/h, respectively (Fig. 2, Additional file 1: Figures S2E, F).
The next acid studied was hexanoic acid. Growth with this compound was sustained at 7.5 g/L, but specific growth rate was reduced by > 70% and OD just reached 0.24 ± 0.03 (Fig. 2, Additional file 1: Figure S2G). Octa-noic acid was even more toxic, eliminating all growth at 5 g/L (Fig. 2, Additional file 1: Figure S2H). At 2.5 g/L, growth rate (0.37 ± 0.06 1/h) and OD (0.43 ± 0.02) were decreased by about 40 and 65% as compared to the ref-erence, respectively. Octanoic acid was the most toxic organic acid studied here and was the only acid that pre-vented all growth above 2.5 g/L.
Like alcohols, acid toxicity on microbial growth depends on exposed concentrations and acid chain length. Increasing acid concentrations enhance toxic-ity for all compounds, reducing growth rates and cell concentrations. Longer chain acids cause severe growth inhibition.
Toxic effects of esters
Cells are capable of producing a combinatorial library of esters by condensing organic acids and alcohols [18–20]. In this study, we investigated the toxic effects of a com-prehensive list of 16 common short-chain esters on E. coli health. For comparison, we classified these esters into 3 categories: ethyl esters, propyl esters, and butyl esters.
Ethyl esters
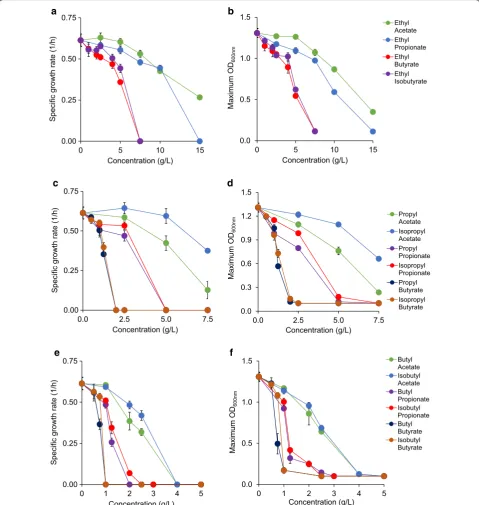
Ethyl acetate was not strongly toxic until concentrations of 10 g/L or greater (Additional file 1: Figure S3A). At 10 and 15 g/L, the specific growth rates observed were reduced to 0.42 ± 0.01 1/h and 0.27 ± 0.01 1/h, respec-tively. ODs followed a similar trend, being reduced to 0.87 ± 0.03 at 10 g/L and 0.35 ± 0.03 at 15 g/L (Fig. 3). Ethyl propionate was more toxic than ethyl acetate at identical concentrations (Additional file 1: Figure S3B). At 10 g/L, specific growth rates between growth in ethyl acetate and ethyl propionate were not different, but OD was more than 20% lower in ethyl propionate than in ethyl acetate (Fig. 3). No growth occurred with the addi-tion of 15 g/L ethyl propionate, making ethyl acetate the only ester that allowed for any growth at 15 g/L (Addi-tional file 1: Figure S3).
Ethyl butyrate was the most toxic among the character-ized ethyl esters, with a specific growth rate of 0.36 ± 0.01 1/h and an OD of 0.54 ± 0.02 at 5 g/L (Fig. 3, Additional file 1: Figure S3C). The toxic effect of ethyl butyrate was still noteworthy at 5 g/L, slowing growth rate by over 25% and lowering OD by over 40% as compared to the reference. The branched chain isomer of ethyl butyrate, ethyl isobutyrate, was also studied (Additional file 1: Figure S3D). It was less toxic than ethyl butyrate at all
concentrations, most notably at 5 g/L, where observed growth rate was approximately 20% higher than the growth rate with ethyl butyrate (Fig. 3). Cultures with 7.5 g/L of both ethyl butyrate and ethyl isobutyrate were unable to grow (Additional file 1: Figures S3C, D).
Propyl and isopropyl esters
Both propyl acetate and isopropyl acetate inhibited growth at 7.5 g/L, but isopropyl acetate was far less toxic (Additional file 1: Figures S3E, H). Cultures containing propyl acetate at 7.5 g/L reached an OD of 0.24 ± 0.02, doubling only once in 24 h of characterization. However, the cell culture exposed to isopropyl acetate at 7.5 g/L displayed a higher OD than the cell culture exposed to propyl acetate by threefold (Fig. 3). Cells (0.38 ± 0.37 1/h) also grew 3.5 times faster in isopropyl acetate than propyl acetate at this concentration.
The addition of propyl propionate at any concentration 5 g/L or higher prevented all growth (Additional file 1: Figure S3F). A strong toxic effect was seen with the addi-tion of 2.5 g/L of the compound, reducing both specific growth rate (0.47 ± 0.023 1/h) and OD (0.80 ± 0.02) by ~ 25 and ~ 40% as compared to the reference, respec-tively (Fig. 3). On the other hand, cultures exposed to 2.5 g/L isopropyl propionate displayed much health-ier growth (Fig. 3, Additional file 1: Figure S3I), with a specific growth rate of 0.55 ± 0.03 (1/h) and an OD of 0.98 ± 0.02. Like propyl propionate, no growth occurred in cultures at 5 g/L isopropyl propionate.
The final pair of propyl esters characterized here was propyl butyrate and isopropyl butyrate. Both compounds prevented any growth from occurring at 2 g/L, but growth was sustained at concentrations of 1.25 g/L or lower (Additional file 1: Figures S3G, J). Propyl butyrate at 1.25 g/L decreased specific growth rate (0.35 ± 0.34 1/h) and OD (0.57 ± 0.03) by about twofold. Isopropyl butyrate was less toxic, with 7% higher growth rate and 15% higher OD than propyl butyrate at this concentra-tion (Fig. 3).
Butyl and isobutyl esters
Butyl propionate was far more toxic than butyl acetate (Fig. 3, Additional file 1: Figure S3L). Unlike butyl and isobutyl acetates, butyl propionate with a concentration greater than 2 g/L prevented growth. Growth at 1.25 g/L of this compound was marginal with specific growth rate being decreased by more than 60%. The toxic effects were
even observed at just 1 g/L, where specific growth rate (0.49 ± 0.02) dropped by 20%. Isobutyl propionate was slightly less toxic, allowing for growth at 2 g/L, but spe-cific growth rate and OD were each no more than 20% of that of the reference (Fig. 3, Additional file 1: Figure S3O).
0.0 0.5 1.0 1.5
0 1 2 3 4 5
Maximum OD
600n
m
Concentration (g/L)
Butyl Acetate Isobutyl Acetate Butyl Propionate Isobutyl Propionate Butyl Butyrate Isobutyl Butyrate
0.00 0.25 0.50 0.75
0 1 2 3 4 5
et
ar
ht
wor
g
cifi
ce
pS(
1/h)
Concentration (g/L) 0.00
0.25 0.50 0.75
0 5 10 15
et
ar
ht
wor
g
cifi
ce
pS(
1/h)
Concentration (g/L)
a b
c d
e f
0.0 0.5 1.0 1.5
0 5 10 15
Maximum OD
600nm
Concentration (g/L)
Ethyl Acetate Ethyl Propionate Ethyl Butyrate Ethyl Isobutyrate
0.0 0.3 0.6 0.9 1.2 1.5
0.0 2.5 5.0 7.5
Maximum OD
600nm
Concentration (g/L)
Propyl Acetate Isopropyl Acetate Propyl Propionate Isopropyl Propionate Propyl Butyrate Isopropyl Butyrate 0.00
0.25 0.50 0.75
0.0 2.5 5.0 7.5
et
ar
ht
wor
g
cifi
ce
pS(
1/h)
Concentration (g/L)
Fig. 3 Toxic effects of esters on E. coli health based on specific growth rate and maximum OD for a, b ethyl esters, c, d (iso)propyl esters, and e, f
The final esters of interest were the pair of butyl butyrate and isobutyl butyrate. Butyl butyrate was the most toxic compound in this work, prohibiting all growth at any concentrations of 1 g/L or higher (Fig. 3, Addi-tional file 1: Figure S3M). At just 0.75 g/L, specific growth rate was reduced to 0.37 ± 0.03 1/h (60% of the refer-ence) and OD to 0.49 ± 0.14 (~ 35% of the reference). In comparison, isobutyl butyrate limited growth by 30% less (Fig. 3, Additional file 1: Figure S3P), displaying a growth rate of 0.53 ± 0.02 (1/h) at the same concentration. OD was over twofold higher with this compound than with butyl butyrate. Growth at concentrations of 1 g/L of both compounds was prevented.
Like alcohols and acids, we observed a similar trend of toxicity as a function of ester types and concentrations. Increasing ester concentrations increase toxicity for all compounds and shorter chain esters exhibit less toxic effects on microbial growth.
There was a strong linear correlation (R2 > 0.94)
between growth rates and cell mass when E. coli are exposed to alcohols, acids, and esters (Additional file 1: Figure S4). Therefore, E. coli health can be evaluated
based on growth rate and cell mass under all conditions investigated.
Linking physiochemical properties of metabolites and toxic effects
Carbon number
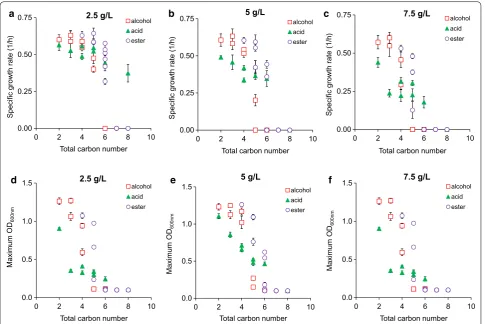
To compare toxic effects of metabolites within and across chemical classes, we first used the total carbon number of a metabolite as a basis. Regardless of chemical types and concentrations, metabolites containing higher car-bon numbers were more inhibitory to E. coli health, reducing both growth rate and cell mass (Fig. 4). Toxic effects of these metabolites were likely caused by mem-brane disruption as seen in some acids and alcohols [25, 27, 40, 41], ionic liquids [42], and surfactants [43]. As the carbon number of a metabolite increases, this metabolite becomes more soluble in the cell’s lipid membrane and less so in aqueous media. This interference likely results in extensive adjustment of cell morphology, primarily cell elongation due to change in membrane fluidity, which is a well-known indicator of high-stress environment and damaged membrane [44]. Although the correlation
0.00 0.25 0.50 0.75
0 2 4 6 8 10
)h/
1(
et
ar
ht
wor
g ci
fic
ep
S
Total carbon number alcohol acid ester
a b c
0.0 0.5 1.0 1.5
0 2 4 6 8 10
D
O
mu
mix
a
M
600nm
Total carbon number alcohol acid ester
0.00 0.25 0.50 0.75
0 2 4 6 8 10
Specific
grow
th rate (1/h)
Total carbon number alcohol acid ester
0.0 0.5 1.0 1.5
0 2 4 6 8 10
Maximum
OD
600nm
Total carbon number alcohol acid ester
0.00 0.25 0.50 0.75
0 2 4 6 8 10
Specific
grow
th rate (1/h)
Total carbon number alcohol acid ester
0.0 0.5 1.0 1.5
0 2 4 6 8 10
Maximum
OD
600nm
Total carbon number alcohol acid ester
2.5 g/L 5 g/L 7.5 g/L
2.5 g/L 5 g/L 7.5 g/L
d e f
Fig. 4 Correlation between the carbon number of a metabolite and its toxic effect on E. coli health based on a–c specific growth rate and d–f
between carbon number and toxic effect of a metabo-lite was prevalent, the strength of this correlation varied among metabolites within and across metabolite classes (Fig. 4). Therefore, carbon number is not an accurate indicator to evaluate the toxic effect of a metabolite.
Chemical functional group
Short-chain alcohols, acids, and esters can exhibit dis-tinct toxic effects on E. coli health. Our results showed that acids inhibited growth more strongly than or simi-larly to alcohols and then esters, for C2–C4 chemicals; however, alcohols became more toxic than organic acids or esters, for ≥ C5 chemicals (Fig. 4). The trend cannot be simply explained alone by the total carbon number of a molecule, but must take into account the chemi-cal functional groups such as the relative polarity of a hydroxyl or a carboxyl group. For example, pentanol and pentanoic acid each have the same carbon number, but pentanol (1.79 D, in debyes) is a less polar pentanoic acid (2.29 D) (Additional file 2: File S2). The higher polarity of pentanoic acid likely makes it less membrane solu-ble than pentanol at identical concentrations, and hence less toxic on microbial growth. Indeed, our data showed that cells grew faster in pentanoic acid (0.52 ± 0.05 1/h) than in pentanol (0.40 ± 0.02 1/h) at 2.5 g/L and yielded higher cell mass (OD = 0.81 ± 0.02 in pentanoic acid ver-sus 0.69 ± 0.04 in pentanol). Another factor that could potentially contribute to the difference in toxicity of alco-hols and acids is steric effect. The larger carboxyl group on organic acids could physically hinder the acid’s abil-ity to enter the membrane, whereas the smaller hydroxyl group could present less resistance.
Chain branching
For the same carbon number and chemical class, chain branching can cause different toxic effects on microbial growth. Our result showed that branched chain isomers of each metabolite are less toxic to microbial growth across all chemical classes (Fig. 4 and Additional file 1: Figures S5–S7). This trend can be clearly seen when cells were exposed to C5 alcohols, esters, and acids. At 2.5 g/L exposure, for instance, cells grew ~ 18% faster in isopentanol (0.48 ± 0.04 1/h) than pentanol (0.40 ± 0.02 1/h), 5% faster in isopentanoic acid (0.56 ± 0.02 1/h) than pentanoic acid (0.55 ± 0.05 1/h), and 10% faster in isopropyl acetate (0.64 ± 0.04 1/h) than propyl acetate (0.59 ± 0.02 1/h). The reduced toxic effects of chain branching can be explained by the impact of membrane solubility. Branched chain isomers are less membrane soluble than their corresponding straight chain isomer at any given chain length due to decreased hydropho-bicity [45] and hence become less toxic to microbial growth.
Ester moieties
Each ester is composed of one alcohol moiety and one acid moiety. Esters containing identical carbon num-ber but different moieties can exert distinct toxic effects on E. coli health. For instance, the difference between ethyl butyrate and butyl acetate is that ethyl butyrate is composed of ethanol and butyric acid moieties, while butyl acetate contains butanol and acetic acid moie-ties. At 2.5 g/L, cells grew ~ 40% slower in butyl acetate (0.3186 ± 0.0207 1/h) than in ethyl butyrate (0.51 ± 0.02
1/h) and also yielded ~ 40% lower cell mass in butyl ace-tate and ethyl butyrate (Fig. 3, Additional file 1: Figure S3). The same trend was consistently observed in many other ester pairs of the same total carbon number. One explanation for this phenomenon is that an ester (e.g.,
Pbutylacetate = 69.18, Additional file 2: File S2) with a longer
chain alcohol moiety is more hydrophobic and hence more toxic than an ester (e.g., Pethylbutyrate = 63.10) with
a shorter chain alcohol moiety. The other explanation is based on the extent of ester hydrolysis, which remains to be proven experimentally. A fraction of esters can be hydrolyzed into alcohol and acid moieties in aqueous media; hence, an ester that releases a longer chain alco-hol is more toxic.
Acid dissociation
For higher carbon numbers, acids appeared less toxic than esters (Fig. 4). For instance, at 7.5 g/L and a total carbon number of 6, cells were still able to grow in acids (hexa-noic acid, pKa = 4.6) but neither in alcohols (hexanol) nor
in esters (ethyl butyrate, butyl acetate, propyl propionate, isopropyl propionate). One possible explanation for this phenotype is acid dissociation that enables it to exist as a monoprotic acid and a conjugate base. The degree of dis-sociation depends on pKa of a metabolite and pH. In our experiments, the fraction of conjugate base dominated because the initial pH of media was adjusted to 7. Since the conjugate base is more hydrophilic than the monoprotic acid, it is less membrane soluble and hence less toxic.
Energy density
Hydrophobicity
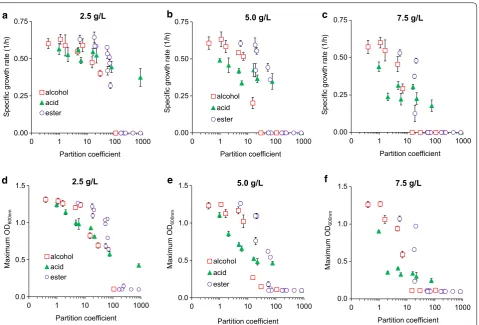
To better capture the toxic effects of metabolites within and across different classes of metabolites, we fur-ther examined metabolite hydrophobicity as a basis for
toxicity. We used partition coefficients to determine and quantitatively compare hydrophobicity of metabolites. We found that for the same carbon number, chemicals have different partition coefficients, depending on chemical 0.00
0.25 0.50 0.75
0 1 10 100 1000
)h/
1(
et
ar
ht
wor
g ci
fic
ep
S
Partition coefficient alcohol
acid ester
0.0 0.5 1.0 1.5
0 1 10 100 1000
D
O
mu
mix
a
M
600n
m
Partition coefficient alcohol
acid ester
0.00 0.25 0.50 0.75
0 1 10 100 1000
Specific
grow
th rate (1/h)
Partition coefficient alcohol
acid ester
0.0 0.5 1.0 1.5
0 1 10 100 1000
Maximum
OD
600n
m
Partition coefficient alcohol
acid ester
0.00 0.25 0.50 0.75
0 1 10 100 1000
Specific
gro
wt
h rate (1/h)
Partition coefficient
0.0 0.5 1.0 1.5
0 1 10 100 1000
Maximum
OD
600n
m
Partition coefficient
2.5 g/L 5.0 g/L 7.5 g/L
a b c
d 2.5 g/L e 5.0 g/L f 7.5 g/L
Fig. 5 Correlation between the hydrophobicity (i.e., partition coefficient) of a metabolite and its toxic effect on E. coli health based on a–c specific growth rate and d–f maximum OD at various initial concentrations of alcohols, acids, and esters in the media
R² = 0.94
R² = 0.91
R² = 0.97
0.00 0.25 0.50 0.75 1.00
0 2 4 6 8 10
ONME
D
Total carbon number Alcohols Acids Esters
R² = 0.98
0.1 1 10 100 1000
0 2 4 6 8 10
Partition
coef
ficient
Total carbon number
a b
R² = 0.92
0 50 100 150 200
0.1 1 10 100 1000
To
tal surface
area (Å
2)
Partition coeficient
c
functional groups and chain branching (Additional file 2: File S2). For instance, partition coefficients of pentanol, isopentanol, pentanoic acid, isopentanoic acid, ethyl pro-pionate, and propyl acetate are 29.5, 15.1, 21.9, 16.2, 20.9, and 19.1, respectively. Experimentally, we observed that pentanol was more toxic than isopentanol, pentanoic acid was more toxic than isopentanoic acid, and ethyl propion-ate was more toxic than propyl acetpropion-ate; pentanol with the highest partition coefficient was the most toxic molecule among the C5 chemicals investigated in this study.
Regardless of metabolite types and concentrations, a correlation existed between hydrophobicity of a metabo-lite and its toxic effect on microbial growth (Fig. 5). As partition coefficients increased, negative effects on spe-cific growth rates and ODs also increased. The negative effects became amplified when cells were exposed to higher chemical concentrations. Among different classes of metabolites examined in this study, alcohols became more toxic than acids and esters for higher partition coef-ficients (logP ≥ 10). In contrast, esters appeared to be least toxic among different classes of metabolites for lower par-tition coefficients (logP ≤ 10). We observed that all com-pounds that prevented growth at concentrations greater than 2.5 g/L have a partition coefficient at least ~ 250 times greater than that of ethanol. Every branched chain isomer in this work was shown to be less toxic than the associated straight chain isomer (Additional file 1: Fig-ures S5–7, Additional file 2: File S2), and in each case the branched chain has a lower partition coefficient than the straight chain compound. Hydrophobicity can differenti-ate the toxic effects between not only linear and branched molecules but also two esters having an identical carbon number but different alcohol and acid moieties.
Hydrophobicity of a metabolite and its effect on micro-bial growth can be explained by hydrophobic interaction between the metabolite and cell membrane. As partition coefficients increase, metabolites likely become more membrane soluble and disrupt lipid membranes, which enhance degrees of toxicity and alter cell morphology more severely [46–48]. Remarkably, we found that there existed strong correlations among partition coefficients, carbon numbers, and total surface areas of metabolites (Fig. 6b, c). Different from the total carbon numbers and total surface areas, hydrophobicity can better predict toxicity differences among molecules (Fig. 5). Taken alto-gether, hydrophobicity is a quantitative predictor to eval-uate the toxic effect of a metabolite on microbial health.
Conclusions
Analysis of a comprehensive list of short-chain alcohols, acids, and esters shows distinctive toxic effects of these metabolites on E. coli health. Alcohols are most toxic fol-lowed by acids and esters at identical concentrations and
total carbon counts. Regardless of metabolite classes and concentrations, longer chain metabolites inhibit micro-bial growth more than the shorter chain ones. Branched chain metabolites are less toxic than straight chain ones with the same total carbon count. Remarkably, for the same total carbon counts, esters having longer chain alco-hol moieties are more inhibitory than those having short-chain alcohol moieties. Hydrophobicity of a metabolite is a good quantitative index to determine its toxic effect on microbial health. Since this study focuses on character-izing the toxic effects of fermentative metabolites on an industrial workhorse gram-negative bacterium E. coli, it is of particular interest to further explore in the future whether the trends found in this study exist in other bac-terial, eukaryotic, and archaeal species. Although it is not the focus of the study, fermentative metabolites can cause cytotoxicity when they are present inside the cells beyond membrane damage [23, 24, 49]. Overall, this study sheds light on the toxic effects of fermentative metabolites with distinct characteristics on microbial growth and helps in the selection of desirable metabolites and hosts for indus-trial fermentation to overproduce them.
Methods
Medium and cell culturing
For all E. coli MG1655 (DE3) characterization experi-ments, modified M9 medium (pH ~ 7) was used, consist-ing of 100 mL/L of 10X M9 salts, 1 mL/L of 1 M MgSO4,
100 μL/L of 1 M CaCl2, 1 mL/L of stock thiamine HCl
solution (1 g/L), 1 ml/L of stock trace metal solution, 10 g/L glucose, and 5 g/L yeast extract [50]. 10X M9 salts are composed of 70 g/L Na2HPO4·H2O, 30 g/L KH2PO4,
5 g/L NaCl, and 10 g/L NH4Cl. Alcohols, esters, and
acids were added at necessary concentrations into flasks of partitioned media. Media with the chemicals of inter-est were then transferred from the flasks to 28-mL Balch tubes and capped with rubber stoppers and aluminum seals to create anaerobic environment. In cases where chemical solubility prevented making well-mixed stocks of media and compounds, each chemical was added via a Hamilton glass syringe to the tube described above. After the addition of each chemical, media were pH adjusted to 7 with 5 M KOH. Alcohols, acids, and esters were studied at varying concentrations based on a combination of fac-tors including solubility and observed toxicity.
Stock cells from the − 80 °C freezer were streaked onto lysogeny broth (LB)-agar plates and then were grown overnight in flasks containing 50 mL of the modified M9 medium in a New Brunswick Excella E25 incubator at 37 °C and 175 rpm until OD600nm (optical density
50 mL of the same medium to OD = 1.0 and grown once again to OD = 2.5. Cells were transferred to nitrogen-sparged, anaerobic culture Balch tubes containing 20 mL of media at initial OD = 0.1 to begin growth characteri-zation on a 75° angled platform under identical condi-tions. Cell culture densities were measured throughout 24-h fermentation. All experiments were performed in at least 3 biological replicates.
Data collection and analysis Partition coefficient
Partition coefficient, a measure of hydrophobicity of a metabolite, was calculated as follows:
where Pi is the partition coefficient of metabolite i and
Sioctanol and Siwater (g/L) are the solubilities of metabolite
i in octanol and water, respectively. Pi was calculated at room temperature and atmospheric pressure using the Molinspiration Cheminformatics interactive log(P) calculator [51]. The input for this calculator used the SMILES chemical notation acquired from PubChem [52].
ONMED
Octane Normalized Mass Energy Density (ONMED) was calculated as the ratio of standard heat of combustion of a metabolite to that of octane (~ 44.5 kJ/kg) [18] where the standard heat of combustion of each chemical was estimated based on average bond energies [53].
Polarity
The polarity of molecules, in debyes (D), was estimated using MolCalc [54], a web application for estimating physiochemical properties of a molecule.
Total surface area
The total surface area of a molecule (A2, where A is the
Angstrom unit, 1A = 10−10 m) was calculated using
Mol-Calc [54].
Specific growth rate
First-order kinetics was applied to calculate a specific growth rate from kinetic measurement of cell growth as follows:
where μ (1/h) is the specific growth rate, CX (g/L) is the cell titer, and t (h) is the culturing time. Note that in our study cell titer was estimated from the measured OD with a correlation of 1 OD ~ 0.5 g DCW/L.
(1)
log10Pi=log10
Soctanoli Swateri
,
(2)
µ=
1 CX ·
dCX dt ,
Abbreviations
μ: specific growth rate; CX: cell concentration; DCW: dry cell weight; OD:
optical density; ONMED: octane normalized mass energy density; Pi: partition
coefficient of metabolite i; Sioctanol and Siwater: solubilities of metabolite i in
octanol and water, respectively; t: time; h: hour; D: debyes; A: angstrom.
Authors’ contributions
CTT conceived and supervised the study. CTT and BW designed the experi-ments, analyzed the data, and drafted the manuscript. BW performed the experiments. Both authors read and approved the final manuscript.
Author details
1 Department of Chemical and Biomolecular Engineering, University of
Ten-nessee, 1512 Middle Drive, Knoxville, TN 37996, USA. 2 Bioenergy Science
Center, Oak Ridge National Laboratory, Oak Ridge, USA.
Acknowledgements
This research was financially supported in part by the NSF CAREER award (NSF#1553250) and the DOE subcontract Grant (DE-AC05-000R22725) by the BioEnergy Science Center (BESC), the U.S. Department of Energy Bioenergy Research Center funded by the Office of Biological and Environmental Research in the DOE Office of Science.
Competing interests
The authors declare that they have no competing interests.
Availability of supporting data
Additional files 1 and 2 contain supporting data.
Consent for publication
The authors consent for publication.
Ethical approval and consent to participate
Not applicable.
Funding
This research was financially supported in part by the NSF CAREER Award (NSF#1553250) and the DOE subcontract Grant (DE-AC05-000R22725) by the BioEnergy Science Center (BESC), the U.S. Department of Energy Bioenergy Research Center funded by the Office of Biological and Environmental Research in the DOE Office of Science.
Publisher’s Note
Springer Nature remains neutral with regard to jurisdictional claims in pub-lished maps and institutional affiliations.
Received: 18 July 2017 Accepted: 2 November 2017
References
1. Smith PM, Howitt MR, Panikov N, Michaud M, Gallini CA, Bohlooly YM, Glickman JN, Garrett WS. The microbial metabolites, short-chain fatty acids, regulate colonic Treg cell homeostasis. Science. 2013;341(6145):569–73.
2. Agler MT, Wrenn BA, Zinder SH, Angenent LT. Waste to bioproduct con-version with undefined mixed cultures: the carboxylate platform. Trends Biotechnol. 2011;29(2):70–8.
Additional files
3. Ingram L, Conway T, Clark D, Sewell G, Preston J. Genetic engineer-ing of ethanol production in Escherichia coli. Appl Environ Microbiol. 1987;53(10):2420–5.
4. Trinh C, Srienc F. Metabolic engineering of Escherichia coli for effi-cient conversion of glycerol to ethanol. Appl Environ Microbiol. 2009;75(21):6696–705.
5. Hanai T, Atsumi S, Liao J. Engineered synthetic pathway for isopropanol production in Escherichia coli. Appl Environ Microbiol. 2007;73(24):7814–8. 6. Inui M. Expression of Clostridium acetobutylicum butanol synthetic genes
in Escherichia coli. Appl Microbiol Biotechnol. 2008;77(6):1305–16. 7. Atsumi S, Hanai T, Liao JC. Non-fermentative pathways for synthesis of
branched-chain higher alcohols as biofuels. Nature. 2008;451(7174):86–9. 8. Tseng H-C, Prather KL. Controlled biosynthesis of odd-chain fuels and
chemicals via engineered modular metabolic pathways. Proc Natl Acad Sci. 2012;109(44):17925–30.
9. Dekishima Y, Lan EI, Shen CR, Cho KM, Liao JC. Extending carbon chain length of 1-butanol pathway for 1-hexanol synthesis from glucose by engineered Escherichia coli. J Am Chem Soc. 2011;133(30):11399–401. 10. Nakamura CE, Whited GM. Metabolic engineering for the microbial
production of 1,3-propanediol. Curr Opin Biotechnol. 2003;14(5):454–9. 11. Yim H, Haselbeck R, Niu W, Pujol-Baxley C, Burgard A, Boldt J,
Khan-durina J, Trawick JD, Osterhout RE, Stephen R. Metabolic engineering of
Escherichia coli for direct production of 1, 4-butanediol. Nat Chem Biol. 2011;7(7):445–52.
12. Causey T, Shanmugam K, Yomano L, Ingram L. Engineering Escherichia coli for efficient conversion of glucose to pyruvate. Proc Natl Acad Sci USA. 2004;101(8):2235–40.
13. Chang D-E, Jung H-C, Rhee J-S, Pan J-G. Homofermentative production of d-orl-lactate in metabolically engineered Escherichia coli RR1. Appl Environ Microbiol. 1999;65(4):1384–9.
14. Torella JP, Ford TJ, Kim SN, Chen AM, Way JC, Silver PA. Tailored fatty acid synthesis via dynamic control of fatty acid elongation. Proc Natl Acad Sci. 2013;110(28):11290–5.
15. Sánchez AM, Bennett GN, San K-Y. Novel pathway engineering design of the anaerobic central metabolic pathway in Escherichia coli to increase succinate yield and productivity. Metab Eng. 2005;7(3):229–39. 16. Yu JL, Xia XX, Zhong JJ, Qian ZG. Direct biosynthesis of adipic acid from
a synthetic pathway in recombinant Escherichia coli. Biotechnol Bioeng. 2014;111(12):2580–6.
17. Rodriguez GM, Tashiro Y, Atsumi S. Expanding ester biosynthesis in
Escherichia coli. Nat Chem Biol. 2014;10(4):259–65.
18. Layton DS, Trinh CT. Microbial synthesis of a branched-chain ester platform from organic waste carboxylates. Metab Eng Commun. 2016;3:245–51.
19. Layton DS, Trinh CT. Expanding the modular ester fermentative pathways for combinatorial biosynthesis of esters from volatile organic acids. Biotechnol Bioeng. 2016;113(8):1764–76.
20. Layton DS, Trinh CT. Engineering modular ester fermentative pathways in
Escherichia coli. Metab Eng. 2014;26:77–88.
21. Warnecke T, Gill RT. Organic acid toxicity, tolerance, and production in
Escherichia coli biorefining applications. Microb Cell Fact. 2005;4(1):25. 22. Jarboe LR, Royce LA, Liu P. Understanding biocatalyst inhibition by
car-boxylic acids. Front Microbiol. 2013;4:272.
23. Brynildsen MP, Liao JC. An integrated network approach identifies the isobutanol response network of Escherichia coli. Mol Syst Biol. 2009;5(1):277. 24. Atsumi S, Wu TY, Machado IM, Huang WC, Chen PY, Pellegrini M, Liao JC.
Evolution, genomic analysis, and reconstruction of isobutanol tolerance in Escherichia coli. Mol Syst Biol. 2010;6(1):449.
25. Huffer S, Clark ME, Ning JC, Blanch HW, Clark DS. Role of alcohols in growth, lipid composition, and membrane fluidity of yeasts, bacteria, and archaea. Appl Environ Microbiol. 2011;77(18):6400–8.
26. Lennen RM, Kruziki MA, Kumar K, Zinkel RA, Burnum KE, Lipton MS, Hoover SW, Ranatunga DR, Wittkopp TM, Marner WD, et al. Membrane stresses induced by overproduction of free fatty acids in Escherichia coli. Appl Environ Microbiol. 2011;77(22):8114–28.
27. Royce LA, Liu P, Stebbins MJ, Hanson BC, Jarboe LR. The damaging effects of short chain fatty acids on Escherichia coli membranes. Appl Microbiol Biotechnol. 2013;97(18):8317–27.
28. Zaldivar J, Ingram LO. Effect of organic acids on the growth and fermentation of ethanologenic Escherichia coli LY01. Biotechnol Bioeng. 1999;66(4):203–10.
29. Nicolaou SA, Gaida SM, Papoutsakis ET. A comparative view of metabolite and substrate stress and tolerance in microbial bioprocessing: from biofuels and chemicals, to biocatalysis and bioremediation. Metab Eng. 2010;12(4):307–31.
30. Lennen RM, Pfleger BF. Modulating membrane composition alters free fatty acid tolerance in Escherichia coli. PLoS ONE. 2013;8(1):e54031. 31. Sherkhanov S, Korman TP, Bowie JU. Improving the tolerance of
Escheri-chia coli to medium-chain fatty acid production. Metab Eng. 2014;25:1–7. 32. Tan Z, Yoon JM, Nielsen DR, Shanks JV, Jarboe LR. Membrane
engineer-ing via trans unsaturated fatty acids production improves Escheri-chia coli robustness and production of biorenewables. Metab Eng. 2016;35:105–13.
33. Dunlop MJ, Dossani ZY, Szmidt HL, Chu HC, Lee TS, Keasling JD, Hadi MZ, Mukhopadhyay A. Engineering microbial biofuel tolerance and export using efflux pumps. Mol Syst Biol. 2011;7(1):487.
34. Zingaro KA, Papoutsakis ET. GroESL overexpression imparts Escherichia coli tolerance to i-, n-, and 2-butanol, 1, 2, 4-butanetriol and ethanol with complex and unpredictable patterns. Metab Eng. 2013;15:196–205. 35. Trček J, Mira NP, Jarboe LR. Adaptation and tolerance of bacteria against
acetic acid. Appl Microbiol Biotechnol. 2015;99(15):6215–29. 36. Woodruff LB, Boyle NR, Gill RT. Engineering improved ethanol
produc-tion in Escherichia coli with a genome-wide approach. Metab Eng. 2013;17:1–11.
37. Sandoval NR, Kim JY, Glebes TY, Reeder PJ, Aucoin HR, Warner JR, Gill RT. Strategy for directing combinatorial genome engineering in Escherichia coli. Proc Natl Acad Sci. 2012;109(26):10540–5.
38. Zaldivar J, Martinez A, Ingram LO. Effect of alcohol compounds found in hemicellulose hydrolysate on the growth and fermentation of ethanolo-genic Escherichia coli. Biotechnol Bioeng. 2000;68(5):524–30.
39. Knoshaug EP, Zhang M. Butanol tolerance in a selection of microorgan-isms. Appl Biochem Biotechnol. 2009;153(1–3):13–20.
40. Alakomi H-L, Skyttä E, Saarela M, Mattila-Sandholm T, Latva-Kala K, Helander I. Lactic acid permeabilizes gram-negative bacteria by disrupt-ing the outer membrane. Appl Environ Microbiol. 2000;66(5):2001–5. 41. DiRienzo JM, Inouye M. Lipid fluidity-dependent biosynthesis and
assem-bly of the outer membrane proteins of E. coli. Cell. 1979;17(1):155–61. 42. Cho C-W, Pham TPT, Jeon Y-C, Vijayaraghavan K, Choe W-S, Yun Y-S.
Toxicity of imidazolium salt with anion bromide to a phytoplankton
Selenastrum capricornutum: effect of alkyl-chain length. Chemosphere. 2007;69(6):1003–7.
43. Garcia M, Campos E, Sanchez-Leal J, Ribosa I. Effect of the alkyl chain length on the anaerobic biodegradability and toxicity of quaternary ammonium based surfactants. Chemosphere. 1999;38(15):3473–83. 44. Dombek KM, Ingram L. Effects of ethanol on the Escherichia coli plasma
membrane. J Bacteriol. 1984;157(1):233–9.
45. Ingólfsson HI, Andersen OS. Alcohol’s effects on lipid bilayer properties. Biophys J. 2011;101(4):847–55.
46. Wong P, Chau Y, Kramar O, Bengert G. Structure–toxicity relationship of tin compounds on algae. Can J Fish Aquat Sci. 1982;39(3):483–8. 47. Sikkema J, De Bont J, Poolman B. Interactions of cyclic hydrocarbons with
biological membranes. J Biol Chem. 1994;269(11):8022–8.
48. Sikkema J, De Bont J, Poolman B. Mechanisms of membrane toxicity of hydrocarbons. Microbiol Rev. 1995;59(2):201–22.
49. Royce LA, Boggess E, Fu Y, Liu P, Shanks JV, Dickerson J, Jarboe LR. Tran-scriptomic analysis of carboxylic acid challenge in Escherichia coli: beyond membrane damage. PLoS ONE. 2014;9(2):e89580.
50. Trinh CT, Li J, Blanch HW, Clark DS. Redesigning Escherichia coli metabo-lism for anaerobic production of isobutanol. Appl Environ Microbiol. 2011;77(14):4894–904.
51. Mannhold R, Poda GI, Ostermann C, Tetko IV. Calculation of molecular lipophilicity: state-of-the-art and comparison of log P methods on more than 96,000 compounds. J Pharm Sci. 2009;98(3):861–93.
52. Acland A, Agarwala R, Barrett T, Beck J, Benson DA, Bollin C, Bolton E, Bry-ant SH, Canese K, Church DM. Database resources of the national center for biotechnology information. Nucleic Acids Res. 2014;42(D1):D7–19. 53. Zumdahl SS, Susan A. Chemistry. 5th ed. Boston: Houghton Mifflin; 2000. 54. Jensen JH, Kromann JC. The molecule calculator: a web application for