Adopting Federal Approaches for Assessing
Health Impacts and Economic Benefits of State
Air Quality Regulations
Laura A. Gladson, Kevin R. Cromar, Anna M. Weshner-‐Dunning
Maron Institute of Urban Management, New York University
60 5th Avenue, 2nd Floor, New York, NY 10011
Corresponding author:
[email protected]
Keywords:
air pollution; environmental policy; cost-benefit analysis; public opinion
Executive Summary:
Air quality regulations are intended to reduce adverse impacts to human health and the environment. Because efforts to improve air quality are not without cost, the U.S. EPA conducts cost-‐benefit analysis to assess the health and economic impacts of air pollution abatement policies. Under the current EPA administration, it is expected that responsibility for environmental regulation will increasingly shift to state governments, some of which have little experience in conducting health and economic assessments as part of the rulemaking process. Utilizing real-‐world air pollution data in conjunction with health risk estimates derived from the epidemiological literature, a scientific survey was created to assess whether local valuations of improved air quality can be effectively estimated using federal cost-‐benefit analysis methods. Results from both high and low pollution cities found that median valuations for improved air quality from survey responses were of similar magnitude to valuations used in federal cost-‐benefit analysis, suggesting federal methods may be suitable for use at the local level. These methods can be augmented with information regarding local preferences; for example, a majority of the study population was unwilling to accept reduced energy bill costs in exchange for higher pollution levels in their communities. In the absence of state-‐specific approaches, states are encouraged to adopt existing federal policy assessment tools and to fully consider the health impacts of air pollution as part of their own regulatory review processes.
I. Shift from federal to state responsibility for environmental regulation
The U.S. federal government has been the primary regulator of air pollution emissions and ambient outdoor air pollution concentrations since the passage of the Clean Air Act. However, it is the intention of the current EPA Administrator to shift the balance of regulatory responsibility from the federal government to individual states. In May 2016, now-‐Administrator Scott Pruitt declared before the House Science Committee that, while recognizing a role for the EPA in some trans-‐state pollution issues, the federal administration “was
never intended to be our nation’s foremost environmental regulator. The states were to have
regulatory primacy”.1 In his Senate Committee
hearing this year, he reaffirmed this position and emphasized the need to respect states as the major
environmental regulators.2 Administrator Pruitt has
also defended a proposed 31% cut to EPA funding by
1 House Committee on Science, Space and Technology
Subcommittee on Environment, Testimony before the House Committee.
2 Committee on Environment and Public Works, EPA
arguing that states have both the capacity and
responsibility to pick up the slack from the federal
government for environmental regulation.3
Consideration of the health impacts of air pollution is an institutionalized part of federal rulemaking processes, but not all states have established procedures for assessing the health impacts and associated economic benefits of air quality regulation. Instead, state regulations are often based primarily on public opinion and lawmaker
intuition rather than concrete analysis. 4 A
systematic evaluation of the use of cost-‐benefit analysis in the United States found that the majority of states fail to consistently analyze their
environmental regulations before implementation.5
If states are to take on a greater regulatory role in managing environmental risks, it is important that the public health impacts of air pollution are fully accounted for as part of the regulatory process. The former head of the Office of Information and Regulatory Affairs has recommended that state-‐level analyses should mimic methods used at the national level and that state air quality regulators should
adopt the same methods performed by the EPA.6
This would include making quantitative estimates of the health impacts attributable to changes in air quality and then estimating the economic values of these impacts through the use of benefit transfer
methods.7 However, one potential drawback of this
recommendation is that critical differences may exist in air pollution valuation between and within
regions, resulting from demographic and
environmental heterogeneity, and that such differences may be lost in methods designed to
predict economic valuations on a national scale.8
Here, we present the findings of a scientific survey designed to assess the suitability of federal regulatory review methods in representing local preferences and valuations for changes in outdoor air pollution concentrations.
3 Lehmann et al., "Trump Budget Cuts Funds."
4 Glaeser and Sunstein, "Moneyball for State Regulators." 5 MacArthur Foundation, State's use of Cost-‐Benefit
Analysis.
6 Glaeser and Sunstein, "Moneyball for State Regulators." 7 U.S. Office of Management and Budget, Circular A-‐4. 8 Tra, "Measuring the General Equilibrium Benefits," 291-‐
307.
II. Assessing the suitability of federal valuation methods at the local level
A survey tool consisting of multi-‐level dichotomous choice question sets and a dual-‐response anchored best-‐worst scaling model was developed in order to assess the suitability of adopting methods used for federal regulatory processes at the state level (see survey question sets in Appendix A). These approaches are similar to those used in other public valuation surveys, which determined willingness to
pay values for use in cost-‐benefit analysis.9 In this
case, however, the purpose was not to calculate specific valuations, but rather to make a general comparison of locally reported values to those predicted by federal methodologies. As such, there was sufficient power to complete the analysis using smaller sample sizes compared to previous studies
with more quantitative objectives.10
The survey was administered during the summer of 2016 in Asheville, North Carolina, and Lehi, Utah. A combination of stratified and cluster sampling by income status was used to randomly select six Census Block Groups in each city, where sampling would take place. A total of 188 households completed the survey. The primary difference between these two cities, and the reason for their inclusion this study, is that outdoor air quality is substantially worse in Lehi as compared to Asheville. From 2013-‐2015 there was an average of 35 days
per year in Lehi with 8-‐hour maximum ozone (O3)
concentrations above 60 ppb (compared to 8 such days in Asheville), and 21 days per year with 24-‐
hour fine particulate matter (PM2.5) concentrations
over 25 µg/m3 (compared to 0 such days in
Asheville). These values place Lehi, Utah as the 6th most polluted city in the United States for short-‐
term PM2.5 concentrations, while Asheville, North
Carolina is one of the cleanest.11
9 Flynn et al., "Best–worst Scaling," 171-‐189; Lagerkvist et
al., "Anchored vs. Relative Best–Worst Scaling”; Langford et al., "A Multilevel Modelling Approach,” 197-‐211; Louviere et al., Best-‐Worst Scaling; Loose and Lockshin, "Testing the Robustness of Best Worst Scaling.”
10 Rizzi et al., Valuing Air Quality Impacts; Yoo et al., "Using
a Choice Experiment 308-‐318.
Real-‐world scenarios based on regional pollution
data were created for survey participants. Unlike previous studies using similar models to assess
regional valuation of air pollution,12 starting bids in
the present survey were not arbitrary, but based on values estimated using federal regulatory review methodologies which price the health impacts of changes in air pollution. This was done using local air pollution data, concentration-‐response functions from epidemiology studies, and age-‐specific
mortality baseline health risks.13 Similar methods
have been used in other studies to assess health
impacts associated with changes in air quality.14
Statistical analysis of survey results was completed using NLOGIT Version 6, a software package built
specifically for handling choice analysis data.15
Controlling for individual-‐ and community-‐level covariates, linear regression models were used for predicting continuous outcome variables, while binomial probit models were used to predict binary response types.
III. Preferences and valuations of air pollution in high and low pollution cities
Locally derived values for improvements in air
quality were estimated from multi-‐level
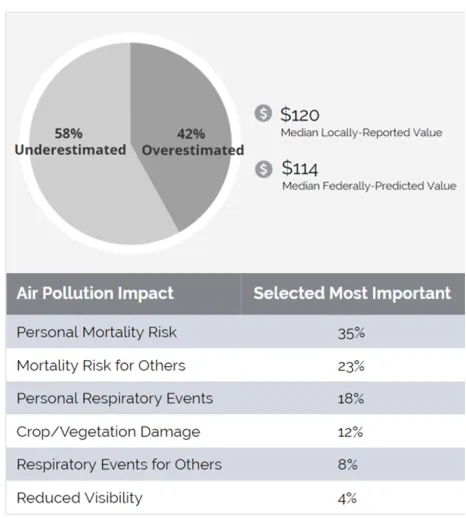
dichotomous choice questions. Comparing these values to those estimated using quantitative risk assessment and benefit transfer approaches used by the U.S. EPA provides insight into the suitability of using federal methodologies at the state level. Local valuations were well represented by federal methodologies in this two-‐city sample: the median reported values respondents were willing to pay in increased energy costs for improvements in air quality was $120, while median valuations estimated using federal methodologies was $114. In the high pollution city, age and income were both significantly associated with a likelihood of having reported valuations for improvements in air quality be underestimated using federal cost benefit methods; no such associations were observed for
12 Bosworth et al., "Demand for Environmental Policies,"
293-‐308; Rizzi et al., Valuing Air Quality Impacts; Yoo et al., "Using a Choice Experiment," 308-‐318.
13 Fann et al., "Improving the Linkages," 1671-‐1675. 14 Cromar et al., "American Thoracic Society and Marron
Institute Report, 1195; Grabow et al., "Air Quality and Exercise-‐Related Health Benefits,” 68-‐76.
15 William H. Greene, NLOGIT Version 6.0.
respondents in the low pollution city. Overall, 58% of individuals indicated that they were willing to pay more for pollution abatement than predicted by federal methodologies, with the remaining 42% willing to pay less than predicted.
While the vast majority of the economic benefits estimated for reductions in outdoor air pollution
correspond to changes in personal mortality risk,16
the results of the dual-‐response anchored best-‐worst scaling model indicate that there are other health and non-‐health attributes of air pollution that drive
local willingness to pay for improved air quality.17
The most important attributes of air pollution abatement among survey respondents were: personal mortality risk (35% of respondents indicated this was most important to them); mortality risk for other people (23%); personal respiratory risk (18%); damage to crops/vegetation (12%); respiratory risk for other people (8%); and reduced air visibility (4%). However, specific preferences regarding the attributes of air pollution that are most important to individual respondents were not significantly associated with differences in reported willingness to pay values for improvements in air quality. General survey results are summarized in Figure 1.
In order to further identify underlying heterogeneity in local preferences, respondents were qualitatively grouped by their willingness to pay higher energy costs for improvements in air quality and their willingness to accept lower energy costs for worse air quality. Qualitative categorization of respondents' preferences into the four potential combinations of preferences (i.e., combination of binary categorization of two independent variables)
16 U.S. EPA, The Benefits and Costs of the Clean Air Act;
Avnery et al., "Global Crop Yield Reductions, 2297-‐2309; Brewer and Moore, "Source Contributions to Visibility Impairment,” 1070-‐1081; Chang et al., "Particulate Pollution and the Productivity of Pear Packers," 141-‐169; Hyslop, "Impaired Visibility," 182-‐195; Laumbach, "Outdoor Air Pollutants and Patient Health," 175; Laumbach and Kipen, "Respiratory Health Effects of Air Pollution,” 3-‐11; Murphy et al., "The Cost of Crop Damage,” 273-‐289; Sajjad et al., "Climate Change and Air Pollution," 12403-‐12418; Swackhamer and King, Review of Valuing Mortality Risk.
are illustrated using indifference curves, which
compare how individuals make trade-‐offs between
two utilities,18 as shown in Figure 2. The vast
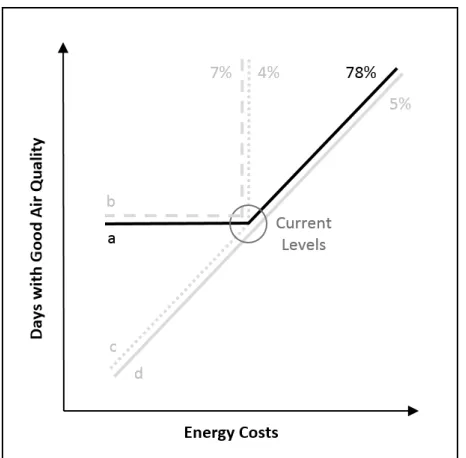
majority of respondents (77%) were categorized as being willing to pay for improvements in air quality but not willing to accept lower energy costs if it resulted in worse air quality. Combining this with the 7% of individuals who were unwilling to accept any changes in energy cost for changes in air quality (e.g., protest responses and/or respondents that favor the status quo), a total of 84% of the sample population was unwilling to accept lower energy costs in exchange for more days with bad air quality. These categorizations are not based on the quantified amount that respondents are willing to pay for improved air quality, nor is it expected that these numbers are generalizable for all locations in the United States, but they do provide an example of qualitative information regarding local preferences of air pollution that state agencies may find useful to consider as part of the policymaking process.
IV. Recommendations for local review of air quality regulations
With the anticipated shift of environmental regulatory power from the federal government to local jurisdictions, the role of regulating air pollution, as well as other environmental risks, will increasingly fall on state agencies. With this new responsibility, many local policymakers will likely need to increase their capacity for estimating health and economic benefits of air quality mitigation. While there is no one best method for quantification of these impacts, it is important that there be some concrete analytical approach in place to adequately inform rulemaking at the state level.
It is essential that public health impacts are fully considered by states when proposed regulations are expected to result in changes to air quality. The established methods used by federal agencies are well equipped to assess health impacts of changes in air pollution at the local level for a wide range of
different air pollutants.19 Even if no benefit transfer
is applied in order to monetize the economic value of
18 Srivastava and Ganguly, "Indifference Curves as a Tool,"
513-‐519.
19 Cromar et al., "American Thoracic Society and Marron
Institute Report," 1195; Gwinn et al., "Meeting Report: Estimating the Benefits,” 125-‐130.
these impacts, states should include quantification of the health impacts of air pollution as a standard part of any rulemaking process.
For states interested in quantifying the economic benefits of the health impacts attributable to improvements in air quality as part of a cost-‐benefit analysis, it is recommended that they use the same methods as federal agencies in the absence of other state-‐specific approaches. On average, the willingness to pay for improved air quality, as derived from local surveys in a high and low pollution city, was well estimated by the values calculated using federal cost-‐benefit analysis tools. However, the ability to reasonably estimate the average economic benefits at the population-‐level for changes in air pollution does not mean that the preferences of individuals are perfectly represented. Federal methods for completing cost-‐benefit analysis results in benefits that are driven almost entirely by changes in mortality risk, which may explain why younger respondents, with their much lower mortality rates than older individuals, were found to be willing to pay more for improved air quality than estimated using methods derived from federal agencies. Federal methods also place a
greater emphasis on policies that reduce PM2.5 and
O3 since these pollutants are most strongly
associated with mortality risk and are currently the only pollutants that are quantitatively assessed in
federal cost-‐benefit analysis.20 States may need to
consider alternative approaches in assessing the economic benefits of reducing other significant air
pollutants.21
The recommendation for states to use the same cost-‐ benefit methods as federal agencies does not preclude the opportunity to also assess and incorporate local preferences into health and economic analysis. One potential advantage of completing cost-‐benefit analysis at the state level is the ability to consider the underlying heterogeneity of preferences regarding air pollution abatement that is not accounted for in national-‐level analyses. For example, EPA Administrator Pruitt cited the
20 Jesse D. Berman et al., "Health Benefits from Largescale
Ozone Reductions,” 1404-‐1410; Davidson et al., "Analysis of PM2.5,” 332-‐346; U.S. EPA, The Benefits and Costs of the Clean Air Act.
desire to lower consumer electricity prices (along
with federal overreach) as justification for repealing
the Clean Power Plan.22 However, analysis of survey
responses in both a high and low pollution city revealed a strong aversion to lower energy costs in exchange for worsening of local air quality. For these and other locations with similar preferences, it may be advisable to continue with plans to reduce emission reductions from power plants that would have been required under the Clean Power Plan, even if states are no longer required to do so by federal law.
Finally, while this paper provides recommendations for how states can best adapt to their likely increased role in establishing air quality regulations, it is not an endorsement of the trend away from federal air quality regulation. Air pollution is a trans-‐boundary challenge that is difficult to fully
address at the state level.23 Additionally, while those
in favor of the shift to state regulation argue that local citizens can respond to unsatisfying conditions
by simply moving away,24 there is actually strong
evidence that individuals’ air pollution preferences do not consistently match up with local conditions. This is because primary factors other than air quality are involved in residential decisions, such as job utility, home prices, educational opportunities, and the financial and emotional burdens of
relocation.25 Thus, air quality conditions are not
necessarily a reflection of local pollution preferences, and state policymakers should not assume that their constituents are satisfied with existing pollution levels simply because they choose not to leave. Inclusion of concrete quantitative analysis will help state policymakers avoid the pitfalls of false intuition regarding local preferences for air quality regulation.
22 Date et al., 'This Week' Transcript 3-‐26-‐17.” 23 Hutchinson and Kennedy, "State Enforcement of
Federal Standards,” 316-‐344.
24 Schoenbrod, Why States, Not EPA, should Set Pollution
Standards.
References
1. American Lung Association. State of the Air 2016: 2016.
2. Avnery, Shiri, Denise L. Mauzerall, Junfeng Liu, and Larry W. Horowitz. "Global Crop Yield Reductions due to Surface Ozone Exposure: 2. Year 2030 Potential Crop Production Losses and Economic Damage Under Two Scenarios of O3 Pollution." Atmospheric Environment 45, no. 13 (Apr, 2011): 2297–309. doi:10.1016/j.atmosenv.2011.01.002.
3. Bayer, Patrick, Nathaniel Keohane, and Christopher Timmins. "Migration and Hedonic Valuation: The Case of Air Quality." Journal of Environmental Economics and Management 58, no. 1 (2009): 1–14. doi:10.1016/j.jeem.2008.08.004.
http://www.sciencedirect.com/science/article/pii/S 0095069609000035.
4. Berman, Jesse D., Neal Fann, John W. Hollingsworth, Kent E. Pinkerton, William N. Rom, Anthony M. Szema, Patrick N. Breysse, Ronal H. White, and Frank C. Curriero. "Health Benefits from Largescale Ozone Reduction in the United States." Environmental Health Perspectives 120, (Oct, 2012): 1404–10.
5. Bosworth, Ryan, Trudy A. Cameron, and J. R. DeShazo. "Demand for Environmental Policies to Improve
Health: Evaluating Community-‐Level Policy
Scenarios." Journal of Environmental Economics and Management 57, (October 10, 2008): 293–308. 6. Brewer, Patricia and Tom Moore. "Source
Contributions to Visibility Impairment in the Southeastern and Western United States." Journal of the Air & Waste Management Association 59, no. 9 (Sep 1, 2009): 1070–81. doi:10.3155/1047-‐ 3289.59.9.1070.
http://www.tandfonline.com/doi/abs/10.3155/1047 -‐3289.59.9.1070.
7. Chang, Tom, Joshua Graff Zivin, Tal Gross, and Matthew Neidell. "Particulate Pollution and the Productivity of Pear Packers." American Economic Journal: Economic Policy 8, no. 3 (Aug, 2016): 141–69. doi:10.1257/pol.20150085.
http://search.proquest.com/docview/1807277615. 8. Cromar, Kevin R., Laura A. Gladson, Lars D. Perlmutt,
Marya Ghazipura, and Gary W. Ewart. "American Thoracic Society and Marron Institute Report.
Estimated Excess Morbidity and Mortality Caused by Air Pollution Above American Thoracic Society-‐ Recommended Standards, 2011-‐2013." Annals of the American Thoracic Society 13, no. 8 (Aug, 2016): 1195. doi:10.1513/AnnalsATS.201602-‐103AR.
http://www.ncbi.nlm.nih.gov/pubmed/27509145. 9. Date, Jack, Pete Madden, Matthew Mosk, Cho Park,
and Brian Ross. 'This Week' Transcript 3-‐26-‐17: Sen. Chuck Schumer, Rep. Mark Meadows, Roger Stone, and Scott Pruitt 2017.
10. Davidson, Kenneth, Aaron Hallberg, Donald McCubbin, and Bryan Hubbell. "Analysis of PM2.5 using the Environmental Benefits Mapping and Analysis Program (BenMAP)." Journal of Toxicology and Environmental Health. Part A 70, no. 3–4 (Feb 1, 2007): 332–46. doi:10.1080/15287390600884982. http://www.ncbi.nlm.nih.gov/pubmed/17365595. 11. Fann, Neal, Michelle L. Bell, Katy Walker, and Bryan
Hubbell. "Improving the Linkages between Air Pollution Epidemiology and Quantitative Risk Assessment." Environmental Health Perspectives 119,
no. 12 (Dec 1, 2011): 1671–5.
doi:10.1289/ehp.1103780.
http://www.jstor.org/stable/41329131.
12. Flynn, Terry N., Jordan J. Louviere, Tim J. Peters, and Joanna Coast. "Best–worst Scaling: What it can do for Health Care Research and how to do It." Journal of Health Economics 26, no. 1 (2007): 171–89. doi:10.1016/j.jhealeco.2006.04.002.
http://www.sciencedirect.com/science/article/pii/S 016762960600049X.
13. Glaeser, Edward L. and Cass R. Sunstein. "Moneyball for State Regulators." Forthcoming National Affairs (Mar 29, 2014).
14. Grabow, Maggie L., Scott N. Spak, Tracey Holloway, Brian Stone, Adam C. Mednick, and Jonathan A. Patz. "Air Quality and Exercise-‐Related Health Benefits from Reduced Car Travel in the Midwestern United States." Environmental Health Perspectives 120, no. 1 (Jan 1, 2012): 68–76. doi:10.1289/ehp.1103440. http://www.jstor.org/stable/41352978.
15. Greene, William H. NLOGIT Version 6.0. Vol. 6.0 2016. 16. Gwinn, Maureen R., Jeneva Craig, Daniel A. Axelrad,
Reducing Hazardous Air Pollutants—Summary of 2009 Workshop and Future Considerations." Environmental Health Perspectives 119, no. 1 (Jan 1,
2011): 125–30. doi:10.1289/ehp.1002468.
http://www.jstor.org/stable/41000692.
17. Hutchinson, Emma and Peter W. Kennedy. "State Enforcement of Federal Standards: Implications for Interstate Pollution." Resource and Energy Economics
30, no. 3 (2008): 316–44.
doi:10.1016/j.reseneeco.2007.12.001.
http://www.sciencedirect.com/science/article/pii/S 0928765507000607.
18. Hyslop, Nicole Pauly. "Impaired Visibility: The Air Pollution People See." Atmospheric Environment 43,
no. 1 (2009): 182–95.
doi:10.1016/j.atmosenv.2008.09.067.
http://www.sciencedirect.com/science/article/pii/S 1352231008009217.
19. Lagerkvist, Carl J., Julius Okello, and Nancy Karanja. "Anchored Vs. Relative Best–worst Scaling and Latent Class Vs. Hierarchical Bayesian Analysis of Best– worst Choice Data: Investigating the Importance of Food Quality Attributes in a Developing Country." Food Quality and Preference 22, no. 1 (2011): 2. doi:10.1016/j.foodqual.2010.10.002.
http://www.sciencedirect.com/science/article/pii/S 0950329310001801.
20. Langford, Ian H., Ian J. Bateman, and Hugh D. Langford. "A Multilevel Modelling Approach to Triple-‐ Bounded Dichotomous Choice Contingent Valuation." Environmental and Resource Economics 7, no. 3 (Apr 1,
1996): 197–211.
http://econpapers.repec.org/article/kapenreec/v_3a 7_3ay_3a1996_3ai_3a3_3ap_3a197-‐211.htm.
21. Laumbach, R. J. "Outdoor Air Pollutants and Patient Health." Am Fam Physician 81, no. 2 (Jan 15, 2010): 175.
http://www.ncbi.nlm.nih.gov/pubmed/20082513. 22. Laumbach, Robert J. and Howard M. Kipen.
"Respiratory Health Effects of Air Pollution: Update on Biomass Smoke and Traffic Pollution." Journal of Allergy and Clinical Immunology 129, no. 1 (Jan 1,
2012): 3–11. doi:10.1016/j.jaci.2011.11.021.
http://www.ncbi.nlm.nih.gov/pubmed/22196520. 23. Lehmann, Evan, Emily Holden, and E&E News.
"Trump Budget Cuts Funds for EPA by 31 Percent." Scientific American (Mar 16, 2017).
24. Louviere, Jordan J., Terry N. Flynn, and A. A. J. Marley. Best-‐Worst Scaling. Cambridge, United Kingdom: Cambridge University Press, 2015.
25. MacArthur Foundation. State's use of Cost-‐Benefit Analysis: The Pew Charitable Trusts, 2013.
26. Mueller Loose, Simone and Larry Lockshin. "Testing the Robustness of Best Worst Scaling for Cross-‐ National Segmentation with Different Numbers of Choice Sets." Food Quality and Preference (2012). doi:10.1016/j.foodqual.2012.02.002.
http://www.sciencedirect.com/science/article/pii/S 0950329312000249.
27. Murphy, J. J., M. A. Delucchi, D. R. McCubbin, and H. J. Kim. "The Cost of Crop Damage Caused by Ozone Air Pollution from Motor Vehicles." Journal of Environmental Management 55, no. 4 (1999): 273–89. doi:10.1006/jema.1999.0256.
http://www.sciencedirect.com/science/article/pii/S 0301479799902566.
28. Committee on Environment and Public Works. EPA
Administrator Confirmation Hearing, Part 1. January
18, 2017.
29. House Committee on Science, Space and Technology Subcommittee on Environment. Testimony before the House Committee on Science, Space and Technology Subcommittee on Environment: Impact of the EPA’s Clean Power Plan on States. May 26, 2016.
30. Rizzi, Luis Ignacio, De La Maza, Cristobal, Cifuentes, Luis Abdon & Gomez, Jorge. Valuing Air Quality Impacts using Stated Choice Analysis: Trading Off Visibility Against Morbidity Effects. Amsterdam: Elsevier, 2014.
31. Sajjad, Faiza, Umara Noreen, and Khalid Zaman. "Climate Change and Air Pollution Jointly Creating Nightmare for Tourism Industry." Environmental Science and Pollution Research 21, no. 21 (Nov, 2014): 12403-‐12418. doi:10.1007/s11356-‐014-‐3146-‐7. http://www.ncbi.nlm.nih.gov/pubmed/24938808. 32. Schoenbrod, David. Why States, Not EPA, should Set
Pollution Standards: Cato Institute, 1996.
33. Shen, Elaine, Shah Dabirian, Anthony Oliver, and Priscilla Hamilton. Final Socioeconomic Report 2016 Air Quality Management Plan: South Coast Air Quality Management District, 2017.
doi:10.1007/s10661-‐008-‐0715-‐6.
http://www.ncbi.nlm.nih.gov/pubmed/19184494. 35. Swackhamer, Deborah and Catherine King. Review of
Valuing Mortality Risk Reductions for Environmental Policy. Washington, D.C.: U. S. Environmental Protection Agency, Office of the Administrator,
Science Advisory Board, 2011.
http://purl.fdlp.gov/GPO/gpo21227.36.
36. Tra, Constant I. "Measuring the General Equilibrium Benefits of Air Quality Regulation in Small Urban Areas." Land Economics 89, no. 2 (2013): 291–307.
http://www.econis.eu/PPNSET?PPN=741377519.
37. U.S. EPA. The Benefits and Costs of the Clean Air Act from 1990 to 2020: 2011.
38. U.S. Office of Management and Budget. Circular A-‐4: 2003.
39. Yoo, Seung-‐Hoon, Seung-‐Jun Kwak, and Joo-‐Suk Lee. "Using a Choice Experiment to Measure the Environmental Costs of Air Pollution Impacts in Seoul." Journal of Environmental Management 86, no.
1 (2008): 308-‐318.
doi:10.1016/j.jenvman.2006.12.008.
http://www.sciencedirect.com/science/article/pii/S 0301479706004002.
Figure 1: Summary Results for Local Valuation of Air Pollution. Figure 1 presents general results from an in-‐person survey implemented in two U.S. cities: Asheville, North Carolina and Lehi, Utah. The top of this infographic presents the median values individuals were willing to pay for improvements in air pollution are compared to federal cost-‐benefit analysis predictions. The percentages of individuals over-‐ and underestimated by the federal method are also presented. The table presents six attributes of air pollution and the percentages of respondents selecting each as most important to them.
Figure 2: Indifference Curves. Figure 2 depicts a breakdown of willingness to pay and accept patterns among respondents in the form of indifference curves. The intersecting circle represents current levels in the community (or in other words, current air quality and energy bill costs). Considering this as a starting point, respondent preferences are depicted by four separate curves, as follows: a) Those willing to pay for improved air quality and unwilling to accept savings in energy costs for declining air quality (78% of respondents); b) Status quo/protest responses, or those unwilling to accept any change in energy costs despite changes in air quality (7%); c) Those willing to accept payment for worsening air quality and unwilling to pay for improved air quality (4%); and d) Those with bi-‐directional preferences, willing to accept payment or pay more depending on air quality changes offered (5%). Another 8% of respondents provided contradictory answers that could not be categorized and were not included in
the analysis.
Laura Gladson is a Research Scholar in the Air Quality Program at the Marron Institute of Urban Management at New York University. She holds an M.S. in Environmental Health Sciences from New York University and a B.S. in Public Health from Brigham Young University. Her research interests include environmental policy, epidemiology, and spatial analysis of the health effects of air pollution.
Kevin Cromar is the Director of the Air Quality Program at the Marron Institute of Urban Management at New York University and has secondary appointments in the departments of population health and environmental medicine at NYU School of Medicine. He holds a Ph.D. in Environmental Health Sciences from New York University, an M.S. in Environmental Health Sciences from New York University, and a B.S. in Neuroscience from Brigham Young University. He currently serves as a member of the American Thoracic Society Environmental and Occupational Health Policy Committee, and is a member of Utah’s Air Quality Board.
North Carolina at Wilmington.
Twitter handle -‐ @NYUMarron Facebook handle -‐ @marroninstitute