This is an open access journal, and articles are distributed under the terms of the Creative Commons Attribution-Non Commercial-ShareAlike 4.0 License, which allows others to remix, tweak, and build upon the work non-commercially, as long as appropriate credit is given and the new creations are licensed under the identical terms.
© 2019 Journal of Advanced Pharmacy Education & Research | Published by SPER Publication
134
Correlation of rainfall and socio-economic with incidence
dengue in Jakarta, Indonesia
Woro Supadmi
1,2, Dyah A. Perwitasari
2, Rizky Abdulah
1, 3, Auliya A. Suwantika
1, 3*
1 Department of Pharmacology and Clinical Pharmacy, Faculty of Pharmacy, Padjadjaran University, Indonesia. 2 Faculty of Pharmacy, Ahmad Dahlan University,
Yogyakarta, Indonesia. 3Center of Excellence in Higher Education for Pharmaceutical Care Innovation, Padjadjaran University, Indonesia.
Correspondence:Auliya A. Suwantika, Department of Pharmacology and Clinical Pharmacy, Faculty of Pharmacy, Padjadjaran University, Jl. Raya Bandung-Sumedang Km. 21 Jatinangor, Sumedang 45363, Indonesia. E-mail:[email protected].
ABSTRACT
Objective: This investigation was aimed to determine the correlation of rainfall and socio-economic factors with total patient, incidence rate (IR) and the cost of illness due to DHF in Jakarta. Method: A cross-sectional study was applied in this study by collecting data related to the medical record of DHF patient, rainfall, and socio-economic factors from the Department of Health, Department of Meteorological, Climatological and Geophysics, and Statistics Indonesia, respectively. Societal and payer perspectives were considered in this study. A Spearman non-parametric correlation was performed to determine the correlation of rainfall and socio-economic factors with incidence rate and cost of illness due to DHF. Result: The results showed that rainfall has significant correlations with IR, total patient, and cost of illness from both perspectives. IR also has a significant correlation with the cost of illness from both perspectives. The total population has a significant correlation with IR and total patient, whereas population density and population growth have insignificant correlations with IR and total patient. In socio-economic variables, the human development index and mean years of schooling have positive significant correlations with the total patient, while the poverty rate has a negative significant correlation. Annual expenditure per capita and GDP have a significant correlation with IR and the total patient. Conclusion: Rainfall has a significant correlation with IR, total patient, and cost of illness from both perspectives. The total population, expenditure per capita and GDP have a significant correlations with total patient and IR.
Keywords: dengue virus, cost analysis, societal perspective, payer perspective
Introduction
The social and economic burden of mosquito-borne viral infection is widely alarming, and the proven global impact of these diseases [1, 2]. The observation of dengue epidemiology highlights the need to strengthen control of the emerging virus [3]. In Indonesia, the number of DHF was estimated to be
100,347 cases with incidence rate (IR) of 39.9 per 100,000 population and case fatality rate (CFR) of 0.9%, as reported in 2014 [4]. As the capital of Indonesia and the most density
province, the number of DHF in Jakarta was estimated to be 8,786 cases with IR of 83.34 per 100,000 population and CFR of 0.22% [4, 5].
The epidemiological factors spreading of DHF virus are strongly correlated with socio-economic, climate and behavior factors, such as high population mobility and changes in climate, population density, and population distribution [6]. Climate change, which might lead to alterations in rainfall, temperature, humidity, and air direction has been reported to have a strong correlation with disease factors such as Aedes mosquitoes and malaria anopheles [7-13]. Several studies also mentioned that socio-economic factors (e.g., population density, poverty, and environment of society) can have an impact on the spreading of DHF virus [14-16]. In many cases, socio-economic factors that are related to behavior and lifestyle have a direct effect on the incidence of dengue disease [17-26]. Furthermore, it has been reported that dengue disease is influenced by multiple sectors such as political, economic, social, and medical sectors [24]. In addition to this complex situation, many published studies
Access this article online
Website: www.japer.in E-ISSN: 2249-3379
confirmed that dengue disease has yielded a high economic burden in many countries [27-30].
As the capital of Indonesia, the human development index (HDI) in Jakarta has been reported to be the highest value in Indonesia compared to other provinces. However, HDI is an important indicator for measuring the quality of life and opportunities of the population in accessing and obtaining income, health, education, etc. [31]. In particular, Jakarta is considered to be a province with the highest gross domestic product (GDP) and the lowest poverty rate in Indonesia [32, 33]. Considering several facts on epidemiological, socio-economic, climate, and behavior factors, it is necessary to conduct a study to determine the correlation of rainfall and socio-economic factors with incidence rate and cost of illness due to DHF in Jakarta.
Methods
The study was approved by the Independent Ethics Committee of Faculty of Medicine, Padjadjaran University, (65/Un6.C10/PN/2017). Six districts (Central Jakarta, North Jakarta, West Jakarta, South Jakarta, East Jakarta, and Kepulauan Seribu) in Jakarta were considered in this study as the study site. An observational cross-sectional study was conducted to analyze the correlation between rainfall volume and socioeconomic factors with incidence rate and cost of illness due to DHF in Jakarta. Data from January 2015 to December 2016 was taken into account. Data related to total cases or hospitalized patients at all hospitals (public and private hospitals) were obtained from the surveillance section, Department of Health (DoH). The incidence rate was calculated by considering the number of cases and population in each district. Rainfall data, which represented the monthly volume of rainwater (millimeter) in each district, were collected from the Department of Meteorological, Climatological, and Geophysics. Socio-economic data (e.g., population, population density, development growth, poverty rate, HDI, annual expenditure per capita, and GDP) were obtained from Statistics Indonesia. The cost of illness due to DHF was viewed from two perspectives (payer and societal). From the payer perspective, it was based on INA-CBGs tariff by calculating the average cost from all types of treatment classrooms (1, 2 or 3) and hospital (A, B, C, and D) [34, 35]. From a societal perspective, data from a previous study by Najib et al. in 2016 was taken into account [36]. Data were analyzed using SPSS 24.0, Microsoft Excel, and Package R. The percentage, mean, SD, highest and lowest scores from each variable were presented in this study. Bivariate correlation analysis of each variable was conducted by using Spearman, a non-parametric correlation.
Results
Total DHF patients in 2015 and 2016, which were considered as patients with a confirmed diagnosis of dengue by physicians during hospitalization with International Classification of Diseases diagnosis (ICD) ICD-10-CM-A91, can be seen in
Tables 1a and 1b.
Table 1a: Total DHF patients in Jakarta (by month)
Months Total patient DHF (%)
2015 2016
January 443 (8.80) 980 (4.80)
February 528 (10.50) 2,219 (10.87)
March 755 (15.02) 3,089 (15.13)
April 1,006 (20.00) 3,781 (18.51)
May 725 (14.42) 2,162 (10.59)
June 548 (10.90) 1,606 (7.86)
July 331 (6.58) 1,184 (5.80)
August 173 (3.44) 1,233 (6.04)
September 133 (2.65) 1,103 (5.40)
October 116 (2.31) 1,036 (5.07)
November 113 (2.24) 1,153 (5.65)
December 157 (3.12) 877 (4.29)
Total 5,028 20,423
Table 1b: Total DHF patients in Jakarta (by district)
District Total patient DHF (%)
2015 2016
Central Jakarta 405 (8.05) 1,222 (5.98)
North Jakarta 968 (19.25) 2,821 (13.81)
West Jakarta 1,283 (25.52) 5,563 (27.24)
South Jakarta 1,140 (22.67) 4,378 (21.43)
East Jakarta 1,226 (24.38) 6,429 (31.48)
Kepulauan Seribu 6 (0.12) 10 (0.05)
Total 5,028 20,423
The result showed that the highest number of DHF patients can be found in April for both years at 1,006 (20%) and 3,781 (18.51%), in 2015 and 2016, respectively. Districts with the highest number of patients were West Jakarta (1,283) and East Jakarta (6,429), in 2015 and 2016, respectively.
136 Journal of Advanced Pharmacy Education & Research | Jan-Mar 2019 | Vol 9 | Issue
Figure 1a. IR of DHF in all districts in Jakarta
Figure 1b. CFR of DHF in all districts in Jakarta
Regarding the rainfall, the result showed that the highest amount of rainfall can be found in February for both years with 3,105 mm and 2,277 mm in 2015 and 2016, respectively. Districts with the highest amount of rainfall were South Jakarta
(1,850 mm) and East Jakarta (2,773 mm), in 2015 and 2016, respectively. Rainfall data from Kepulauan Seribu was not considered due to limited data (see Table 2).
Table 2a Total amount of rainfall in Jakarta (by month)
Months Rainfall (millimeter)
2015 2016
January 1,597 717
February 2,229 1,872
March 1,112 790
April 438 739
May 463 672
June 61 712
July 0 753
August 26 955
September 0 1,475
October 0 884
November 371 989
December 797 430
Total 7,094 10,988
Table 2b Total amount of rainfall in Jakarta (by district)
District Rainfall (millimeter)
2015 2016
Central Jakarta 1,458 2,660
North Jakarta 1,125 1,564
West Jakarta 1,255 1,506
South Jakarta 1,850 2,485
East Jakarta 1406 2,773
Total 7,094 10,988
42.84 43.11 44.3 52.08 55.4 49.44
198.24
224.22
133.12
222.68
159.74
198.64
0 50 100 150 200 250
Kepulauan Seribu
South Jakarta
East Jakarta
Central Jakarta
west Jakarta
North Jakarta
DKI Jakarta
Inc
idence
Rate
2015 2016
0.274
0.103 0.078
0
0.489
0
0.082 0.071
0.036 0.045
0.109
0
0 0.1 0.2 0.3 0.4 0.5 0.6
Central Jakarta
North Jakarta
west Jakarta South
Jakarta
East Jakarta Kab.
Kep.Seribu
Case Fatali
ty
Rate
2015
Demographic and socio-economic situations in all districts in Jakarta are shown in Table 3. The results showed that districts with the highest total population and highest population density in both years were in East Jakarta and Central Jakarta. Districts with the highest growth rate population were Kepulauan Seribu
and West Jakarta in 2015 and 2016, respectively (see Table 3a). The highest HDI, annual expenditure per capita and GDP were found in South Jakarta for both years. While the highest mean years of schooling the lowest poverty rate was found in East Jakarta for both years (see Table 3b).
Table 3a: Demographic situation in all districts in Jakarta
District Total Population (people) Population Density (population/ per km²) Growth Rate population (%)
2015 2016 2015 2016 2015 2016
Central Jakarta 914,182 917,753 18,993.11 19,068.23 0.42 0.39
North Jakarta 1,747,315 1,764,614 11,913.83 12,032.01 1.03 0.99
West Jakarta 2,463,560 2,496,002 19,017.92 19,268.20 1.36 1,32
South Jakarta 2,185,711 2,206,731 15,472.17 15,620.67 1.00 0,96
East Jakarta 2,843,816 2,868,910 15,124.15 15,257.72 0.92 0,88
Kepulauan Seribu 23,340 23,616 2,683.96 2,714.48 1.43 1.18
Table 3b: Socio-economic situation in all districts in Jakarta
District
Human Development Index (HDI)
Annual expenditure per capita (IDR)
Mean years of schooling (years)
2015 2016 2015 2016 2015 2016
Central Jakarta 79.69 80.22 16,143,000 16,493,000 10.88 11.01
North Jakarta 78.3 78.78 17,205,000 17,418,000 10.05 10.23
West Jakarta 79.72 80.34 19,006,000 19,501,000 10.15 10.36
South Jakarta 83.37 83.94 22,425,000 22,932,000 11.23 11.42
East Jakarta 80.73 81.28 16,455,000 16,733,000 11.32 11.52
Kepulauan Seribu 68.84 69.52 11,433,000 11,608,000 8.04 8.24
District
Percentage poverty
population Total poverty population
Gross Domestic Regional Product (IDR)
2015 2016 2015 2016 2015 2016
Central Jakarta 4.16 3.91 3,801,000 3,582,000 485,496,642 532,943,240
North Jakarta 5.91 3.57 10,297,000 9,811,000 378,437,670 412,466,460
West Jakarta 3.64 3.38 8,939,000 8,408,000 328,396,835 359,245,162
South Jakarta 3.41 3.27 7.446,000 7,196,000 443,059,371 485,323,433
East Jakarta 3.24 3.19 9,144,000 9,137,000 345,949,241 380,922,034
Kepulauan Seribu 11.4 12.58 265,000 296,000 6,258,665 6,542,434
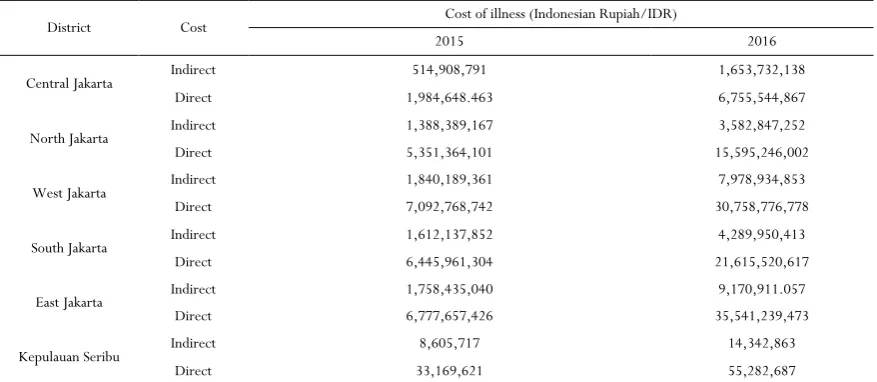
The cost of illness due to DHF was estimated from societal and payer perspectives can be found in Table 4. According to an investigation conducted by Nadjib et al. in 2016 [36], we estimated that the total cost of illness due to DHF from the societal perspective would be IDR 6,962,555 (direct cost: IDR 5,528,269 and indirect cost: IDR 1,434,286). West Jakarta and East Jakarta were considered to be districts with the highest cost
of illness from the societal perspective in 2015 and 2016, respectively (see Table 4a). From the payer perspective, we calculated that the total cost of illness due to DHF would be IDR 2,416,934 per patient. West Jakarta and East Jakarta were also considered to be districts with the highest cost of illness from a payer perspective in 2015 and 2016, respectively (see
138 Journal of Advanced Pharmacy Education & Research | Jan-Mar 2019 | Vol 9 | Issue
Table 4a Cost of illness due to DHF from the societal perspective
District Cost Cost of illness (Indonesian Rupiah/IDR)
2015 2016
Central Jakarta Indirect 514,908,791 1,653,732,138
Direct 1,984,648.463 6,755,544,867
North Jakarta Indirect 1,388,389,167 3,582,847,252
Direct 5,351,364,101 15,595,246,002
West Jakarta Indirect 1,840,189,361 7,978,934,853
Direct 7,092,768,742 30,758,776,778
South Jakarta Indirect 1,612,137,852 4,289,950,413
Direct 6,445,961,304 21,615,520,617
East Jakarta Indirect 1,758,435,040 9,170,911.057
Direct 6,777,657,426 35,541,239,473
Kepulauan Seribu Indirect 8,605,717 14,342,863
Direct 33,169,621 55,282,687
Table 4b Cost of illness due to DHF from the payer perspective
District
Cost of illness (Indonesian Rupiah/IDR)
2015 2016
Central Jakarta 978,858,185 2,368,595,555
North Jakarta 2,339,592,344 6,818,171,491
West Jakarta 3,100,926,609 13,445,405,177
South Jakarta 2,755,305,033 10,581,338,102
East Jakarta 2,963,161,489 14,072,880,077
Kepulauan Seribu 14,501,605 21,752,408
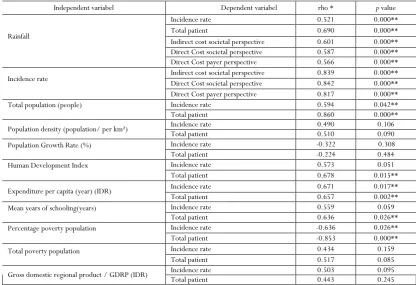
Correlation between rainfall, demographic, socioeconomic with incidence rate, total patient, and cost of illness can be seen in
Table 5.
The results demonstrated that rainfall has significant correlations with IR, total patient, and cost of illness from both perspectives. In particular, IR also has a significant correlation with the cost of illness from both perspectives. In demographic variables, the total population has a significant correlation with
Table 5 Correlation of rainfall, demographics, socio-economic with incidence rate and cost of illness
Independent variabel Dependent variabel rho * p value
Rainfall
Incidence rate 0.521 0.000**
Total patient 0.690 0.000**
Indirect cost societal perspective 0.601 0.000** Direct Cost societal perspective 0.587 0.000**
Direct Cost payer perspective 0.566 0.000**
Incidence rate Indirect cost societal perspective Direct Cost societal perspective 0.839 0.842 0.000** 0.000**
Direct Cost payer perspective 0.817 0.000**
Total population (people) Incidence rate 0.594 0.042**
Total patient 0.860 0.000**
Population density (population/ per km²) Incidence rate Total patient 0.490 0.510 0.106 0.090
Population Growth Rate (%) Incidence rate -0.322 0.308
Total patient -0.224 0.484
Human Development Index Incidence rate 0.573 0.051
Total patient 0.678 0.015**
Expenditure per capita (year) (IDR) Incidence rate 0.671 0.017**
Total patient 0.657 0.002**
Mean years of schooling(years) Incidence rate 0.559 0.059
Total patient 0.636 0.026**
Percentage poverty population Incidence rate -0.636 0.026**
Total patient -0.853 0.000**
Total poverty population Incidence rate 0.434 0.159
Total patient 0.517 0.085
Gross domestic regional product / GDRP (IDR) Incidence rate Total patient 0.503 0.443 0.095 0.245
* rho spearman corellation ** p value < 0,005
Discussion
This study confirmed that the highest number of DHF patients can be found in April. Additionally, February and March have been reported to be months with high rainfall that might cause many puddles of water as a breeding site for vectors or mosquitoes in April. However, information on the most endemic time is important for the government on making epidemiological predictions and planning prevention strategies. The results of this study are in line with the result of a previous study, which mentioned that the highest number of dengue cases in Indonesia is usually found in a cycle of January until April. January is considered as the period in which eradication of larvae and source mosquitoes should be done before the transition period [37, 38]. Regarding the IR, the value of IR in Jakarta in 2015 was calculated to be smaller than national value. In 2016, the value increased significantly. This situation is caused by a large number of outbreaks in 2016, as occurred in many countries in the same year. The number of dengue cases in the Region of America has been reported to be more than 2.38 million in 2016, where Brazil alone contributed slightly less than 1.5 million cases, almost three times higher than in 2014-2015. More than 375,000 suspected cases of dengue in the West Pacific Region occurred in 2016, which was much higher than in 2015. The Solomon Islands in 2016 also declared an outbreak with more than 7,000 suspected cases [39, 40]. The average annual rainfall rates in Jakarta from this study were estimated to be 1418.8 mm and 2197.6 mm in 2015 and 2016, respectively. This trend is in line with the total number of DHF
140 Journal of Advanced Pharmacy Education & Research | Jan-Mar 2019 | Vol 9 | Issue
Jakarta has yielded a high economic burden from both perspectives. The results of this study reconfirmed the results of many previous studies, which highlighted the substantial economic burden due to dengue infection in many countries [44-51]. Specifically, a study conducted in Vietnam reported that the
costs of illness due to dengue infection would increase gradually year per year as the consequence of the increasing number of dengue cases in this region [47]. A previous study, which compared the dengue episode and its economic burden in two setting countries in Asia (rich and poorer countries), confirmed that lower dengue episodes in rich countries would give higher economic burden than in poorer countries [50]. The study described that dengue infection would give more economic burden in higher-income regions. As one of the highest-income provinces in Indonesia, our study showed a significant economic burden due to dengue infection in all districts in Jakarta. This study showed a significant correlation (strongly positive) between rainfall with IR, total patient, and cost of illness from both perspectives. This study can extend the results from two previous studies in Singapore and Bangkok, which mentioned that rainfall can be considered as the most influential factor affecting dengue transmission in these regions [41, 42]. Rainfall also has the potential to increase the relative humidity, which extends mosquitoes life [42]. However, higher dengue transmission would significantly lead to higher epidemiology and economic burden.
In demographic variables, the total population has a significant correlation with IR and total patient. In socio-economic variables, HDI and mean years of schooling have significantly positive correlations with the total patient, while the poverty rate has a significantly negative correlation. Moreover, annual expenditure per capita and GDP have a significant correlation with IR and total patient. A previous study conducted in New Caledonia has reported that demographic and socio-economic importance factors on spreading dengue infection. Specifically, all those variables were strongly correlated with other variables reflecting the different life, socio-economic, and cultural differences in New Caledonia, strongly correlated with the type of housing [26]. However, DHF incidence was ecologically associated with demographic and socio-economic characteristics of the population. Areas with a high proportion of low socio-economic tend to have a high incidence of DHF, as this study also reported.
Conclusion
The results indicated that rainfall has a significant correlation with IR, total patient, and cost of illness from both perspectives. In particular, IR also has a significant correlation with the cost of illness from both perspectives. The total population has a significant correlation with IR and total patient. Annual expenditure per capita and GDP have significant correlations with IR and total patient.
Acknowledgment
This research is fully funded by the Ministry of Research, Technology and Higher Education, The Republic of Indonesia.
Conflict of Interest
The authors report no conflicts of interest in this work.
References
1. Ojewumi ME, Adedokun SO, Omodara OJ, Oyeniyi EA, Taiwo OS, Ojewumi EO. Phytochemical and antimicrobial activities of the leaf oil extract of Mentha spicata and its efficacy in repelling mosquito. International Journal of Pharmaceutical Research & Allied Sciences. 2017;6(4):17-27.
2. Ojewumi ME, Adeyemi AO, Ojewumi EO. Oil extract from local leaves-an alternative to synthetic mosquito repellants. Pharmacophore. 2018;9(2):1-6.
3. Cucunawangsih, Lugito NP. Trends of dengue disease epidemiology. Virology: research and treatment. 2017 Mar 10;8:1178122X17695836.
4. Kesehatan K. Data dan Informasi Tahun 2014 (Profil Kesehatan Indonesia). Jakarta: Kementerian Kesehatan Republik Indonesia. 2015.
5. Jakarta DK. Profil Kesehatan Provinsi DKI Jakarta Tahun 2015.
6. Data P, RI SE. Buletin Jendela Epidemiologi Demam Berdarah Dengue. Kemenkes RI, Jakarta. 2010;2.
7. McMichael AJ. Population health as the ‘bottom line’of
sustainability: a contemporary challenge for public health researchers. The European Journal of Public Health. 2006 Jul 19;16(6):579-81.
8. Le Thi Diem Phuong TT, Hanh T, Nam VS. Climate Variability and Dengue Hemorrhagic Fever in Ba Tri District, Ben Tre Province, Vietnam during 2004–2014. AIMS public health. 2016;3(4):769.
9. Hidayanti R. Model Peringatan Dini Penyakit Demam Berdarah Dengan Informasi Unsur Iklim. Institut Pertanian Bogor. 2008.
10. Mondini A, Chiaravalloti-Neto F. Spatial correlation of incidence of dengue with socioeconomic, demographic and environmental variables in a Brazilian city. Science of the total Environment. 2008 Apr 15;393(2-3):241-8. 11. Yañez SS, Canencia OP. Ecological and demographic factors associated with dengue virus incidence in Cagayan de Oro city, Philippines: a geographic information system application. J. Bio. & Env. Sci.2017;10(2):190-201.
13. Kassiri H, Khodkar I, Safari V, Lotfi M. A Twenty-Four Years Study on the Malaria Trend in Southwestern Iran (1995-2018). Entomology and Applied Science Letters. 2018;5(4):35-44.
14. Ma S., Ooi EE, Goh KT. Socioeconomic Determinants of Dengue Incidence in Singapore. Dengue Bulletin.. 2008.
15. Khormi HM, Kumar L. Modeling dengue fever risk based on socioeconomic parameters, nationality and age groups: GIS and remote sensing based case study. Science of the Total Environment. 2011 Oct 15;409(22):4713-9.
16. Hagenlocher M, Delmelle E, Casas I, Kienberger S. Assessing socioeconomic vulnerability to dengue fever in Cali, Colombia: statistical vs expert-based modeling. International journal of health geographics. 2013 Dec;12(1):36.
17. Suaya JA, Shepard DS, Siqueira JB, Martelli CT, Lum LC, Tan LH, Kongsin S, Jiamton S, Garrido F, Montoya R, Armien B. Cost of dengue cases in eight countries in the Americas and Asia: a prospective study. The American journal of tropical medicine and hygiene. 2009 May 1;80(5):846-55.
18. Win T, Rungsrihirunrat K, Siriwong W. Association of environmental and socio-economic factors with dengue prevention practice related to dengue outbreak in mae la temporary shelter in tak province, thailand. J Health Res vol. 2012 Jun;26(2).
19. Mondini A, Chiaravalloti Neto F. Socioeconomic variables and dengue transmission. Revista de saúde pública. 2007 Dec;41(6):923-30.
20. Qi X, Wang Y, Li Y, Meng Y, Chen Q, Ma J, Gao GF. The effects of socioeconomic and environmental factors on the incidence of dengue fever in the Pearl River Delta, China, 2013. PLoS neglected tropical diseases. 2015 Oct 27;9(10):e0004159.
21. Troyo A, Fuller DO, Calderón‐Arguedas O, Solano ME, Beier JC. Urban structure and dengue incidence in Puntarenas, Costa Rica. Singapore journal of tropical geography. 2009 Jul;30(2):265-82.
22. Bhatt S, Gething PW, Brady OJ, Messina JP, Farlow AW, Moyes CL, Drake JM, Brownstein JS, Hoen AG, Sankoh O, Myers MF. The global distribution and burden of dengue. Nature. 2013 Apr;496(7446):504. 23. Li Y, Kamara F, Zhou G, Puthiyakunnon S, Li C, Liu Y,
Zhou Y, Yao L, Yan G, Chen XG. Urbanization increases Aedes albopictus larval habitats and accelerates mosquito development and survivorship. PLoS neglected tropical diseases. 2014 Nov 13;8(11):e3301. 24. Mena N, Troyo A, Bonilla-Carrión R,
Calderón-Arguedas Ó. Factores asociados con la incidencia de dengue en Costa Rica. Revista Panamericana de Salud Pública. 2011;29:234-42.
25. Cordeiro R, Donalisio MR, Andrade VR, Mafra AC, Nucci LB, Brown JC, Stephan C. Spatial distribution of
the risk of dengue fever in southeast Brazil, 2006-2007. BMC Public Health. 2011 Dec;11(1):355.
26. Teurlai M, Menkes CE, Cavarero V, Degallier N, Descloux E, Grangeon JP, Guillaumot L, Libourel T, Lucio PS, Mathieu-Daudé F, Mangeas M. Socio-economic and climate factors associated with dengue fever spatial heterogeneity: a worked example in New Caledonia. PLoS neglected tropical diseases. 2015 Dec 1;9(12):e0004211.
27. Undurraga EA, Halasa YA, Shepard DS. Use of expansion factors to estimate the burden of dengue in Southeast Asia: a systematic analysis. PLoS neglected tropical diseases. 2013 Feb 21;7(2):e2056.
28. Shepard DS, Halasa YA, Tyagi BK, Adhish SV, Nandan D, Karthiga KS, Chellaswamy V, Gaba M, Arora NK, INCLEN Study Group. Economic and disease burden of dengue illness in India. The American journal of tropical medicine and hygiene. 2014 Dec 3;91(6):1235-42. 29. Beauté J, Vong S. Cost and disease burden of dengue in
Cambodia. BMC public health. 2010 Dec;10(1):521. 30. Carrasco LR, Lee LK, Lee VJ, Ooi EE, Shepard DS,
Thein TL, Gan V, Cook AR, Lye D, Ng LC, Leo YS. Economic impact of dengue illness and the cost-effectiveness of future vaccination programs in Singapore. PLoS neglected tropical diseases. 2011 Dec 20;5(12):e1426.
31. Badan Pusat Statistik Jakarta. Berita Resmi Statistics Provinsi DKI Jakarta. No. 19/04/31/Th. XVIX, 17 April 2017
32. Badan Pusat Statistik Jakarta. Jakarta Dalam Angka 2017, Jakarta. 2017. https://jakarta.bps.go.id/ 33. Badan Pusat Statistik Indonesia.. Statistics Indonesia
2017, Jakarta. 2017. https://www.bps.go.id/
34. Indonesia PM. Peraturan menteri kesehatan republik indonesia nomor 58 tahun 2014 tentang standar pelayanan kefarmasian di rumah sakit. Jakarta: Depkes RI. 2014;8:47-8.
35. Dinas Kesehatan Provinsi DKI Jakarta. Profil Kesehatan DKI Jakarta tahun 2016. Jakarta. Dinas Kesehatan
Provinsi DKI Jakarta. 2017.
http://www.depkes.go.id/
resources/download/profil/PROFIL_KES_PROVINSI _2016/11_DKI_Jakarta_2016.pdf
36. Nadjib M, Sari K, Chotimah I, Setiawan E, Putri S, Septiandri A. Biaya Penyakit Dengue di Indonesia: Estimasi dari Jakarta, Bali dan Yogyakarta. Retrieved from Center for Health Economics and Policy Studies. 2016. Avalable form: http://cheps.or.id/coi-DHF/#1482209247496-cb83eba9-6d95
37. KeMenKes RI. Profil kesehatan Indonesia tahun 2015. Jakarta Kementeri Kesehat Republik Indones. 2016. 38. Karyanti MR, Hadinegoro SR. Perubahan epidemiologi
demam berdarah dengue di Indonesia. Sari Pediatri. 2016 Nov 29;10(6):424-32.
142 Journal of Advanced Pharmacy Education & Research | Jan-Mar 2019 | Vol 9 | Issue
40. Guo C, Zhou Z, Wen Z, Liu Y, Zeng C, Xiao D, Ou M, Han Y, Huang S, Liu D, Ye X. Global epidemiology of dengue outbreaks in 1990–2015: a systematic review and meta-analysis. Frontiers in cellular and infection microbiology. 2017 Jul 12;7:317.
41. World Health Organization. Dengue and severe dengue. World Health Organization. Regional Office for the Eastern Mediterranean; 2014.
42. Polwiang S. The correlation of climate factors on dengue transmission in urban area: Bangkok and Singapore cases. PeerJ Preprints. 2016 Jul 27;4:e2322v1.
43. Morin CW, Comrie AC, Ernst K. Climate and dengue transmission: evidence and implications. Environmental health perspectives. 2013 Sep 20;121(11-12):1264-72. 44. Cheng Q, Jing Q, Spear RC, Marshall JM, Yang Z,
Gong P. The interplay of climate, intervention and imported cases as determinants of the 2014 dengue outbreak in Guangzhou. PLoS neglected tropical diseases. 2017 Jun 22;11(6):e0005701.
45. Stahl HC, Butenschoen VM, Tran HT, Gozzer E, Skewes R, Mahendradhata Y, Runge-Ranzinger S, Kroeger A, Farlow A. Cost of dengue outbreaks: literature review and country case studies. BMC public health. 2013 Dec;13(1):1048.
46. Martelli CM, Junior JB, Parente MP, Zara AL, Oliveira CS, Braga C, Junior FG, Cortes F, Lopez JG, Bahia LR, Mendes MC. Economic impact of dengue: multicenter study across four Brazilian regions. PLoS neglected tropical diseases. 2015 Sep 24;9(9):e0004042.
47. Shepard DS, Coudeville L, Halasa YA, Zambrano B, Dayan GH. Economic impact of dengue illness in the Americas. The American journal of tropical medicine and hygiene. 2011 Feb 4;84(2):200-7.
48. Vo NT, Phan TN, Vo TQ. Direct medical costs of dengue fever in Vietnam: A retrospective study in a tertiary hospital. The Malaysian journal of medical sciences: MJMS. 2017 May;24(3):66.
49. Shepard DS, Undurraga EA, Halasa YA, Stanaway JD. The global economic burden of dengue: a systematic analysis. The Lancet infectious diseases. 2016 Aug 1;16(8):935-41.
50. Castañeda-Orjuela C, Díaz H, Alvis-Guzman N, Olarte A, Rodriguez H, Camargo G, De la Hoz-Restrepo F. Burden of disease and economic impact of dengue and severe dengue in Colombia, 2011. Value in health regional issues. 2012 Dec 1;1(2):123-8.