The Effect of Corticosteroid Medication on
Quantitative MR Parameters of the Brain
Stefan C.A. Steens, Gerda M. Steup-Beekman, Gerlof P.Th. Bosma, Faiza Admiraal-Behloul, Hans Olofsen, Joost Doornbos, Tom W.J. Huizinga, and Mark A. van Buchem
BACKGROUND AND PURPOSE:Quantitative MR imaging techniques such as magnetization transfer imaging (MTI), diffusion-weighted imaging (DWI), and MR spectroscopy are prom-ising diagnostic tools for use with patients with diffuse brain diseases such as neuropsychiatric systemic lupus erythematosus (NPSLE). Such patients are often on corticosteroid (CS) treat-ment. Presently, it is unknown whether CSs per se influence quantitative MR imaging mea-surements. The aim of this study was to evaluate the effect of low-dose oral CSs on MTI, DWI, and MR spectroscopy parameters of the brain.
METHODS:Twenty-seven rheumatoid arthritis (RA) patients with and without CS medica-tion and 15 healthy controls were subjected to convenmedica-tional MR imaging, whole-brain MTI and DWI, and single-voxel MR spectroscopy. Oral CSs were used by 13 of the RA patients. Univariate analyses with age as a covariate were performed on MTI, DWI, and MR spectroscopy parameters between RA patients with and without CSs and healthy controls. Pearson correla-tions were calculated between all imaging parameters and duration of disease, duration of CS use, and CS dosage.
RESULTS: No significant differences between the groups of subjects or significant correla-tions with clinical parameters were found for MTI, DWI and MR spectroscopy parameters.
CONCLUSION: In this study, we found no evidence for an effect of low-dose oral CSs on whole-brain MTI and DWI histogram parameters and single-voxel MR spectroscopy measure-ments of the brain. The results of this study demonstrate that it is unlikely that MTI, DWI, and MR spectroscopy parameters reported in NPSLE studies are confounded by low-dose oral CS.
Conventional MR imaging is the imaging technique of choice in the diagnostic work-up of systemic lupus erythematosus (SLE) patients with neuropsychiatric (NP) symptoms (1, 2). The abnormalities that are observed in such patients on conventional MR imag-ing, however, are neither specific nor sensitive for primary diffuse neuropsychiatric SLE (NPSLE). Re-cently, by using the quantitative MR imaging tech-niques of magnetization transfer imaging (MTI) (3), diffusion-weighted imaging (DWI) (4), and MR spec-troscopy (5), diffuse abnormalities have been ob-served in patients with NPSLE, which are invisible on
conventional MR images (6 –13). Quantitative MR imaging techniques are not only promising diagnostic tools, but have also increased knowledge on the pathogenesis of NPSLE. A clinical issue that remains to be evaluated is the question whether low-dose oral corticosteroid (CS) medication by itself leads to ab-normalities in the whole-brain MTI and DWI param-eters and single-voxel MR spectroscopy measure-ments, because many (NP-) SLE patients use low-dose oral CS.
Patients with severe SLE organ involvement or NPSLE manifestations often require high-dose (in-travenous) CS (14, 15). Patients with milder disease activity, however, may benefit from oral prednisolone at daily doses of only 7–15 mg (14). Apart from the beneficial anti-inflammatory and immunosuppressive effects of CS, there are also a number of well-docu-mented adverse effects, including some symptomatic effects on the central nervous system (CNS) such as psychosis, seizures, or memory deficits (14, 16, 17). Furthermore, in both SLE and multiple sclerosis (MS) patients receiving CSs, some neuroimaging studies have reported cerebral atrophy, which was at least partially attributed to CS (18, 19). If CS use is
Received February 22, 2005; accepted after revision May 6. From the Departments of Radiology (S.C.A.S., G.P.Th.B., J.D., M.A.v.B.) and Rheumatology (G.M.S.B., T.W.J.H.) and the Divi-sion of Image Processing (F.A.B., H.O.), Leiden University Med-ical Center, Leiden, the Netherlands.
Presented in part at the Scientific Meeting of the International Society for Magnetic Resonance in Medicine, May 15–21, 2004, Kyoto, Japan.
S.C.A.S. and G.M.S.B. contributed equally to this article. Address correspondence to Stefan C.A. Steens, MD, Depart-ment of Radiology, C2-S, Leiden University Medical Center, Al-binusdreef 2, 2333 ZA Leiden, the Netherlands.
©American Society of Neuroradiology
associated with cerebral atrophy, the changes in neu-ronal density and axonal packing are likely to affect MTI, DWI, and MR spectroscopy results, which are indicative of the structural integrity and chemical composition of the brain parenchyma (2).
Before quantitative MR imaging techniques can be used as diagnostic tools and surrogate markers for therapy in NPSLE, it is imperative to know whether brain abnormalities observed can truly be attributed to the underlying disease. The aim of this study was to evaluate the effect of low-dose oral CS on whole-brain MTI and DWI parameters and single-voxel MR spectroscopy measurements. For this purpose, we se-lected a group of patients with rheumatoid arthritis (RA), a disease that is not known to affect brain tissue, who were receiving CS medication and com-pared quantitative MR imaging parameters of their brains to those of a group of RA patients without CS medication and a group of healthy controls.
Methods
Subjects
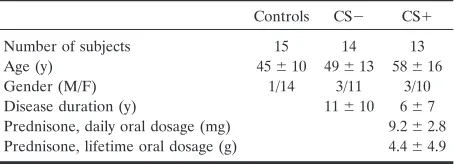
Twenty-seven patients diagnosed with RA (20) were se-lected from the patient files of the Department of Rheumatol-ogy at our institution (Table 1). At the time of scanning, 13 patients were receiving daily oral prednisone (CS⫹), whereas the others had not used oral CSs for at least 25 years (CS⫺). Disease-modifying antirheumatic drugs (DMARDs) consisting of oral low-dose methotrexate, sulfasalazine, leflunomide, or intramuscular gold injections were used by all patients but one. Both daily CS dosage at the time of scanning and lifetime cumulative CS dosage are listed in Table 1. The effect of CS on the study parameters was evaluated comparing CS⫹and CS⫺ patients. Also, 15 healthy controls were recruited by an adver-tisement in a local newspaper and included in the study. None of the subjects had a diagnosis of current or past neurologic or psychiatric disease. This study was approved by the medical ethics committee of our institution and written informed con-sent was acquired from all subjects.
Image Acquisition
Scanning was performed on a 1.5T MR system (Philips Medical Systems, Best, the Netherlands), equipped with hard-ware for echo-planar imaging (EPI), shielded gradients, and a standard quadrature headcoil. Scanning was performed in the axial plane, with alignment parallel to the plane through the anterior and posterior commissure.
Conventional MR Imaging Sequences. Conventional T1-weighted spin-echo, fluid-attenuated inversion-recovery (FLAIR) and dual-echo (proton density and T2-weighted) im-ages covering the whole brain consisted of 3– 6-mm sections with 0 – 0.6-mm section gap. Echo time and repetition times
(TE/TR) were 20/600 msec for T1-weighted images, 120/8000 msec or 100/8000 msec for FLAIR images with an inversion time (TI) of 2000 msec and TE1/TE2/TR of 30/120/2500 msec
or 27/120/3000 msec for dual images. The field of view (FOV) was 220 mm with a 256⫻256 matrix. Total scanning time for conventional MR imaging was maximal 18 minutes.
MTI. For MTI a 3D gradient-echo pulse sequence with a TE/TR of 6/106 msec and a flip angle of 12° were used, mini-mizing T1 and T2 weighting. A FOV of 220 mm, 256 ⫻128 matrix, and scan time of 11:27 minutes were used for 28 con-tiguous 5-mm sections. Two sets of axial images were acquired, with (Ms) and without (Mo) a sinc-shaped MT saturation pulse 1100 Hz upfield of H2O resonance (12).
DWI.Multisection, single-shot DW-EPI of the whole brain was performed in 3 orthogonal directions with abvalue of 800 s/mm2. For each diffusion direction a combination ofx, y,and
zgradients was used to apply strenghts of 30 mT/m and a slew rate of 150 mT/m/s. A TE/TR of 70/2642 msec, FOV of 230 mm, matrix of 256⫻128, 60% acquisition, EPI factor of 77, and scan time of 19 seconds were used for 18 6-mm sections with 1-mm section gap. From the DWI in 3 directions, an isotropic diffusion image was calculated (12).
MR Spectroscopy. 1H-MR spectra were acquired with a
TE/TR of 136/2000 msec. The number of signals averaged was 128; the spectral bandwidth was 1000 Hz, using 512 data points. A volume of interest (VOI) of 23 mL (⫾4.6 mL) was placed in the white matter adjacent to the left lateral cerebral ventricle. Scan time was approximately 4.5 minutes, including shimming of the VOI and optimization of parameters for water suppres-sion (12).
Postprocessing of MR Spectra and Images
All data were transferred to an off-line workstation. The Magnetic Resonance User Interface (MRUI) software package (21) was used for MR spectroscopy data processing; all other postprocessing procedures were performed by using SNIPER (Software for Neuro-Image Processing in Experimental Re-search, Division of Image Processing, Department of Radiol-ogy, Leiden University Medical Center, Leiden, the Nether-lands) by using registration algorithms described by Woods et al (22, 23).
Conventional MR Imaging Sequences.The conventional MR images were registered to the whole-brain Ms images, provid-ing whole-brain datasets of these sequences for each patient. Then, the intracranial, brain parenchyma, and CSF compart-ments were segmented automatically, providing the fraction of CSF to intracranial volume (CSF%) as an indicator of cerebral atrophy. Abnormalities as identified on hard copies of T2-weighted and FLAIR images by an experienced neuroradiolo-gist were manually outlined on the coreneuroradiolo-gistered conventional MR images, and the fraction of lesion volume to parenchymal volume was calculated (Lesion%).
MTI. After registration of the Mo to the Ms images, the magnetization transfer ratio (MTR, in percent unit [pu]) was calculated from signal intensities of every voxel with the equa-tion [(Mo⫺Ms)/Mo]⫻100% (3). On the basis of the coreg-istered conventional MR images, the intracranial compartment was segmented automatically and manually edited when nec-essary. After automatic segmentation of brain parenchyma and CSF based on an MTR threshold of 20 pu as described else-where, MTR maps were generated from the brain parenchyma. From these maps, whole-brain MTR histograms were gener-ated and the corresponding mean (pu) and peak height cor-rected for volume differences (arbitrary units) were calculated (6, 7, 12).
DWI. After calculation of apparent diffusion coefficient ([ADC] 10⫺6mm2/s) maps from the isotropicb⫽800 s/mm2
and b ⫽ 0 s/mm2images, the intracranial compartment was
segmented automatically based on b ⫽ 0 s/mm2 (⬇
[image:2.585.55.282.71.153.2]T2-weighted) images and manually edited when necessary. After automatic segmentation of brain parenchyma and CSF, ADC TABLE 1: Patient characteristics
Controls CS⫺ CS⫹
Number of subjects 15 14 13 Age (y) 45⫾10 49⫾13 58⫾16 Gender (M/F) 1/14 3/11 3/10 Disease duration (y) 11⫾10 6⫾7 Prednisone, daily oral dosage (mg) 9.2⫾2.8 Prednisone, lifetime oral dosage (g) 4.4⫾4.9
maps were generated for the brain parenchyma. From these maps, whole-brain ADC histograms were generated and the corresponding mean (10⫺6mm2/s) and peak height corrected
for volume differences (arbitrary units) were calculated (24).
MR Spectroscopy. The residual water signal intensity was removed by means of singular value decomposition (HSVD; 25). Metabolites detected by1H-MR spectroscopy includeN
-acetylaspartate (NAA), creatine (Cre), choline-containing sub-stances (Cho), inositol, lactate, glutamate and glutamine, and lipids (5). In this study, we focused on the commonly used metabolites NAA, Cre, and Cho (12). These were quantified by model fitting in the time domain (AMARES method of MRUI, constrained peak fitting—ie, the linewidths of NAA, Cre, and Cho were kept identical) (26) and expressed as NAA/Cre and Cho/Cre ratios.
Statistics
One-way analysis of variance (ANOVA) with post hoc Bon-ferroni test was performed to test for a significant difference in age between the groups, and independent samplesttest to test for a significant difference in disease duration between CS⫹ and CS⫺patients. Univariate analyses with age as a covariate were performed on whole-brain MTI and DWI parameters and single-voxel MR spectroscopy measurements between healthy controls and CS⫹and CS⫺patients (SPSS for Windows, re-lease 11 2002; SPSS, Inc., Chicago). Within the RA patient group, Pearson correlation coefficients were calculated be-tween imaging parameters and disease duration. Moreover, Pearson correlation coefficients were calculated between dura-tion of CS use, daily CS dosage and cumulative CS dosage at the time of MR imaging, and all imaging parameters in the CS⫹patients. Significance thresholds for Pearson correlations were set atP⬍.01; all other results were considered significant atP⬍.05.
Results
One-way ANOVA revealed a significant difference in age between the groups (overallP⫽.026; post hoc
P ⫽ .025 between healthy controls and CS⫹; others not significant). No significant difference was ob-served for disease duration between CS⫹ and CS⫺ patients (P ⫽ .181). In 17 subjects, aspecific white matter hyperintensities were observed (5 healthy con-trols, 6 CS⫺, and 6 CS⫹ patients), while small, old lacunar infarctions were observed in 2 patients (one CS⫺ and one CS⫹). Total lesion volumes were very small and not significantly different between the groups (Table 2), so MTR and ADC histograms were generated for the whole brain parenchyma including the small lesions. For both DWI and MR spectros-copy, one dataset was excluded because of a scanner-related artifact; lipid contaminations prohibited cal-culation of MR spectroscopy spectra in 2 additional cases.
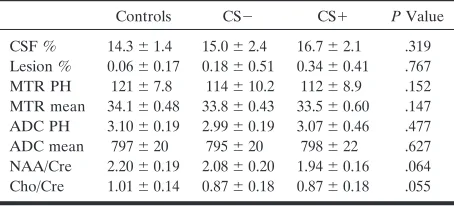
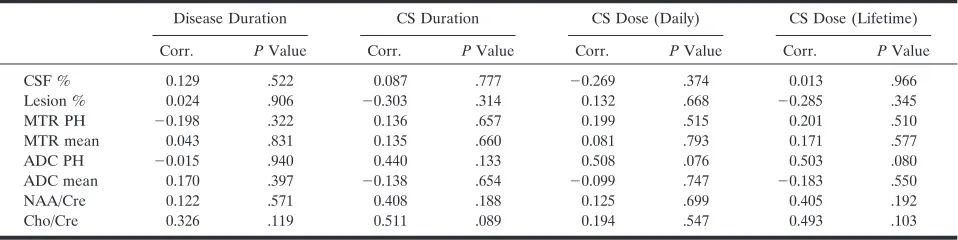
Univariate analyses with age as a covariate revealed no significant differences between the CS⫹and CS⫺ patients and healthy controls for the quantitative MR parameters (Table 2). No significant Pearson corre-lations were observed between any of the clinical and imaging parameters (Table 3).
Discussion
In this study, we evaluated the effect of low-dose oral CS on cerebral atrophy and whole-brain MTI
and DWI parameters and single-voxel MR spectros-copy measurements in subjects without CNS disease. Our results indicate that oral CS in a relatively low dose as is frequently prescribed to NPSLE patients does not significantly affect brain parenchyma volume and MTI, DWI, and MR spectroscopy parameters.
Prednisolone is a glucocorticoid with anti-inflam-matory and immunosuppressive features. (Badsha and Edwards [14] provide a detailed description on the actions of glucocorticoids.) In a low oral dose of 7–15 mg daily, CSs have a beneficial effect on mild to moderate SLE manifestations (14). Intravenous methylprednisolone (IV-MP) at levels as high as 1000 mg for several days (14, 15) or even intrathecal ad-ministration (27), however, may be required to treat severe symptoms. Most studies examining CNS side effects of CS have focused on patients on such a high-dose intravenous CS regimen; however, lower dose oral prednisolone given for a longer period of time may also result in a cumulative CS dose of several grams (Table 1) and susceptibility to side effects (16).
[image:3.585.306.533.81.184.2]The mechanism by which CSs could affect brain parenchyma is not fully understood; however, 2 pos-sible explanations are steroid-induced protein catab-olism mediating a loss in cerebral tissue and induction of water loss due to decreased vascular permeability with secondary brain volume loss (28, 29). It is con-ceivable that the resulting changes in neuronal den-sity and axonal packing could affect parenchymal vol-ume and quantitative MR imaging parameters, because these are indicators of the structural integrity and chemical composition of the brain parenchyma (2). Apart from myelin integrity, MTR values are determined by inflammation and edema (3). There-fore, it could be expected that anti-inflammatory drugs such as CSs would affect MTR parameters. ADC values reflect the diffusivity of protons and are mainly determined by their distribution over the in-tracellular and exin-tracellular compartment and by the integrity of biologic barriers, factors that could be TABLE 2: Parameter values and results of univariate analyses with age as a covariate
Controls CS⫺ CS⫹ PValue
CSF % 14.3⫾1.4 15.0⫾2.4 16.7⫾2.1 .319 Lesion % 0.06⫾0.17 0.18⫾0.51 0.34⫾0.41 .767 MTR PH 121⫾7.8 114⫾10.2 112⫾8.9 .152 MTR mean 34.1⫾0.48 33.8⫾0.43 33.5⫾0.60 .147 ADC PH 3.10⫾0.19 2.99⫾0.19 3.07⫾0.46 .477 ADC mean 797⫾20 795⫾20 798⫾22 .627 NAA/Cre 2.20⫾0.19 2.08⫾0.20 1.94⫾0.16 .064 Cho/Cre 1.01⫾0.14 0.87⫾0.18 0.87⫾0.18 .055
Note.—CS indicates corticosteroids; CSF %, cerebrospinal fluid volume as a fraction of intracranial volume; Lesion %, lesion volume as a fraction of brain parenchyma volume; MTR PH and MTR mean, magnetization transfer ratio histogram peak height (arbitrary unit) and mean (percent unit); ADC PH and ADC mean, apparent diffusion coefficient histogram peak height (arbitrary unit) and mean (10⫺6
s/mm2); NAA/Cre and Cho/Cre, ratio ofN-acetylaspartate and choline
influenced by CSs (4). The NAA/Cre ratio is mainly determined by neuronal and axonal integrity, whereas an increase in Cho/Cre in the absence of a neoplasma is observed in inflammation (5). With a potential change in neuronal density and axonal packing and anti-inflammatory action, CSs could have an effect on both these ratios.
In the present study, we did not find more atrophy in patients on low-dose oral CS medication compared with patients and controls without CSs. As far back as the late 1970s, CT studies were performed in SLE patients to evaluate whether cerebral atrophy was caused by CSs or the underlying disease process (30); however, results from such CT studies, as well as from MR imaging studies that were more recently per-formed in SLE patients, are equivocal (18, 31, 32). Some studies indicated that cerebral atrophy was at least partially caused by the SLE disease process itself (9, 31, 32). Others suggested that cerebral atrophy resulted mainly from CS medication or from a poten-tial synergistic potentation of SLE and CS (18). Sim-ilarly, MR imaging studies in MS patients have yielded conflicting results regarding the cause of ce-rebral atrophy. In MS patients, brain volume as mea-sured by MR imaging was significantly decreased for 1 month following IV-MP (19). Another study re-ported oral CS tapering after IV-MP to influence brain volume without an effect of the IV-MP itself (28). Intriguingly, yet another study attributed pre-vention or delay of whole-brain atrophy to IV-MP (29).
To the best of our knowledge, this is the first study to evaluate the effects of low-dose oral CSs on whole-brain MTR and ADC histogram charac-teristics and to report that no such effect was ob-served. Previously, MR spectroscopy studies have been performed by others to evaluate the effect of CSs on brain metabolites in comparable doses to the doses used by the patients in our study. Results of these studies are equivocal (33, 34). Khiat et al (33) observed no significant differences in NAA/ H2O and Cre/H2O metabolites between patients
receiving CSs and healthy controls, which suggests that CSs had no effect on neuronal or glial
metab-olism. Although in the thalamic gray matter re-duced Cho/H2O was observed in patients treated
for more than 5 years, such effects were not found for white matter in frontal and temporal regions (33). Brown et al (34), by contrast, observed a significant difference between NAA/Cho and NAA/ (Cre⫹Cho) ratios between patients with and with-out CS use and attributed the different observa-tions in their study and the study by Khiat et al to the difference of calculating metabolite ratios rel-ative to Cre instead of H2O. In the same study, the
authors confirmed the absence of significant differ-ences in NAA/Cre and Cho/Cre ratios between patients with and without CSs, which is concordant with the findings in our study (34).
Theoretically, we could have compared SLE pa-tients with and without CS medication. Apart from systemic manifestations, however, a large number of SLE patients have CNS involvement at some time during the course of their disease (1). CSs will only be given during disease activity. Because it is not possible to ascertain that the CNS is not (sub-clinically) involved during times of systemic disease activity, it is impossible to set up a case-control study in which the effect of CS and disease activity can be distinguished. RA, by contrast, is a rheuma-tologic disorder that in general has no CNS involve-ment, because cerebral events occurring in RA pa-tients are most likely a reflection of these occurring in the general population (15). By comparing RA patients with and without CSs, we aimed to evalu-ate the effect of CSs on the outcome measures. Methotrexate has a potential neurotoxic effect when administered intrathecally or intravenously in high doses (35, 36), though in this study only low oral doses were used. To the best of our knowledge, there are no reports on quantitative MR imaging studies and low-dose oral methotrexate or the other DMARDs. Twenty-six of 27 RA patients used DMARDs. The lack of a significant difference be-tween RA patients with and without CSs and with the group of healthy controls makes a potential confounding effect of DMARDs very unlikely.
[image:4.585.55.534.70.190.2]Subjects were not fully matched for age, though age TABLE 3: Pearson correlation coefficients between imaging and clinical parameters
Disease Duration CS Duration CS Dose (Daily) CS Dose (Lifetime)
Corr. PValue Corr. PValue Corr. PValue Corr. PValue
CSF % 0.129 .522 0.087 .777 ⫺0.269 .374 0.013 .966 Lesion % 0.024 .906 ⫺0.303 .314 0.132 .668 ⫺0.285 .345 MTR PH ⫺0.198 .322 0.136 .657 0.199 .515 0.201 .510 MTR mean 0.043 .831 0.135 .660 0.081 .793 0.171 .577 ADC PH ⫺0.015 .940 0.440 .133 0.508 .076 0.503 .080 ADC mean 0.170 .397 ⫺0.138 .654 ⫺0.099 .747 ⫺0.183 .550 NAA/Cre 0.122 .571 0.408 .188 0.125 .699 0.405 .192 Cho/Cre 0.326 .119 0.511 .089 0.194 .547 0.493 .103
Note.—CS indicates corticosteroids; Corr., Pearson correlation coefficient; CSF %, cerebrospinal fluid volume as a fraction of intracranial volume; Lesion %, lesion volume as a fraction of brain parenchyma volume; MTR PH and MTR mean, magnetization transfer ratio histogram peak height (arbitrary unit) and mean (percent unit); ADC PH and ADC mean, apparent diffusion coefficient histogram peak height (arbitrary unit) and mean (10⫺6
s/mm2
was corrected for in the statistical model. Lesion volumes were very small and not significantly differ-ent between the groups, so we decided to generate MTR and ADC histograms of the whole brain, ex-cluding CSF. In 4 subjects (one CS⫹patient, 2 CS⫺ patients, and one healthy control), a small lactate peak was observed; however, repeating the univariate analysis for NAA/Cre and Cho/Cre ratios without these subjects did not reveal any significant differ-ences between the groups. Short T2 metabolites such as glutamate-glutamine and myoinositol could not reliably be detected in this study because of the rel-atively long TE (136 msec) used for MR spectroscopy. Metabolite concentrations were expressed as ratios to creatine because of the absence of an internal refer-ence scan in our MR spectroscopy scanning protocol. Although the daily CS dose used by patients included in this study was relatively low, this is a dose frequently encountered in (NP-) SLE patients. By use of whole-brain MTI and DWI and single-voxel MR spectroscopy, the current view on the abnormalities found in NPSLE patients points to a loss of cerebral tissue homogeneity due to neuronal and/or axonal damage, demyelination and cerebral atrophy (6 –11, 13). Although diffuse NPSLE man-ifestations may be diverse, a recent multimodality study combining these techniques in one NPSLE patient group has suggested one pathogenetic path-way or several pathpath-ways with a common neuro-pathologic outcome with neuronal-axonal damage, demyelination, and cerebral atrophy often coexist-ing in NPSLE patients (12). In light of the results of the present study, we suggest that it is very unlikely that previously reported whole-brain MTR and ADC histogram parameters and single-voxel MR spectroscopy abnormalities in NPSLE patients are confounded by the use of low-dose oral CS medication.
Conclusion
In this study, we found no significant effect of low-dose oral CSs on whole-brain MTI and DWI histogram parameters or single-voxel MR spectros-copy measurements. The results of this study demon-strate that it is unlikely that MTI, DWI, and MR spectroscopy parameters reported in NPSLE studies are confounded by low-dose oral CSs.
References
1. Sibbitt WL, Sibbitt RR, Brooks WM.Neuroimaging in neuropsy-chiatric systemic lupus erythematosus.Arthritis Rheum 1999;42: 2026 –2038
2. Huizinga TW, Steens SC, van Buchem MA.Imaging modalities in central nervous system systemic lupus erythematosus.Curr Opin Rheumatol2001;13:383–388
3. Tofts PS, Steens SC, van Buchem MA.MT: magnetization transfer. In: Tofts PS, ed.Quantitative MRI of the brain: measuring changes caused by disease.1st ed. Chichester: Wiley;2003:257–298 4. Wheeler-Kingshott CA, Barker GJ, Steens SC, et al.D: the
diffu-sion of water. In: Tofts PS, ed. Quantitative MRI of the brain: measuring changes caused by disease. 1st ed. Chichester: Wiley;2003:203–256
5. Tofts PS, Waldman AD.Spectroscopy: 1H metabolite
concentra-tions.In: Tofts PS, ed.Quantitative MRI of the brain: measuring changes caused by disease.1st ed. Chichester: Wiley;2003:299 –339 6. Bosma GP, Rood MJ, Zwinderman AH, et al.Evidence of central
nervous system damage in patients with neuropsychiatric systemic lupus erythematosus, demonstrated by magnetization transfer im-aging.Arthritis Rheum2000;43:48 –54
7. Bosma GP, Rood MJ, Huizinga TW, et al.Detection of cerebral involvement in patients with active neuropsychiatric systemic lu-pus erythematosus by the use of volumetric magnetization transfer imaging.Arthritis Rheum2000;43:2428 –2436
8. Bosma GP, Huizinga TW, Mooijaart SP, van Buchem MA. Abnor-mal brain diffusivity in patients with neuropsychiatric systemic lupus erythematosus.AJNR Am J Neuroradiol2003;24:850 – 854 9. Sibbitt WL, Haseler LJ, Griffey RH, et al.Analysis of cerebral
structural changes in systemic lupus erythematosus by proton MR spectroscopy.AJNR Am J Neuroradiol1994;15:923–928
10. Brooks WM, Sabet A, Sibbitt WL, et al.Neurochemistry of brain lesions determined by spectroscopic imaging in systemic lupus erythematosus.J Rheumatol1997;24:2323–2329
11. Sibbitt WL, Haseler LJ, Griffey RR, et al. Neurometabolism of active neuropsychiatric lupus determined with proton MR spec-troscopy.AJNR Am J Neuroradiol1997;18:1271–1277
12. Bosma GP, Steens SC, Petropoulos H, et al.Multisequence mag-netic resonance imaging study of neuropsychiatric systemic lupus erythematosus.Arthritis Rheum2004;50:3195–3202
13. Steens SC, Admiraal-Behloul F, Bosma GP, et al.Selective gray matter damage in neuropsychiatric lupus. Arthritis Rheum
2004;50:2877–2881
14. Badsha H, Edwards CJ.Intravenous pulses of methylprednisolone for systemic lupus erythematosus. Semin Arthritis Rheum
2003;32:370 –377
15. Nadeau SE.Neurologic manifestations of connective tissue disease.
Neurol Clin2002;20:151–178, vi
16. Lundberg IE, Grundtman C, Larsson E, Klareskog L. Corticoste-roids: from an idea to clinical use.Best Pract Res Clin Rheumatol
2004;18:7–19
17. Keenan PA, Jacobson MW, Soleymani RM, et al.The effect on memory of chronic prednisone treatment in patients with systemic disease.Neurology1996;47:1396 –1402
18. Zanardi VA, Magna LA, Costallat LT.Cerebral atrophy related to corticotherapy in systemic lupus erythematosus (SLE).Clin Rheu-matol2001;20:245–250
19. Rao AB, Richert N, Howard T, et al.Methylprednisolone effect on brain volume and enhancing lesions in MS before and during IFNbeta-1b.Neurology2002;59:688 – 694
20. Arnett FC, Edworthy SM, Bloch DA, et al.The American Rheu-matism Association 1987 revised criteria for the classification of rheumatoid arthritis.Arthritis Rheum1988;31:315–324
21. Naressi A, Couturier C, Castang I, et al.Java-based graphical user interface for MRUI, a software package for quantitation of in vivo/medical magnetic resonance spectroscopy signals. Comput Biol Med2001;31:269 –286
22. Woods RP, Grafton ST, Holmes CJ, et al.Automated image reg-istration. I. General methods and intrasubject, intramodality val-idation.J Comput Assist Tomogr1998;22:139 –152
23. Woods RP, Grafton ST, Watson JD, et al.Automated image reg-istration. II. Intersubject validation of linear and nonlinear mod-els.J Comput Assist Tomogr1998;22:153–165
24. Steens SC, Admiraal-Behloul F, Schaap JA, et al.Reproducibility of brain ADC histograms.Eur Radiol2004;14:425– 430
25. van den Boogaart A, van Ormondt D, Pijnappel WWF, de Beer R, Ala Korpela M.Removal of the water resonance from 1H magnetic resonance spectra. In:Mathematics in signal processing,3rd ed. Oxford: Clarendon Press;1994:175–195
26. Vanhamme L, van den BA, van Huffel S.Improved method for accurate and efficient quantification of MRS data with use of prior knowledge.J Magn Reson1997;129:35– 43
27. Funauchi M, Ohno M, Nozaki Y, et al.Intrathecal corticosteroids for systemic lupus erythematosus with central nervous system involvement.J Rheumatol2003;30:207–208
28. Hoogervorst EL, Polman CH, Barkhof F.Cerebral volume changes in multiple sclerosis patients treated with high-dose intravenous methylprednisolone.Mult Scler2002;8:415– 419
29. Zivadinov R, Rudick RA, De Masi R, et al.Effects of IV methyl-prednisolone on brain atrophy in relapsing-remitting MS. Neurol-ogy2001;57:1239 –1247
atro-phy in systemic lupus erythematosus: steroid- or disease-induced phenomenon?AJNR Am J Neuroradiol1982;3:21–23
32. Friedman SD, Stidley CA, Brooks WM, et al.Brain injury and neurometabolic abnormalities in systemic lupus erythematosus.
Radiology1998;209:79 – 84
33. Khiat A, Yared Z, Bard C, Lacroix A, Boulanger Y.Long-term brain metabolic alterations in exogenous Cushing’s syndrome as monitored by proton magnetic resonance spectroscopy.Brain Res
2001;911:134 –140
34. Brown ES, Woolston J, Frol A, et al.Hippocampal volume, spec-troscopy, cognition, and mood in patients receiving corticosteroid therapy.Biol Psychiatry2004;55:538 –545