Two-Dimensional Time-Resolved X-ray Diffraction Study
of Directional Solidification in Steels
Mitsuharu Yonemura
1, Takahiro Osuki
1, Hidenori Terasaki
2, Yuichi Komizo
2,
Masugu Sato
3and Hidenori Toyokawa
31Corporate Research and Development Laboratories, Sumitomo Metal Industries, Ltd., Amagasaki 660-0891, Japan 2Joining and Welding Research Institute, Osaka University, Ibaraki 567-0047, Japan
3Japan Synchrotron Radiation Research Institute, Mikazuki, Sayo 679-5198, Japan
In situcharacterization of directional solidification process during welding was carried out using the time resolved X-ray diffraction technique utilizing intense synchrotron radiation. Then, behaviour of dendrites in steels under welding conditions of a practical manufacturing process were investigated using the TRXRD method forin-situweld observation with the uniquely-sensitive two-dimensional pixel detector. Consequently, the crystal growth during the rapid cooling was caught in detail and employed a systematic peak profile analysis in order to acquire the essential information for controlling the weld microstructure. Our results would suggest the microstructure formation process of low alloy in directional solidification during rapid cooling. Simultaneously, we discuss the possibility of detecting the nucleation.
[doi:10.2320/matertrans.47.2292]
(Received March 8, 2006; Accepted July 18, 2006; Published September 15, 2006)
Keywords: welding, steels, phase transformation, rapid solidification, in situ time-resolved X-ray diffraction
1. Introduction
High intensity heat sources used for fusion welding create steep thermal gradients, which produce phase and micro-structural changes in materials as they are rapidly heated and cooled to and from their melting points. The rapid thermal cycling that takes place induces melting and solidification in those parts of the weld where the liquidus temperature has been exceeded, as well as solid state phase transformation on both heating and cooling during welding. When steels are welded, the optimized base metal properties are altered by the localized weld thermal cycle. The result is the creation of non-equilibrium microstructures in the weld. These micro-structures are significantly different in both appearance and properties from those found in the base metal. Such non-equilibrium phases can compromise the integrity of the weld joint, making it important to understand how the welding conditions lead to their creation. However, it was difficult to observe the microstructural changes of weld metals dynam-ically, under rapid cooling over several hundred Kelvin per second. So the solidification morphology has been observed by the Scanning Electron Microscope (SEM), using the liquid-tin quenching method in high alloys that have some influence on solid-transformation.1–3) Since late nineties,
Elmer et al.4–6) has used intense synchrotron radiation and
has directly revealed the phase mapping around the heat source, during pure titanium welding. After that, Babuet al.
investigated the primary weld solidification in the Fe-C-Al-Mn steel weld7–9)using the Time-Resolved X-Ray
Diffrac-tion (TRXRD) technique. Their remarkable results were devoted to the heat affected zone (HAZ). In contrast, several researchers observed the real-time growth of dendrites in alloys using synchrotron microradiograph in the real space.10–12) However, it is impossible to obtain the quanti-tative information such as phase transformation and preferred orientation in the real space.
Our interest is details of the weld solidification phenomena
in the directional solidification process under rapid cooling. With the availability of intense X-ray beams from synchro-tron storage rings, it is now possible to make a direct observation of phase transformation and microstructural evolution in situand in real time as a function of welding time. In our previous work, a numerical model to predict the microstructure of austenitic stainless steel weld metal was proposed, and spatially resolved X-ray diffraction using synchrotron radiation was carried out for weld metals of high alloys, quenched in liquid tin, to verify the validity of the numerical mode. The crystallization temperatures predicted by the numerical model for secondaryandphases in weld metals agreed with experimental data.13) Further,
combina-tion of analyzing method: the in-situ phase identification system, morphological observation by high-temperature laser scanning confocal microscopy and observation of micro-structure at room temperature by optical microscope, scan-ning electron microscope and micro diffraction-system, is suggested to analyze the phase transformation during weld-ing process. Consequently, phase transformation process of hypereutectoid carbon steel, during welding was analyzed as an example of a combination observation.14–16)Furthermore, we carried outin-situ observation for weld solidification in stainless steels using time-resolved X-ray diffraction. We assumed the rotation of dendrites from the discontinuous diffraction pattern recorded by the imaging plate along one-direction of the reciprocal space.17–21)Then, the nucleus of
directional solidification during rapid cooling was obtained for the first time. Our results would suggest the micro-structure formation process of low alloy in directional solidification during rapid cooling. Simultaneously, we discuss the possibility of detecting the nucleation.
2. Experiments
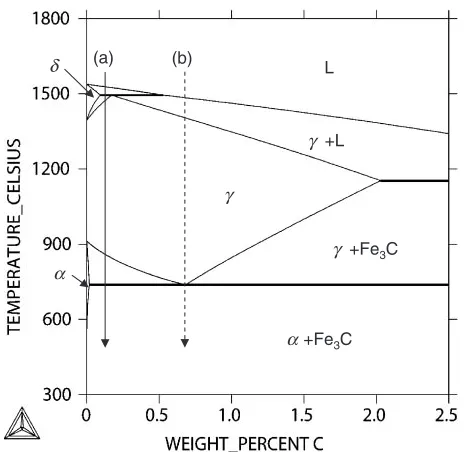
The specimens were prepared for a low alloy with the basic concentration of Fe-0.02%C and Fe-0.88%C. The carbon content of steels play an important role in the microstructural evolution of the weld. The phase transformation sequence was calculated from equilibrium thermodynamic relation-ships using Thermocalc software version Q with the iron based alloy database as shown in Fig. 1. The thermodynamic calculations indicate that the equilibrium microstructure of these alloys after solidification consists of a mixture of ferrite and Fe3C carbide phases. During cooling, the ferrite (phase) first appears at 1500C in Fe-0.02%C. This microstructure
begins to transform to austenite ( phase) when the temper-ature reached 1450C. It begins to transform to the ferrite
( phase) when the temperature reached 800C. Complete
transformation to ferrite occurs when the temperature reached 730C. Then, these ferrite and Fe3C carbide phases
remaind stable. On the other hand, in Fe-0.88%C, this microstructure begins to transform to austenite ( phase) when the temperature reached 1500C. Complete
trans-formation to austenite occurs when the temperature reached 1450C. It begins to transform to the ferrite (phase) when
the temperature reached 730C, and these ferrite and Fe3C carbide phases remain stable. However, kinetic limitations may alter the predicted phase transformation start and
completion temperatures, and may produce non-equilibrium phases.
In the TRXRD, the time series transition of the diffraction patterns in the solidification process of welding was measured. The XRD experiments were performed on the BL46XU beam line with the undulator at the SPring-8 with the approval of the Japan Synchrotron Radiation Research Institute (Hyogo, Japan).25) The experimental set-up of
original TRXRD technique for welding is summarized schematically in Fig. 2. The time resolved diffraction patterns in the solidification process was measured while a torch moves vertically to an X-ray incident beam at the speed of 1.0 mm/s by an automatic stage. The incident angle () of X-ray beam was fixed at 10. Further, the welding assembly was tilted as the arc is vertically to the surface of sample. Then, the 9-mm-wide fusion zone was formed on the surface of the steel plate. The photon energy of 18 KeV was chosen to maximize the intensity and the number of peaks into the2
window of the detector. The wavelength calibrated by the Rietveld refinement of the LaB6 standard specimen is 0.0689 nm.26,27) Adjustment of the specimen-to-detector
distance (camera length), is best made by distances between five direct spots with five degree intervals (r). The camera length (D) was decided very simply from the relation
Dtan 2¼r. The slit size is W0:1mmL0:5mm. Then, radiation area is about W0:1mmL2:8mm in the perpen-dicular to the direction of dendrite growth for incident angle () of 10. It is small for 9–10 mm in the width of the weld
bead. Then, the penetration depth of X-ray is guessed to be about 10mm. The dispersive angle of X-ray is guessed to be about 20 arcsec from the reflectivity of the silicon wafer.
The TRXRD data was collected at a single location during welding. The weld metals have the preferred orientation by
h100ieutectic along the growth direction and the weak broad pattern. Therefore, it is difficult to simultaneously record the first and second phases. Consequently, diffraction patterns collected with a uniquely-sensitive two-dimensional pixel detector that was developed by SPring-8 detector team in collaboration with Paul Scherrer Institute (PSI) in Switzer-land. The counters can be read out digitally with a frequency of 10 MHz. It leads the maximum flame rate to 30 Hz with the readout time of 6.7 ms. This detector was mounted on the arm of four-axis diffractometer at a distance of approximately 286 mm behind the weld to cover a 2 range from 19 to 51 deg. This2range was optimized to contain a total of five diffraction peaks, three from BCC phase (-Fe or-Fe) and two from the FCC phase (-Fe). That is, qx and qy of
reciprocal space coordinates (¼4sin=) become 30–79 and12–þ12respectively. Therfore, the lattice spacing of 0.08–0.2 nm can be measured.
The cooling rate, i.e., solidification speed, is controlled by the arc power and the scan speed of the torch. The power was maintained at a constant 1.5 kW (150 A, 10 V) for all of the welds, and high pure argon was used as a shielding gas. The heating temperature on the back of the specimen was prevented by a water-cooled copper plate and a ceramic insulation material. TRXRD experiments provide informa-tion about phase transformainforma-tion as a funcinforma-tion of weld time, but do not directly provide information about weld temper-atures. In order to relate weld time to weld temperature, the γ
γ +L
L δ
α
(a) (b)
γ +Fe3C
α+Fe3C
Fig. 1 The phase transformation sequence calculated from equilibrium thermodynamic relationships using Thermocalc software version Q with the iron based alloy database. The thermodynamic calculations indicate that the equilibrium microstructure of these alloys after solidification consists of a mixture of ferrite and Fe3C carbide phases. The phase
[image:2.595.53.287.69.295.2]temperature of the weld metal was measured continuously by the thermocouple of type R.17)We utilized one of the cases
that the thermocouple did not react with molten steels and where it contacted enough with molten steels.
Our technique can capture the change of the dendrite microstructure that grows up after weld melting. The direction of incident beam is very important as each dendrites are considered like single crystals. That is, dendrites that grow in the parallel to the arc movement would contribute to the diffraction. In contrast, dendrites that rotate by axis of plane normal of sample would not contribute to the diffraction. Therefore, dendrites that grow up epitaxially from surface of Heat Affected Zone (HAZ) heated just under melting point would not contribute to the diffraction. Meanwhile, though J. Wong et al. perform the same kind of experiment,28) their techniques would catch
microstruc-tural change of the spot solidifications by on/off of heat source. Therefore, the processes of the dendrite growth would controlled by epitaxial growth from HAZ. It is not directional solidification process for welding cycle.
3. Results and Discussion
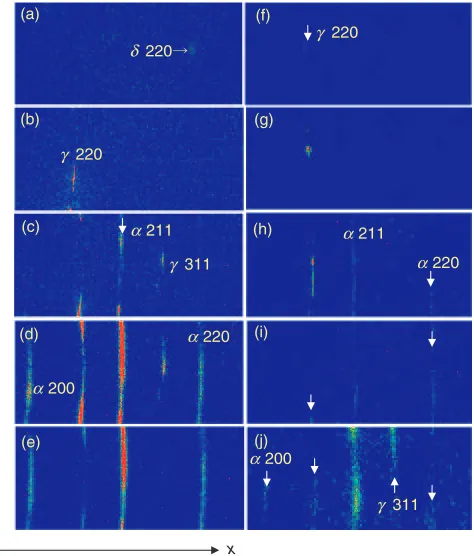
Figure 3 shows some information of Laue patterns about phases that exist at all times during the weld cycle. For Fe-0.02%C, Laue patterns are indicated at approximately (a) 1500C, (b) 1450C, (c) 600C, (d) 500C and (e) 400C and
for Fe-0.88%C at approximately (f) 1500C, (g) 1300C, (h)
700C, (i) 600C and (j) 400C during welding. Thex-yaxis
is corresponded to that in Fig. 2. The origin of the reciprocal lattice is on the left hand side parallel toxaxis. Therefore, the right hand side corresponds to high2value. In Fe-0.02%C, the diffraction pattern of the 220 first appears at approx-imately 1500C as shown in Fig. 3(a). The diffraction pattern
of thephase begin to transform to the secondaryphase at 1450C as shown in Fig. 3(b). At 600C, the diffraction pattern ofphase appears while the diffraction intensity of
phase decreases as shown in Fig. 3(c) suggesting !
solid-state transformation. Then, a somewhat finer grain size increases the number of Laue spots and the suggestion of Laue rings begins to appear. A still finer grain size produces the smooth, continuous Laue ring as shown in Fig. 3(d). That is, thephase continues to increase in amount as the !
solid-state transformations proceed. Finally, the diffraction pattern of the residual and phases mainly coexist as shown in Fig. 3(e). The solid-transformation to the pearlitic microstructure which consists of ferrite and cementite during cooling is well known. Therefore, it is expected that Fe3C phases would simultaneously appear withphase. However, peaks of Fe3C phases could not be observed as the these diffraction intensity were weak in angular range. Conse-quently, it is considered that formation of the continuous Laue-ring is referred to miniaturization of microstructure due to generation of theand Fe3C phases in the final stage of solidification. Further, it is expected that thephase would transform to the phase by having a preferred orientation. The main orientation seems to be 220== 211 by the angular relationship of the diffraction spots ofandphases. However, the generation of Body-Center-Tetragonal (BCT) lattice is known by 220== 200 in the solid transforma-tion.29) Therefore, it is considered that dendrites that has
grown up from the inside of the sample to the surface would influence on the diffraction. Further, the peak width on the projected images gradually increased. This broadening of the tail by increase of intensity means increase of phase with preferred orientation.
In Fe-0.88%C shown on the right hand side in Fig. 3, the γ 220
(b)
δ 220 (a)
α211 γ 311 (c)
α200
α220 (d)
(e)
γ 220
α211
α220
α200
γ 311 y
x (f)
(g)
(h)
(i)
(j)
Fig. 3 Change of the diffraction pattern for the high alloy (a-d) and low alloy (e-h) during welding. (a)1450, (b)1400, (c)1350, (d)1000, (e)1500C, (f)1450C, (g)600C and (h)400C. Thex-yaxis
corresponded to that in Fig. 2.
Two-dimensional pixel detector
Arc Scan(1mm/s) Power(10V, 150A)
Specimen
y x
Synchrotron radiation Weld pool
Thermocouple
Exposure time: ~ 0.15s Pixel size:366×157 Recording area: 79.4mm×34.0mm Synchrotron radiation (18KeV)
α
2θ=35°
Scan of arc =10°
Fig. 2 The experimental set-up of original TRXRD technique for welding. The photon energy of 18 KeV was chosen to maximize the intensity and the number of peaks into the2window of the detector. The incident angle () of X-ray beam was fixed at 10. The time resolved diffraction patterns
[image:3.595.311.548.72.350.2] [image:3.595.49.291.72.220.2]diffraction pattern of phases first appears at about 1500C as shown in Fig. 3(f). The diffraction intensity of thephase gradually increases as shown in Fig. 3(g). At 700C, the
diffraction spots of the phase extend iny-direction. while the diffraction pattern of secondaryphase appears as shown in Fig. 3(h). These diffraction intensities of the phase gradually increase while the diffraction patterns of phase become weak as shown in Fig. 3(i). Finally, the diffraction pattern of the residual and phases mainly coexist as shown in Fig. 3(j). The comparatively random microstruc-ture is formed as shown by the continuous ring pattern in Fig. 3(j). It is considered that this phenomenon is referred to miniaturization of microstructure due to the solid-trans-formation, i.e. generation of the and Fe3C phases, in the final stage of solidification. When the grain size is further reduced, the Laue spots merge into a general background and only Debye rings are visible. Therefore, it is expected that grains in Fe-0.88%C distribute finely and randomly than those in Fe-0.02%C. Further, the orientation relationship differs from that of Fe-0.02%C, and not only 220== 211 but also 220== 200 is observed. The relationship of
220== 200 corresponds to Kurdjumov-Sachs (K-S) rela-tionship.30,31) That is, it is considered that the original
relationship appeared by the progress of minimization of microstructure.
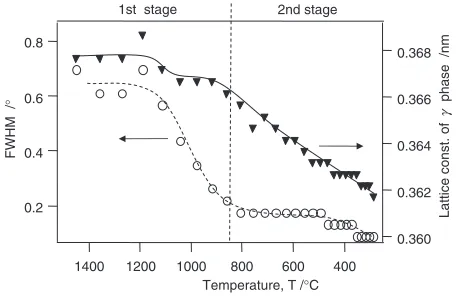
The TRXRD results presented above provide information about the crystallographic parameters of phases as a function of weld cooling temperature. There is a wealth of information about the lattice parameter of each phase and how they change with welding time, plus other information such as the width, intensity, and areas of each of the diffraction peaks during the welding cycle. The change of the diffraction pattern of 220 in Fe-0.88%C during rapid cooling was quantitatively plotted in Fig. 4(a). The displacement of the lattice parameter and the Full-Width of Half-Maximum (FWHM) along thex-direction were shown on the right axis and left axis as a function of weld temperature, respectively. The lattice constant is converted into uniform strain. Convergent of the lattice spacing to the equilibrium value means the increase of crystallinity. The lattice spacing can be determined from the2positions of the diffraction peaks of
220 using Bragg’s law and normalized energy of the incident beam. In contrast, the FWHM is converted into the size of crystallites and non-uniform strains. If a material expands or contracts as a function of temperature without undergoing a phase transition, the position of the reflections in the diffraction pattern change. If the crystallite is given a uniform tensile strain at right angles to the diffraction planes, their spacing becomes larger than equilibrium spacing, and the corresponding diffraction line shifts to lower angles but does not otherwise change. The grain is bent and the strain is non-uniform, on the tension side the Bragg plane spacing exceeds equilibrium spacing, on compression it is less than equilibrium spacing, and somewhere in between it the equilibrium spacing. Thus, a crystallite can be thought of as composed of a number of small regions each of which the plane spacing is substantially constant but different from the spacing in the adjoining regions. Consequently, it should be noted that the crystal growth of dendrites mainly consists of two stages. First, the FWHM rapidly becomes narrow up to
about 800C, suggesting the increase of crystallites size.
Second, the lattice constant rapidly shift to the low angle from about 800C, suggesting the improvement of
crystal-linity and the solidification shrinkage. The crystalcrystal-linity improves from about 900C after the crystallites size increase
rapidly. The lattice constant decreases about 0.005 nm between 977 and 415C. In a word, the fraction of shrinkage
ratio per Kelvin in the rapid cooling process is1:9105/K. It corresponds to the thermal expansion coefficient 2
105/K of general low carbon steel.32)
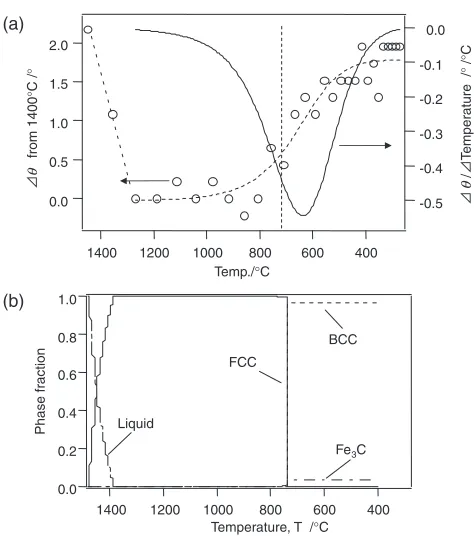
Next, Figure 5(a) shows the angular displacement of the
220diffraction spot on the Laue-ring. Fig. 5(b) shows the phase fraction calculated bythermocalcsoftware. The circles in the Fig. 5(a) mean a displacement angle based on 1400C.
This displacement means a geometrical tilt in the normal to the direction of dendrite growth. This is different from the rotation that centers on the direction of dendrite growth suggested by high-alloy steels.17)Considering geometry, the
diffraction spots would blink on the two-dimensional diffraction pattern by rotation of the dendrite. However, the diffraction spot of 220 in the low-alloy is caught as a continuous change from the mist-like pattern to the sharp spot. Further, the crystallites tilt rapidly more than 1300C.
Compared to the calculated phase fraction, this displacement may be synchronized to decrease liquid as shown by solid line in Fig. 5(b). That is, it would be behavior of the crystallites that is mobile in the liquid. Next, the crystallites stop tilting at 800C and tilt greatly until 400C. The crystallites stop tilting again at 400C. The dendrites tilt in
total by approximately one degree. A solid line in Fig. 5(a) is the differential of a break line, showing the tilt angle of crystallites for approximately 1C. The maximum absolute
value is in the vicinity of about 650C. It is thought that the
refinement of the microstructure influences formation of the
and Fe3C phases around 650C. A steep increase in the
phase (BCC) is shown by the break line in the equilibrium diagram calculation in Fig. 5(b). However, the microstruc-ture continuously tilts in non-equilibrium rapid cooling because the phase increases continuously in our experi-ment. That is, there would be possibilities of precursor of the phase transformation, and fluctuation of the eutectic point. Moreover, it seems that the microstructure formation due to the phase transformation was completed at 400C since the
1st stage 2nd stage
0.8
0.6
0.4
0.2
FWHM /
°
1400 1200 1000 800 600 400
Temperature, T /°C
0.368
0.366
0.364
0.362
0.360
Lattice const. of
γ
phase /nm
[image:4.595.313.541.73.221.2]crystallites stop tilting again. Thus, there are two tilting zones, one is due to crystallites in the liquid and the other is due to formation of a microstructure.
The change of diffraction pattern was observed in detail in order to reveal the growth process of dendrites. Figure 6 shows images of220diffraction pattern in the Fe-0.88%C in the initial stage. Diffraction patterns (a, b, c and d) of220 corresponds to 1440, 1350, 920 and 420C, respectively.
The Fig. 6(a) indicates the weak broad pattern which we could observe at first. The slight sharpening of the peak profile at 1350C is clearly evident in the pixel detector
record, and so is the doublet resolution which occurs at 920C. But note that the pixel detector can not observe spotty diffraction patterns. The pixel detector record would imme-diately suggest that the specimen at 420C had high
crystallinity. Thus, the diffraction pattern changes remark-ably from the isotropic weak broad pattern like a mist to the sharp spot along with the temperature drop. The change of these profiles were shown quantitatively by a high temper-ature range in Fig. 4(a). In our previous work, it was expected that the mist-like pattern would be correlated with the nucleus of dendrites in the high alloy.17) That is, the
phenomena in the vicinity of the critical nucleus may be observed on average as weak broad patterns that are scattered by the wide distribution of lattice spacing and atomic distance. Dendrites behaviour in the low alloy would be also similarly expected in the high alloy. However, the behaviour of dendrite growth is different from each other.
The section along the x-direction in Fig. 6(a) was
quan-tified in order to observe the behaviour of crystallite in the initial stage. The results of the peak separation is shown in Fig. 6(e). The crystallite size can be determined easily by the Scherrer method through individual peak profile analysis.33)
Integral breadth is given by the integrated intensity divided by the maximum intensity, i.e., it is the width of a rectangle having the same area and height as the observed line. The experimental data is shown by the break line. The exper-imental data was smoothed along the x-direction. While, solid lines represent overlapping peaks separated by Gauss-ian fitting. It corresponds to the temperature drop of approximately 30C in the vicinity of 1400C since the
exposure time is 0.15 seconds. The peaks of different angles appear by fitting on two overlapping peaks since peak profile has a shoulder. Therefore, two-kinds of components are expected for two peaks between approximately 30C. The
Liquid
FCC
BCC
Fe3C 2.0
1.5
1.0
0.5
0.0
θ
from 1400
°
C /
°
1400
(a)
(b)
1200 1000 800 600 400
Temp./°C
-0.5 -0.4 -0.3 -0.2 -0.1 0.0
/
θ
T
e
mper
ature /
°
/°
C
1.0
0.8
0.6
0.4
0.2
0.0
Phase fr
action
1400 1200 1000 800 600 400
Temperature, T /°C
Fig. 5 Angular displacement of the 220 and phase fraction. (a) the angular displacement of the220diffraction spot on the Laue-ring. The circles mean a displacement angle based on 1400C. A solid line is a
differential of a break line, showing the tilt angle of crystallites per degree C. (b) the phase fraction calculated bythermocalcsoftware. Comparing with the calculated phase fraction, this displacement may be synchronized to the decrease of liquid as shown by solid line.
y
x
(a) (b)
(c) (d)
2nm
10nm
2θ
Intensity /a.u.
Experimental Simulation
28o 29o 30o 31o 32o 33o (e)
Fig. 6 Images of220diffraction pattern in the Fe-0.88%C in initial stage. Diffraction patterns (a, b, c and d) of220corresponds to 1440, 1350, 920 and 420C, respectively. The section along thex-direction in Fig. 6(a) was
[image:5.595.49.286.67.335.2] [image:5.595.313.539.72.449.2]individual crystallite of such a material is often non-uniformly strained, and this can also broaden the diffraction lines. On the other hand, the individual crystals, which make up a loose powder of fine particle size, can often be assumed to be strain-free, provided the material involved is a brittle one and all the observed broadening can be ascribed confidently to the crystallite size effect. Then the crystallite sizes could be estimated as approximately 1 nm and 5 nm, respectively. The crystallite of several nanometer-sizes would be similar to that of critical nucleus. Further, it should be noted that these two-profiles have a difference of 1% or less at lattice mismatch, like the super-lattice structure. It is considered that the composition of nucleus would be different from that of phase. In contrast, it is considered that the crystallite of 5 nm-size would be the composition of phase since the maximum of diffraction profile continuously changes and the X-ray intensity of the main constituent increases with a temperature drop. There is a possibility to get some information of heterogeneous nucleation. Accord-ing to the theory advanced by Turnbull and Vonnegut, a nucleating agent will be effective in promoting nucleation when the lattice parameters in the low-index crystallographic planes of both the substrate and the nucleated solid are similar. The degree of mismatch of these parameters, i.e., the disregistry, is expressed as ¼a0=a. Therefore, it would be very interesting if the crystallite of several nanometer-sizes corresponds to the first nucleus like oxide, carbide and nitride. The disregistry between the catalyst and the matrix was a significant factor for nucleation behaviour since some of the oxides had small disregistries. Though no further information has been analyzed, our technique may give the possibility that understand the behaviour of crystallites in the vicinity of critical-nucleus.
Finally, in the discussion about the FWHM in the vicinity of the melting point, it is necessary to consider the influence of Thermal Diffuse Scattering (TDS). The incoherent part of TDS becomes a background, and the coherent part becomes halo-patterns of liquid phase. It is considered that the former becomes the uniform background and has been deleted by the background removal. The latter is observed about 18 degrees outside this measurement region. It is guessed it might be extremely weak since the second halo-pattern as it guesses from the intensity of the first halo-pattern. Moreover, it is guessed that the thermal vibration might influence the FWHM from the thermal expansion of about 1400C by about 1.5%. The influence of TDS would be not remarkable.
4. Conclusion
We investigated the directional crystal growth with the information of nucleation by combination of the welding technique and the two-dimensional detector with high time resolution excluding the influence of the crystal preferred orientation. These experimental observations provided in-situdiffraction patterns of the phase transformations occur-ring duoccur-ring rapid weld cooling.
(1) In Fe-0.88%C, the K-S relationship appeared. It is considered that the original relationship appeared by progress of minimization of microstrucure.
(2) The improvement of crystallinity and the solidification
shrinkage takes after the increase of crystallites size. (3) The fraction of shrinkage ratio per Kelvin in the rapid
cooling process is 1:9105K1, which corresponds to the thermal expansion coefficient 2105K1 of general low carbon steel.
(4) The maximum tilt is in vicinity of about 650C, which
corresponds to refinements of microstructure.
(5) There are two tilting zones, one is due to crystallites in the liquid and the other is due to the formation of a microstructure.
Acknowledgements
The author is grateful to Dr. Kenji Suzuki at Sumitomo Metals Industries for profitable discussion. The author would like to express his thanks to Mr. Shouichirou Inoue and Mr. Kazuhiro Miyabe at Sumitomo Metals Industries, Ltd for the technical support. The synchrotron radiation experi-ments were performed at the SPring-8 with the approval of the Japan Synchrotron Radiation Research Institute (JASRI) (Proposal No. 2004B0363-NI-np).
REFERENCES
1) S. Kou and Y. Le: Metal. Trans. A13(1982) 1141–1152.
2) H. Inoue, T. Koseki, S. Ohkita and T. Tanaka: ISIJ International35
(1995) 1248–1257.
3) H. Inoue, T. Koseki, S. Ohkita and M. Fuji: Science and Technology of welding & Joining5(2000) 385–396.
4) J. W. Elmer, J. Wong and T. Ressler: Metall. Mater. Trans. A23A
(2001) 1175–1187.
5) J. Wong, M. Froba, J. W. Elmer, P. A. Waide and E. M. Larson: J. Mat. Sci.32(1997) 1493–1500.
6) J. W. Elmer, T. A. Palmer, S. S. Babu, W. Zhang and T. Debroy: Weld. J.83(2004) 244–255.
7) S. S. Babu, J. W. Elmer, J. M. Vitek and S. A. David: Acta Materia.50
(2002) 4763–4781.
8) S. S. Babu, J. W. Elmer and S. A. David: Quintana MA, Proceedings of Mathematical, Physical and Engineering Sciences458(2002) 811. 9) S. A. David, S. S. Babu and J. M. Vitek: Miner. Meta. & Mater. Soc.55
(2003) 14.
10) B. Li, H. D. Brody and A. Kazimirov: Phys. Rev. E70(2004) 062602. 11) R. H. Mathiesen, L. Arnberg, F. Mo, T. Weitkamp and A. Snigirev:
Phys. Rev. Lett.83(1999) 5062–5065.
12) R. H. Mathiesen and L. Amberg: Acta Mater.53(2005) 947–956. 13) T. Osuki, M. Yonemura, K. Ogawa, Y. Komizo and H. Terasaki:
Science and Technology of welding & Joining11(2006) 33–42. 14) Y. Komizo, H. Terasaki, M. Yonemura and T. Osuki: Quarterly J.
Japan Welding Soc.24(2006) 57–64 [in Japanease].
15) Y. Komizo, H. Terasaki, M. Yonemura and T. Osuki: Trans. JWRI34
(2005) 51–55.
16) H. Terasaki, Y. Komizo, M. Yonemura and T. Osuki: Meta. Trans. A
37(2006) 1261–1266.
17) M. Yonemura, T. Osuki, H. Terasaki, Y. Komizo, M. Sato and A. Kitano: Mater. Trans.47(2006) 310–316.
18) M. Yonemura: Spring-8 TRIALUSE report 2004, (JASRI, Hyogo, Japan, 2005) [in Japanease].
19) M. Yonemura, Y. Komizo and H. Toyokawa:Research Frontier 2005, (JASRI, Hyogo, Japan, 2006) to be published.
20) M. Yonemura, T. Osuki, S. Inoue, K. Miyabe, Y. Komizo, H. Terasaki, M. Sato and A. Kitano: SPring-8 User Experiment Report 2004A, (JASRI, Hyogo, Japan, 2004) p. 244.
21) M. Yonemura, T. Osuki, S. Inoue, K. Miyabe, Y. Komizo, H. Terasaki, M. Sato and A. Kitano: SPring-8 User Experiment Report 2004B, (JASRI, Hyogo, Japan, 2005) p. 233.
Horisberger, B. Schmitt, C. Schulze-Briese and T. Tomizaki: Nucl. Instr. and Meth.A501(2003) 260–266.
23) B. Schmitt, Ch. Bro¨nnimann, E. F. Eikenberry, G. Hu¨lsen, H. Toyokawa, R. Horisberger, F. Gozzo, B. Patterson, C. Schulze-Briese and T. Tomizaki: Nucl. Instr. and Meth.A518(2004) 436–439. 24) Ch. Bro¨nnimann, Ch. Bu¨hler, E. F. Eikenberry, R. Horisberger, G.
Hu¨lsen, B. Schmitt, C. Schulze-Briese, M. Suzuki, T. Tomizaki, H. Toyokawa and A. Wagner: Synchrotron Radiation News17(2004) 23– 30.
25) Homepage of SPring-8,http://www.spring8.or.jp/e/.
26) R. A. Young:The Rietveld Method, (Oxford University Press, Oxford, 1995).
27) F. Izumi and T. Ikeda: Mater. Sci. Forum321–324(2000) 198–203. 28) J. Wong, T. Ressler and J. W. Elmer: J. Synchr. Rad.10(2003) 154–
167.
29) Y. Omori: ISIJ International41(2001) 554–565.
30) Y. Omori, A. T. Davenport and H. I. Aronson: Metall. Trans. A6A
(1975) 303.
31) G. Kurdjumov and G. Sachs: Z. Phys.74(1930) 325.
32) M. Aset, B. Gehrmann, E. F. Wassermann, H. Bach and W. Pepperhoff: J. Magn. Magn. Mat.232(2001) 221–230.