The Effect of Solute Elements on Hardness and Grain Size
in Platinum Based Binary Alloys
Taichi Murakami
*1, Ryoji Sahara
*2, Daisuke Harako
*3, Masahiro Akiba
*4,
Takayuki Narushima and Chiaki Ouchi
Department of Materials Processing, Tohoku University, Sendai 980-8579, Japan
The effects of 25 kinds of solute elements on hardness and grain size in annealed Pt-based binary alloys were investigated together with cold workability and a hardness variation with a cold rolling reduction. Gain size largely varied depending on solute elements and their concentrations, and so the decrement in grain size per 1 at% solute addition was evaluated based on grain size difference between pure platinum and a respective alloy. This value markedly reduced in the low solute concentration range below 5 at%, followed by a sluggish reduction in the higher solute concentration range. Hardness values obtained in all alloys were corrected considering contribution of hardening due to grain refinement, and solid solution hardening was evaluated by the increment in hardness per 1 at% solute addition. The lattice constants of pure platinum and alloys were measured to calculate the size misfits. The increment in hardness increased with the increase in the size misfit in all alloys, and this relationship was clearly divided into two groups depending on whether the binary alloy system is a completely miscible type or a type with the solubility limit. The increment in hardness in the latter type of alloys was much higher than that of the former, and this value became larger with the increase in the inverse value of the solubility limit in Pt-based binary alloy. The superior cold workability and very similar work hardening behavior were observed in all Pt-based binary alloys. [doi:10.2320/matertrans.MRA2007265]
(Received October 31, 2007; Accepted December 5, 2007; Published January 23, 2008)
Keywords: platinum based binary alloy, solid solution hardening, grain size, misfit parameter, cold workability, work hardening
1. Introduction
Pure platinum and its alloys are currently used in a wide variety of application fields because of their several superior properties over other metals and alloys. Pure platinum is a very soft and ductile metal with Vickers hardness of around
50 in HV, and possesses excellent cold workability.1,2)
Platinum and its alloy are also used as a catalyst for purification of exhaust gas and crude oil. This metal has superior corrosion resistant property in various corrosive environments at both ambient and high temperatures, result-ing in a wide use as a refractory material such as a crucible or a mold, and as a component material used in various
laboratory equipments.2,3)
One of the largest markets of platinum is jewelry and ornaments. Platinum jewels such as rings, bracelets and necklaces are manufactured by both routs of precision casting
and wrought processes.2,4)In general, jewelry products made
by noble metals and alloys are manufactured through various
processes such as forming, machining, cutting or polishing.4)
In particular, extremely fine cutting and polishing are the most important to achieve attractive surface appearance in these applications. Similarly to other noble pure metals, pure platinum is too soft to accomplish very fine surface appearance by polishing, and it also tends to suffer a surface damage such as scratch or dent during use, deteriorating excellent surface appearance. Thus, hardening or strengthen-ing by addition of alloystrengthen-ing elements into noble metals is
primarily conducted to solve this problem, and in fact, the most practical noble alloys for jewelry application contain various alloying elements in the total contents ranging from 5 to 25 mass%.
The selection and the amount of addition of alloying elements in noble metals for jewelry application have been conducted by considering several factors besides hardening such as modification of surface color appearance, cost of alloying additives, biocompatibility, manufacturing condi-tions or easiness in recycle of the base metal. New noble alloy development for jewelry application has been conducted mostly by an experience-based method, which is particularly true in platinum-based alloys. Platinum has a relatively short history of industrial use since a large-scale exploitation of platinum started in 1920’s, and this metal is the most expensive among noble metals. As a result, very few systematic studies have been performed regarding on the effect of alloying elements on various properties in
platinum-base alloys in the past. Currently, Biggs et al. reported
hardening of platinum alloys for jewelry application,4)and
Pt-based intermetallic alloys have been studied with aiming the development of the more superior high temperature
material over Ni-based super-alloys.5–8)
Under these circumstances in platinum alloys, the present study was conducted to investigate systematically the effect of various solute elements on hardness and grain size in platinum-base binary alloys. Grain refinement by addition of solute elements is important in both of cast and wrought products, because the microstructure with coarse grains deteriorates not only mechanical property, but also surface appearance of cold worked products with a fine surface finish. Total numbers of 25 kinds of solute elements belonging to the group number from 3 to 14 and the periodic number from 3rd to 6th in the periodic table were investigated, and a respective solute element was added in the concentration range of solid solution in platinum-base binary alloy with FCC structure.
*1Present address: Institute of Multidisciplinary Research for Advanced Materials, Tohoku University, Sendai 980-8577, Japan
*2Present address: Institute for Materials Research, Tohoku University, Sendai 980-8577, Japan
*3Undergraduate Student, Tohoku University, Present address: JFE steel, Steel Research Center, Chiba 260-0835, Japan
*4Undergraduate Student, Tohoku University, Present address: TOPCON CORPORATION, Tokyo 174-8580, Japan
Grain size and hardness measurements in annealed alloys were primarily conducted, and work hardening behavior in pure platinum and Pt-based binary alloys was also conducted by investigation of hardness variations with a rolling reduction in cold rolling. The solute concentrations among various binary alloys prepared in this study were largely different, and thus evaluations of grain refinement and solid solution hardening due to a respective solute element were conducted based on calculations of the decrement in grain size and the increment in hardness per 1 at% solute addition, respectively. The increment in hardness in various Pt-based binary alloys was analyzed and discussed based on the misfit parameter which was calculated from the lattice constants measured by X-ray diffraction (XRD).
2. Experimental Procedure
Platinum based binary solid solution alloys were prepared using argon arc melting furnace with a water-cooled cupper mold and a non-consumable electrode. Total numbers of 25 kinds of elements were selected as additives of Pt-based solid solution alloys, excluding toxic or radio-active elements and high vapor pressure elements. As shown in Table 1, solute elements and their concentrations in Pt-based alloys are listed on the periodic table. The concentration in a respective solid solution alloy prepared in this study was mostly one level, and it was near to the solubility limit of Pt-based binary alloy except alloys containing V, Ni, Zr and Ir. Solute concen-trations in these alloys were varied in two or three levels to examine grain size and hardness variations with concentra-tions. The concentration in Pt-X alloy noted hereafter is mass% except the case noted otherwise.
Melting raw materials used were pure platinum sheet with 1 mm in thickness and purity of 99.9%. Additives had various shapes such as powder, flake, sheet or grain, and their purity was 99.9% except vanadium, iron and zirconium of which purity was 99%. Special cautions were taken in both preparations of melting raw materials and melting proce-dures. The mass of pure platinum or additives was precisely measured, and additives were enclosed by platinum foil. The melting was repeated for 4 times, and contamination during melting was minimized. The mass loss during melting was very tiny, being less than 1% in all ingots. Chemical compositions of ingots were not analyzed, but nominal compositions calculated based on both masses of platinum
and an additive element used in preparation of a respective ingot were used for data presentations and analysis. The mass of a button ingot was around 9 g, and the ingot size was 10 mm in diameter and 6 mm in thickness.
Button ingots were homogenized at 1573 K for 18 ks under argon gas atmosphere, and subsequently isothermal hot-compression was conducted under vacuum using a hot working simulator of THERMECMASTER-Z. Ingots were deformed from 6 mm to 3 mm in the thickness direction at the
temperature of 1573 K and strain rate of2103s1.
Hot-deformed alloys were subsequently hot-rolled to 1.5 mm thickness after reheating at 1373 K. Finally, alloys were annealed at 1373 K for 3.6 ks under argon gas atmosphere. Annealed specimens with the initial thickness of 1.5 mm were cold-rolled with various rolling reductions of approx-imately 20, 50 and 70%. Hardness of both of annealed and cold rolled specimens was measured using a Vickers hard-ness tester (Akashi corp. MVK-H1) with a load of 1 kgf.
Microstructural observations and hardness measurements were preformed in the center part of the cross section in the specimens which were halved by cutting in the thickness direction. The microstructure of the annealed specimen was revealed by etching in use of a nitro-hydrochloric acid solution at 323 K and was observed by an optical microscopy. Grain size was measured by an intercept method. The lattice constant value was measured by X-ray diffraction (RIGAKU Corp., RINT-2200). Diffraction peaks were determined using
CuK1 and CuK2 radiations, and seven diffraction peaks
were measured and used for analysis. Tiny errors are
involved in measurements of diffraction peaks or 2, and
thus, the true lattice constant of a0 was obtained by
calibrating measured lattice constant values using eq. (1),9)
a¼a0þa0K cos2 ð1Þ
whereaand2are the measured lattice constant and Bragg
angle obtained from a respective diffraction peak,
respec-tively. The value ofa0 was obtained by extrapolatingcos2
to zero in plots ofavscos2. Accuracy of the lattice constant
value was within0:0001nm.
3. Results
3.1 The effect of solute elements on grain size of
Pt-based binary alloys
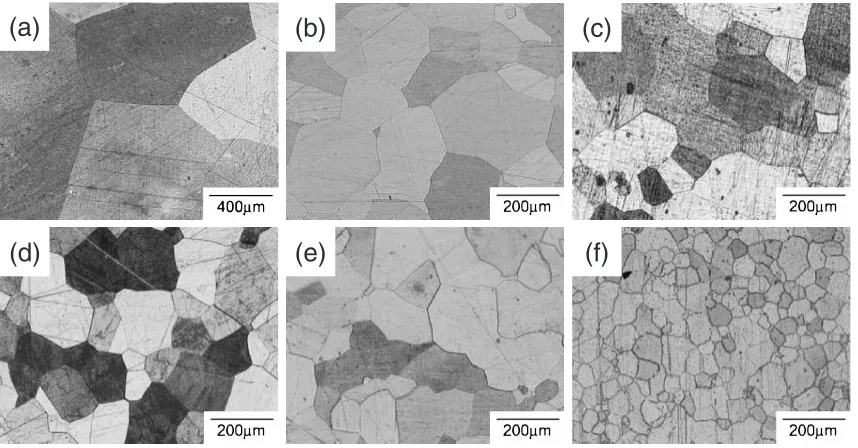
[image:2.595.47.550.92.228.2]The microstructures evolved in annealed pure platinum
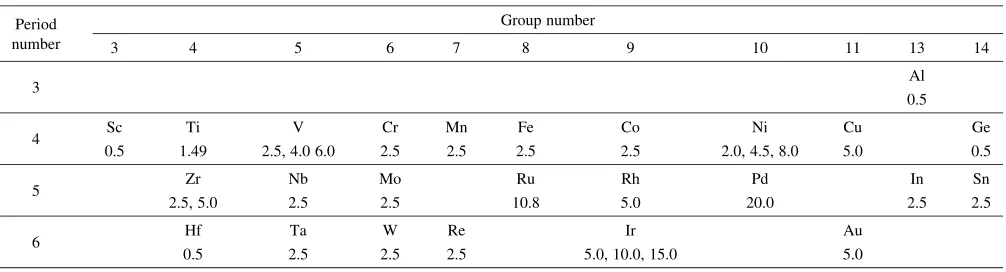
Table 1 Solute elements and their concentrations in Pt-based binary alloys used in this study, which are listed on the periodic table. The upper row: the solute element, the bottom row: the concentration in mass%
Period Group number
number 3 4 5 6 7 8 9 10 11 13 14
3 Al
0.5
4 Sc Ti V Cr Mn Fe Co Ni Cu Ge
0.5 1.49 2.5, 4.0 6.0 2.5 2.5 2.5 2.5 2.0, 4.5, 8.0 5.0 0.5
5 Zr Nb Mo Ru Rh Pd In Sn
2.5, 5.0 2.5 2.5 10.8 5.0 20.0 2.5 2.5
6 Hf Ta W Re Ir Au
and Pt-based binary alloys exhibited all equiaxed structure. Values of grain size obtained in annealed pure platinum and all binary alloys are summarized in Table 1. In Fig. 1, values of grain size obtained in pure platinum and all binary alloys are plotted against the solute concentration in atomic % in a respective alloy, where the vertical axis of grain size is expressed by a log-scale. Grain size varies in a very wide
range from 610mmin pure platinum to 33mmin Pt-2.5% Mo
or Pt-10.8% Ru alloy. Figure 1(a) shows variations of grain size with concentrations of V, Ni, Zr and Ir. The marked grain refinement in the low solute concentration range is found in all of these alloys. In the higher solute concentration range, grain refinement tends to sluggish in Ni- and V-added alloys, and grain size in Ir- and Zr-added alloys increases with the increase of the solute concentration after yielding the minimum value of grain size. Figure 1(b) shows grain size in a respective solute concentration in other binary alloys. Grain size in alloys with the higher solute concentration tends to become finer compared with that in alloys with the lower solute concentration, but grain size at a given solute
concentration shows a wide variation depending on solute elements.
Several examples of the microstructures evolved in pure platinum and various Pt-based binary alloys are shown in
Fig. 2. Grain size changes from 610mmin pure platinum to
51mmin Pt-2.5%Zr alloy. The solute concentration is largely
different among various binary alloys, and so the decrement in grain size per 1 at% solute addition was calculated in all
binary alloys based on the equation of (DPtDPt-X)/(atomic
solute concentration in Pt-X alloy), whereDPtandDPt-Xare
grain size of pure platinum and Pt-X alloy, respectively. Grain size and calculated values of the decrement in grain size in all alloys are listed in Table 2.
Decrements in grain size per 1 at% solute addition in all binary alloys are graphed in Figs. 3(a) to (d), where the solute element in a respective alloy is put side by side based on periodic numbers of 3rd, 4th, 5th and 6th, respectively. Solute elements in each periodic number are put in order of the group number from the left to right sides, and difference in crystal structures of a respective element is also expressed by different marks. The decrement in grain size in V-, Ni-, Zr-or Ir-added alloy shown in this graph is the value obtained in the least solute concentration in a respective alloy. Solute elements belonging to the 6th period number evidently give rise to the largest decrement in grain size, and the smallest decrement is observed in solute elements belonging to 4th period. It is also found that solute elements belonging to the lower group number in a respective periodic number yield the larger decrement in grain size compared with solute elements with the higher group number. Elements belonging to lower group numbers such as Hf, Ta, W, Re, Zr, Nb or Ti have mostly BCC or HCP structure, and these solute elements result in the larger decrement in grain size compared with elements with FCC structure such as Ni, Cu or Au. The largest decrement in grain size is obtained by Hf addition of
0.5 at%, which was 838mmper 1 at% addition and the second
ranked elements in a strong grain refiner are W, Re and Ta, of Solute concentration (at%)
5 10 15 20 25
0
Grain size,
d
/
µ
m
Solute concentration (at%) 0
1000
500
200
100
50
20
10
5 10 15 20 25 30
V Ni Zr Ir
(a) (b)
Ru Cu
Mo Rh
Cr Mn
Fe Co
Nb Ti Au In Sn
Al
W Ta Re
Sc Ge
Hf
Fig. 1 Variations of grain size with the solute concentration in Pt-based alloys in (a), and grain size in a solute concentration in a respective Pt-based alloy in (b).
(b)
(a)
(c)
(d)
(e)
(f)
[image:3.595.51.290.74.202.2] [image:3.595.85.514.535.759.2]which the decrements in grain size per 1 at% addition are
[image:4.595.52.550.84.427.2]213, 212 and 207mmper 1 at% solute addition, respectively.
Figure 3 shows a very large variation in the decrement in grain size depending on solute elements. However, the large difference in solute concentration among various binary alloys possibly affects the decrement in grain size per 1 at% solute addition. Therefore, the relationship between decre-ments in grain size per 1 at% solute concentration and the solute concentration in a respective alloy is graphed as shown in Fig. 4, where the vertical axis is a log-scale. Data of all binary alloys including alloys with two or three levels of the solute concentration are included in this figure. Variations in the decrement in grain size with the solute concentration in all binary alloys are approximated by two straight bands with
a bending point in a solute concentration of around 5 at%. The decrement in grain size by addition of various solutes is affected by both the solute concentration and solute elements, and the latter effect is shown by the width of straight bands. The result shown in Fig. 4 indicates that the former effect on the degree of grain refinement is much larger than the latter effect. The decrement in grain size is very large in the low solute concentration range up to approximately 5 at%, and
Table 2 Grain size and hardness obtained in Pt-based binary alloys.
No Element Periodic table Concentration Grain size (D) Hardness (HV)
Period Group (mass%) (atomic %) (mm) (D)/at% Measured Calibrated (HV)/at%
1 Al 3 13 0.5 3.5 100 145 72 60 2.8
2 Sc 4 3 0.5 2.1 209 188 126 120 32.9
3 Ti 4 4 1.49 5.8 94 89 162 149 17.1
4 V 4 5 2.5, 4.0, 6.0 8.9, 13.8, 19.6 111, 71, 52 56, 39, 28 164, 186, 219 153, 170, 199 11.5, 8.7, 7.6
5 Cr 4 6 2.5 8.8 112 57 124 113 7.2
6 Mn 4 7 2.5 8.3 193 50 121 115 7.7
7 Fe 4 8 2.5 8.2 167 54 121 113 7.7
8 Co 4 9 2.5 7.8 178 55 105 98 6.1
9 Ni 4 10 2.0, 4.5, 8.0 6.4, 13.5, 22.4 205, 192, 168 64, 31, 20 109, 151, 216 103, 145, 209 8.3, 7.0, 7.1
10 Cu 4 11 5 13.9 281 24 131 127 5.5
11 Ge 4 14 0.5 1.3 387 167 125 123 54.7
12 Zr 5 4 2.5, 5.0 5.2, 10.1 51, 85 108, 52 212, 405 192, 370 27.3, 31.7
13 Nb 5 5 2.5 5.1 60 108 136 118 13.3
14 Mo 5 6 2.5 5.0 33 116 135 108 11.7
15 Ru 5 8 10.8 18.9 33 31 198 171 6.4
16 Rh 5 9 5 9.1 205 45 78 72 2.4
17 Pd 5 10 20 32.2 284 10 79 75 0.8
18 In 5 13 2.5 4.2 294 76 146 142 22.1
19 Sn 5 14 2.5 4.0 294 78 147 143 23.1
20 Hf 6 4 0.5 0.5 152 838 79 71 37.9
21 Ta 6 5 2.5 2.7 53 207 124 104 20.2
22 W 6 6 2.5 2.6 46 213 109 87 14.0
23 Re 6 7 2.5 2.6 56 212 106 87 14.1
24 Ir 6 9 5.0, 10.0, 15.0 5.1, 10.1, 15.2 160, 87 89, 52 81, 125, 165 73, 111, 157 4.6, 6.1, 7.0
25 Pt 6 10 base 610 50 50 —
26 Au 6 11 5 5.0 164 90 117 109 12
Solute element
Ti V Cr Mn Fe Co Ni Cu Zr Nb Mo Ru Rh Pd Hf Ta W Re Ir Au
Decrement in grain size per 1at%
addition,
∆
d
/
µ
m
.at.%
–1
(a) (b) (c) (d)
0 50 100 150 200
500 : FCC : BCC : HCP 1000
Al
Fig. 3 Decrement in grain size per 1 at% solute addition in various solute elements shown on the periodic table.
Solute concentration (at%)
0 5 10 15 20 25 30 35
1000
Decrement in grain size per 1 at% solute addition,
∆
d
/
µ
m
.at% –1 500
100
50 200
20
10
V Ni Zr Ir others
[image:4.595.325.523.452.639.2] [image:4.595.48.291.457.568.2]the further increase of solute concentration up to 33 at% yields a much smaller slope in a straight band in the relationship between the decrement in grain size and the solute concentration.
3.2 The effect of solute elements on hardness of Pt-based
binary alloys
Hardness values obtained in all annealed binary alloys are listed in Table 2, which are largely varied in the range from
50 in HVin pure platinum up to 405 in HVin Pt-5%Zr alloy.
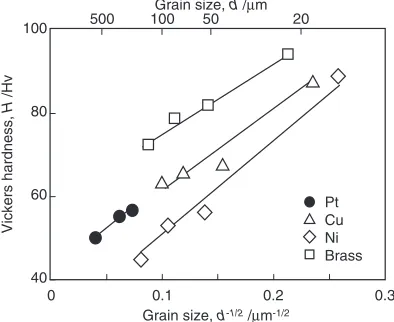
Strength or hardness in solid solution alloys with a single phase is primarily controlled by both grain size and solid solution hardening. Because a wide variation in grain size was observed in the present Pt-based binary alloys, the value of hardness obtained in a respective alloy is needed to calibrate the amount of hardening raised by the difference of grain size for comparison of solid solution hardening among various solute elements. Therefore, grain size dependence of hardness in pure platinum was investigated. Grain size
of pure platinum was varied from 182mm to 610mm by
changing annealing temperatures from 973 to 1373 K, and hardness of these specimens was measured. Grain size dependence of hardness in pure platinum is shown in Fig. 5 together with that of other FCC metals and alloy reported by
Wang.10) This relation is expressed by eq. (2) similarly to
Hall-Petch relationship for yield strength,
HvPt¼Hv0þKD
1
2
Pt ð2Þ
where Hv0 is the constant value, and HvPt and DPt are
hardness and grain size of pure platinum, respectively. It is
found from this figure thatKvalue of pure platinum is almost
the same as that of other FCC metals and alloy, and thatHv0
andKvalues are 42 in Hv and 204 Hvmm1=2, respectively.
Grain size dependence of hardness in all binary alloys was assumed to be the same as that of pure platinum, and hardness
values in all alloys were calibrated using thisK value under
the condition that grain size in all alloys is the same as that of pure platinum. Calibrated hardness values in all binary alloys are also listed in Table 2. In the following, calibrated hardness values in alloys are used for data presentation and analysis.
Figure 6(a) shows variations of hardness in V-, Ni-, Zr-and Ir-added binary alloys with the solute concentration in at%. The best data fitting was obtained by the linear plot of the solute concentration in the horizontal axis except V, although data plots based on the 1/2 or 2/3 power of the concentration were examined. Hardness in a respective alloy changes linearly with the solute concentration, and addition of Zr results in much larger hardening over other three solute elements. Figure 6(b) shows the effect of other solute elements on hardness in a respective amount of addition in binary alloys. It is found that and calibrated hardness values are dispersed in the range from 50 to 171 without depending on the solute concentration in a respective binary alloy.
Similarly to grain size variations due to addition of various solutes, the increment in hardness per 1 at% solute addition
was calculated based on the equation of (HvPt-XHvPt)/
(atomic solute concentration in Pt-X alloy), whereHvPt-Xand
HvPt are hardness values of Pt-X alloy and pure platinum,
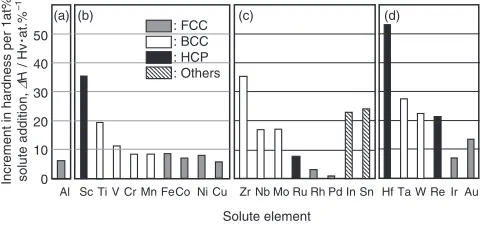
respectively. Calculated values of the increment in hardness per 1 at% solute addition are listed in Table 2. Figures 7(a) to (d) show increments in hardness per 1 at% solute addition in all binary alloys, where the solute element in a respective alloy is put side by side based on the periodic table similarly to Fig. 3. All solute elements give rise to hardening, although such elements as Pd and Rh yield a very tiny hardening. Top three-ranked solute elements in the largest increment in hardness per 1 at% solute addition are Hf, Zr and Sc, which belong to the lowest group number in periodic numbers of 5th, 4th and 3rd, respectively. The increment in hardness per 1 at% solute addition tends to become larger with a reduction of group number in a respective periodic number, but the periodic number appears to have no relationship with the increment of hardness. Solute elements with FCC structure yield the least hardening among solutes with various crystal structures. The datum of Ge is excluded in this figure, but this element belonging to the group number of 14th result in the largest increment in hardness among all alloys as seen in Table 2. This result indicates that the ranking of the increment in hardness among various solutes in binary alloys can not be fully explained based on the periodic group number. This result of Ge is used in the analysis conducted in the following chapter.
Similarly to Fig. 4 showing dependence of the decrement in grain size on the solute concentration, the relationship Pt
Cu Ni Brass
Vickers hardness,
H
/Hv
Grain size, d-1/2/µm-1/2
100
80
60
40
0 0.1 0.2 0.3
500 100 50 20
Grain size, d /µm
Fig. 5 Hardness variations with grain size plotted by Hall-Petch relation-ship in pure platinum and other FCC metals and alloy.10)
Solute concentration (at%) 5 10 15 20 25 0
Solute concentration (at%)
0 5 10 15 20
V Ni Zr Ir
(a) (b)
Ru
Cu Mo
Rh Cr
Mn Fe
Co Nb Ti
Au In Sn
Al W Ta
Re Sc Ge
Hf
Vickers hardness,
H
/Hv
400
300
200
100
0
Pd
30 35
[image:5.595.70.267.76.237.2] [image:5.595.306.547.77.202.2]between the increment in hardness per 1 at% solute addition and the solute concentration in a respective alloy was examined. However, data scatter in this relationship was very large and any distinct relationship was not observed. Solid solution hardening or the increment in hardness is analyzed based on the size misfit in the following chapter.
3.3 Hardness variations with a cold rolling reduction
Hardness variations with a cold rolling reduction in pure platinum and binary alloys were investigated by changing the rolling reduction up to 70%. All alloys showed an excellent cold workability without suffering any cracking even in the high rolling reduction. Figures 8(a) and (b) show results of pure platinum and binary alloys with elements belonging to group numbers of 4th and 5th, and 10th and 11th in periodic table, respectively. A relatively high work hardening rate is observed in a rolling reduction up to 20 or 25% in pure platinum and all binary alloys, and the work hardening rate tends to become low with a further extension of a rolling
reduction. Hardness of pure platinum which is 50 in HVin as
annealed condition becomes over 100 in HV in a rolling
reduction of approximately 60%. No marked difference in work hardening rate appears to be observed among elements classified by a respective group number. All binary alloys exhibit very similar work hardening behavior to that of pure platinum, although a quantitative analysis of work hardening rate in a respective binary alloy was not conducted. The work hardening due to cold rolling in pure platinum and binary
alloys was evaluated based on the difference in both hardness values obtained after cold rolling with a rolling reduction of 60% and after annealing. Figure 9 shows the relationship between hardness in as annealed condition and the increment in hardness after cold rolling with 60% rolling reductions. The increment in hardness in the most alloys increases linearly with the increase of hardness obtained by annealing except several alloys, of which the relationship is expressed by eq. (3).
HV¼36:5þ0:47Hvanneal ð3Þ
where Hv is the difference of hardness values after cold
rolling with a rolling reduction of 60% and annealing, and Hvannel is hardness in as annealed condition. Cold working under a strict control of the rolling reduction is one of methods for strengthening or hardening metals and alloys, and therefore it is expected that such data as shown in Figs. 8 and 9 can be utilized for strengthening or hardening of pure platinum and platinum-based binary alloys.
4. Discussion
4.1 The effect of solute elements on grain size in
Pt-based binary alloys
In this study, the solute concentration in a respective binary alloy was largely different, and so the effect of various solute elements on grain size was evaluated based on the decrement in grain size per 1 at% solute addition. This value showed a strong dependence of the solute concentration in a respective alloy, while the effect of the solute element on this value was relatively small. The least solute addition resulted in the largest decrement in grain size, and the increase in the solute concentration up to around 5 at% decreased this value at the high rate, followed by a sluggish reduction of this value with the further increase in the solute concentration over 5 at%. The effect of the substitutional solute element on grain growth has been explained based on solute drag mechanism, where grain boundary mobility is controlled by the solute element segregated on grain boundary or dispersed nearby
grain boundary.11)As solubility of the solute element in the
grain boundary is very limited, grain boundary mobility reduces more markedly in the leaner solute concentration. This induces the larger decrement in grain size in the leaner
solute concentration. Togashiet al.reported the effect of the
Zr Nb Mo Ru Rh Pd In Sn Hf Ta W Re Ir Au Al Sc Ti V Cr Mn FeCo Ni Cu
Increment in hardness per 1at% solute addition,
∆
H
/ Hv
.at.%
–1
0 10 20 30 40
50 : FCC: BCC : HCP : Others
Solute element
(a) (b) (c) (d)
Fig. 7 Increment in hardness per 1 at% solute addition in various solute elements shown on the periodic table. Solute elements shown from (a) to (d) belong to the 3rd, 4th, 5th and 6th periodic numbers, respectively.
Pure Pt Pt–20Pd Pt–5Au Pt–5Cu Pt–4.5Ni
Rolling reduction (%)
20 40 60 80
0 Rolling reduction (%)
0 20 40 60
Vickers hardness,
H
/Hv
500
400
300
200
100
0
(a) Pure Pt Pt–0.5Hf (b)
Pt–2.5Ta Pt–2.5Nb Pt–1.49Ti Pt–2.5V Pt–2.5Zr
Fig. 8 Variations of hardness with a cold rolling reduction in pure platinum and Pt-based binary alloys. Solute elements shown in (a) and (b) belong to group numbers of 4th and 5th, and 10th and 11th, respectively in the periodic table.
Increment in hardness,
∆
Hv
(Hv60%–Hv
anneal
)
/Hv
Hardness, Hvanneal/Hv
150
100
50
50 100 150 200
Au Re
Ge
In Sn Mn
V
[image:6.595.49.292.75.188.2] [image:6.595.324.526.79.201.2] [image:6.595.50.290.253.378.2]content of various substitutional alloying elements on the
mobility of the = interface in C-Mn steel, where the
interface mobility reduced at very high rate in the range of very low alloy contents, followed by a sluggish reduction
with the further increase of contents.12)This behavior in the
relationship between the interface mobility and the content of alloying elements is very similar to the present result of a variation of the decrement in grain size with the solute concentration obtained in Pt-based binary alloys.
As shown in Fig. 3, the effect of various solute elements on the decrement in grain size per 1 at% solute addition appeared to be associated with the periodic and group numbers on the periodic table to which the solute element belonged as well as crystal structure of the solute elements. However as already noted, the analysis based on dependence of the decrement in grain size per 1 at% solute addition on the solute concentration yielded a relatively small effect of solute elements. The d-electron character of the solute element can be read from the periodic table, which affects various physical and chemical natures of the solute element. This may yield somewhat the indirect relationship between the grain refinement and the periodic and group numbers of the solute element. However, the more detail investigations are needed to reconfirm these findings and to pursuit the cause for these correlations.
4.2 Solid solution hardening due to various solute
elements in Pt-based binary alloys
All solute elements investigated in this study showed solid solution hardening, and any solute element causing alloy softening was not found in Pt-based binary alloys. This is in contrast to the result of austenitic stainless steel with the same FCC structure, because strength of this alloy was decreased by addition of alloying elements such as Mn, Ni or Cu, while
Si and Mo additions increased strength.13) Solid solution
hardening due to the substitutional element is caused by the elastic interaction between an edge dislocation and solute atoms. This elastic interaction has the size and the modulus effects, which are caused by the difference of the atomic radius and the elastic modulus, respectively. As the influence of the former is far-reaching, solid solution hardening is
mostly analyzed based on the size effect.14)The size misfit
parameter of a solute element,"awhich is the ratio of a lattice
constant variation per 1 at% solute addition, can be expressed by eq. (4).
"a¼
1
aPt
da
dc
100 ð4Þ
whereaandaPtare the lattice constants of Pt-X solid solution
alloy and pure platinum, respectively, and jda=dcj is an
absolute value of the slope in the straight relationship
between lattice constant ofaand the solute concentration of
c. The other way to evaluate the size misfit is based on the difference of the atomic radius between the base metal and the solute element, which is expressed by eq. (5).
"r ¼
ðrxrPtÞ rPt
100 ð5Þ
whererPtandrxare atomic radius of platinum and the solute
element of X, respectively. The lattice constants in Pt-based
binary alloys were measured by XRD analysis, and these values are summarized in Table 3 together with calculated
values of"a. Values of atomic radius in a respective element
and calculated values of"rare also listed in this table together
with the type of the phase diagram and the maximum solubility limit in binary alloy system. The lattice constant of
pure platinum was 0:392500:00005nm, which agreed
well with the reported one.15) Figures 10(a) and (b) show
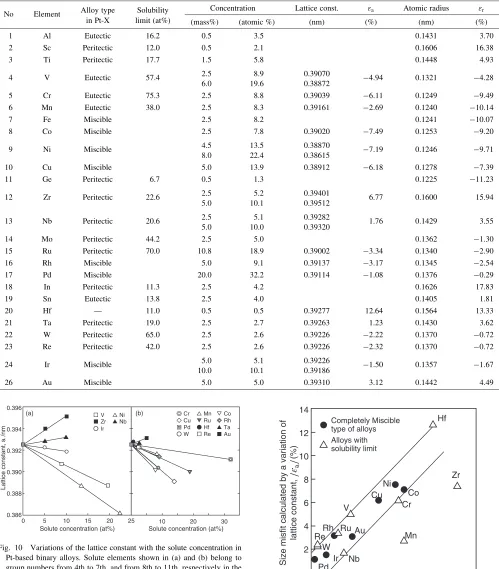
variations in the lattice constant with a solute concentration in binary alloys with two levels and a single level of the solute concentration, respectively. The former figure includes the result of Pt-5%Nb alloy which was additionally prepared only for evaluation of the lattice constant. It is found from Fig. 10(a) that the lattice constants linearly change with the increase of the concentration in all solute elements. Nb and Zr increase the lattice constant, and V, Ni and Ir decrease this value. Figure 10(b) shows the lattice constants in binary alloys with a single level of the solute concentration. All solute elements besides Hf, Ta and Au decrease the lattice constant, and Co among them results in the largest reduction of the lattice constant.
Calculated values of"aand"rare shown in Table 3, where
values of"aand"rare not shown by the absolute value but by
the positive or negative value corresponding to actual variations of the lattice constant and the atomic radius. It is found that all solute elements having a larger atomic radius
than that of platinum or a positive value of "r result in
positive values of "a, and solute elements having a smaller
atomic radius than that of platinum or negative values of"r
show negative values of"a. Figure 11 shows the correlation
between both absolute values of the size misfits of"aand"r.
An excellent correlation between both values is observed except solute elements of Mn and Zr. Therefore, the increment in hardness per 1 at% solute addition in Pt-based
binary alloys is analyzed using the size misfit of "a in the
following.
Solid solution hardening in many alloy systems had been studied during the past half century, of which results were mostly analyzed based on the size misfit. King reported quantitative size-factors defined in terms of the effective atomic volume of the solute for 469 substitutional solid solutions using lattice parameter data available in the literatures, and discussed the application of these size-factors
in relation to various properties of solid solution alloys.16)He
introduced the linear size-factor and calculated this value of many solid solution alloys. For various solute elements in Pt-based binary alloys, the correlation between the linear-size factors calculated by King and the size misfit obtained in the present study is shown in Fig. 12, where an excellent correlation between them is found.
Figure 13 shows the relationship between the increment in
hardness per 1 at% solute addition and the size misfit of"ain
Pt-based binary alloys, where the vertical scale is a log-scale. Lattice constants of Sc, Ti, Ge and Mo were not measured. So, increments in hardness in these solutes were plotted using
alloy systems, the logarithm of the increment in hardness increases linearly with the increase of the absolute value of the size misfit. Increments in hardness in Pt-Au and Pt-Ir alloys were much larger than values inferred from the relationship between the increment in hardness and the misfit for a completely miscible type of alloys. This may be caused by additional hardening due to the order phase which may be formed during cooling in annealing treatment. The increment
in hardness in alloys with the solubility limit which are shown by open marks in this figure also increases with the size misfit, although this correlation yields a wider band of
Table 3 Classification of alloy type, the maximum solubility limit, the measured lattice constant and"ain Pt-based alloys, and atomic radius and"rof the solute element.
No Element Alloy type Solubility Concentration Lattice const. "a Atomic radius "r
in Pt-X limit (at%) (mass%) (atomic %) (nm) (%) (nm) (%)
1 Al Eutectic 16.2 0.5 3.5 0.1431 3.70
2 Sc Peritectic 12.0 0.5 2.1 0.1606 16.38
3 Ti Peritectic 17.7 1.5 5.8 0.1448 4.93
4 V Eutectic 57.4 2.5 8.9 0.39070 4:94 0.1321 4:28
6.0 19.6 0.38872
5 Cr Eutectic 75.3 2.5 8.8 0.39039 6:11 0.1249 9:49
6 Mn Eutectic 38.0 2.5 8.3 0.39161 2:69 0.1240 10:14
7 Fe Miscible 2.5 8.2 0.1241 10:07
8 Co Miscible 2.5 7.8 0.39020 7:49 0.1253 9:20
9 Ni Miscible 4.5 13.5 0.38870 7:19 0.1246 9:71
8.0 22.4 0.38615
10 Cu Miscible 5.0 13.9 0.38912 6:18 0.1278 7:39
11 Ge Peritectic 6.7 0.5 1.3 0.1225 11:23
12 Zr Peritectic 22.6 2.5 5.2 0.39401 6.77 0.1600 15.94
5.0 10.1 0.39512
13 Nb Peritectic 20.6 2.5 5.1 0.39282 1.76 0.1429 3.55
5.0 10.0 0.39320
14 Mo Peritectic 44.2 2.5 5.0 0.1362 1:30
15 Ru Peritectic 70.0 10.8 18.9 0.39002 3:34 0.1340 2:90
16 Rh Miscible 5.0 9.1 0.39137 3:17 0.1345 2:54
17 Pd Miscible 20.0 32.2 0.39114 1:08 0.1376 0:29
18 In Peritectic 11.3 2.5 4.2 0.1626 17.83
19 Sn Eutectic 13.8 2.5 4.0 0.1405 1.81
20 Hf — 11.0 0.5 0.5 0.39277 12.64 0.1564 13.33
21 Ta Peritectic 19.0 2.5 2.7 0.39263 1.23 0.1430 3.62
22 W Peritectic 65.0 2.5 2.6 0.39226 2:22 0.1370 0:72
23 Re Peritectic 42.0 2.5 2.6 0.39226 2:32 0.1370 0:72
24 Ir Miscible 5.0 5.1 0.39226 1:50 0.1357 1:67
10.0 10.1 0.39186
26 Au Miscible 5.0 5.0 0.39310 3.12 0.1442 4.49
0.396
0.394
0.392
0.390
0.388
0.386
Lattice constant,
a
/nm
0 5 10 15 20
Solute concentration (at%)
Cr Mn Co
Cu Ru Rh
Pd Hf Ta
W Re Au
25
V Ni
Zr Nb
Ir
10 20 30
Solute concentration (at%)
[image:8.595.49.548.94.663.2](a) (b)
Fig. 10 Variations of the lattice constant with the solute concentration in Pt-based binary alloys. Solute elements shown in (a) and (b) belong to group numbers from 4th to 7th, and from 8th to 11th, respectively in the periodic table.
Size misfit calculated by a variation of
a
lattice constant,
(%)
ε||
Size misfit calculated by difference of
14
12
10
8
6
4
2
0
0 4 8 12 16
Ir Au Ru
Hf
Mn Re
Zr
W
V Cr
Nb
Co Cu
Rh
Ni
Pd
Completely Miscible type of alloys Alloys with solubility limit
atomic radius, |ε |r (%)
data scatter than that in a completely miscible type of alloys. The increment in hardness in this type of alloys is always larger than that of a completely miscible type of alloys. Consequently, it was found in Pt-based binary alloys that solid solution hardening in alloy systems with the solubility limit was much higher than that in a completely miscible type of alloys, while solid solution hardening in both types of alloys was primarily controlled by the size misfit.
Suzuki’s group studied solid solution hardening in Ni-X binary alloys and Ni-40 at%Co-X ternary alloys, reporting that solid solution hardening in alloys with the solubility limit became larger than that of alloys with a completely miscible
similarly to the present result.17–19) It was also reported that
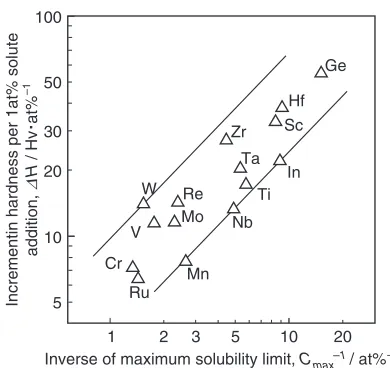
an extra hardening observed in the former type of alloys increased with a reduction of the solubility limit. Thus, in the present Pt-based binary alloys, the relationship between the increment in hardness and an inverse of the solubility limit in a respective alloy was investigated, of which result is in Fig. 14. An excellent correlation between them is found,
although a scatter band is rather broad. This result indicates that solid solution hardening in the binary alloy with the narrow solubility limit becomes larger compared with that of the alloy with the wider solubility limit. Solubility limits of Ge and Hf in Pt-based binary alloys are relatively narrow as 6.7 at% and 11.0 at%, respectively, and so these solutes give
rise to the largest solid solution hardening. Shinoda et al.
analyzed an extra hardening observed in Ni-based alloys with the solubility limit based on the heat of formation for solid solution, and found that this heat of formation became higher in alloys with the larger size misfit, while it was very low and independent of the size misfit in a completely miscible type
of alloys.18) They concluded that this was well correlated
with an atomic interaction parameter between solute and solvent atoms.
As shown in Fig. 7, the increment of hardness in a respective solute element appears to be related to the periodic group number or the crystal structure of the solute element.
Mishima et al. reported that an extra hardening of solid
solution hardening observed by addition of transition metals elements in nickel was caused by a possible contribution of
electronic interaction involving d-electrons.17) As already
noted, d-electron character is associated with various proper-ties including the cohesive bond strength between atoms, and so the periodic table or d-electron character appears to be related to the size misfit and the solubility limit which control hardening in solid solution alloys.
5. Conclusions
The effects of 25 kinds of solute elements on hardness and grain size in Pt-based binary alloys annealed at 1373 K were investigated together with hardness variations with cold rolling reductions. The following results were obtained.
(1) All binary alloys evolved the single phase micro-structure with an equiaxed grain, and gain size varies in
a wide range from 610mmin pure platinum to 33mmin
Pt-2.5%Mo and Pt-10.8% Ru alloys.
–10
Linear size factor,
lsf
(%)
Ni Cu Co
Cr Rh
Ru Ir Pd Re
Nb Au 10
8
6
4
2
0
–2
–4
–6
–8
–10
Size misfit by lattice constant, εa (%)
10 5
[image:9.595.326.521.70.254.2]0 –5
Fig. 12 Relationship between the linear size factor reported by King16)and the size misfit obtained in this study in Pt-based binary alloys.
Size misfit εa or εr, | ε | (%)
100
10
1
0.1
0 4 8 12 16
Ir
Pd
Co
Cu Au
Rh Ni
Nb
Ru
Hf
Mn Re
Zr W
V
Incrementin hardness per 1at% solute addition,
∆
H
/ Hv
.at%
–1
Completely miscible type of alloys Alloys with solubility limit
and the size misfit of εa
Alloys with solubility limit and the size misfit of εr
Sc Ge
[image:9.595.70.269.71.268.2]Ti Mo
Fig. 13 Relationship between the size misfit and the increment in hardness per 1 at% solute addition in Pt-based binary alloys.
1 2 3 5 10 20
Nb
Ru
Hf
Mn Re
Zr
W
V
Ge
Sc
In Ti Ta
Cr
Mo
5 100
50
30
20
10
Incrementin hardness per 1at% solute
addition,
∆
H
/ Hv
.at%
–1
Inverse of maximum solubility limit, C / at%–1
max–1
[image:9.595.69.270.328.505.2](2) The decrement of grain size per 1 at% solute addition was evaluated based on grain size difference between pure platinum and a respective alloy. A variation of this value with the solute concentration results on marked reduction in the low solute concentration range below 5 at%, followed by a sluggish reduction in the higher solute concentration range.
(3) Solid solution hardening was evaluated by the incre-ment in hardness per 1 at% solute addition, which was analyzed based on the size misfit calculated by the measured lattice constants of pure platinum and alloys. While solid solution hardening increases with the increase in the size misfit in all binary alloys, this behavior is clearly classified by the type of binary alloys whether they are completely miscible type or have the solubility limit.
(4) Solid solution hardening in the binary alloy with the solubility limit is much larger than that of the completely miscible type of the alloy, and the increment of hardness in the former type alloy becomes larger with the higher inverse value of the solubility limit. (5) Both values of the decrement of grain size and the
increment of hardness obtained in a respective alloy appears to be associated with the periodic number and the group number in the periodic table to which the solute element belongs as well as crystal structure of the solute element, but the more detail investigations are needed to reconfirm these findings and to pursuit the cause for these correlations.
(6) The superior cold workability is obtained under a cold rolling reduction up to around 70% in all alloys. Work hardening behavior evaluated by variations of hardness with cold rolling reductions is very similar among various binary alloys.
Acknowledgment
The authors are grateful to MURAO CO., LTD. for a financial support for this study as well as a plenty supply of pure platinum used in this work.
REFERENCES
1) N. Hongou and Y. Tada:Science of noble metals, a part of application (Tanaka Kikinzoku Kogyo K.K, Tokyo, 2001) pp. 2–3. (in Japanese) 2) T. Okabe: Kinzoku76(2006) 980–984.
3) M. Min, J. Cho, K. Cho and H. Kim: Electrochimi. Acta45(2000) 4211–4217.
4) T. Biggs, S. S. Taylor and E. van der Lingen: Platinum Metals Rev.49 (2005) 2–15.
5) P. J. Hill, T. Yamabe-Mitarai and I. M. Wolff: Scri. Mater.44(2001) 43–48.
6) P. J. Hill, T. Biggs, P. Ellis, J. Hohls, S. Taylor and I. M. Wolff: Mat. Sci. Eng.A301(2001) 167–179.
7) P. J. Hill, N. Adams, T. Biggs, P. Ellis, J. Hohls, S. Taylor and I. M. Wolff: Mat. Sci. Eng.A329–331(2002) 295–304.
8) Z. M. Rdzawski and J. P. Stobrawa: Mater. Processing Tech.153–154 (2004) 681–687.
9) B. D. Cullity: Elements of X-ray diffraction, translated by G. Matsumura, (Agune Co., Tokyo, 1991) pp. 325–346. (in Japanese) 10) S. L. Wang and L. E. Murr: Metallography13(1980) 203–224. 11) T. Nishizawa: Mater. Trans.42(2001) 2027–2032.
12) F. Togashi and T. Nishizawa: J. Jpn Inst. Metals40(1976) 12–21. 13) N. Ohkubo, K. Miyakusu, Y. Uematsu and H. Kimure: ISIJ Int.34
(1994) 764–772.
14) F. R. N. Nabarro: Pro. Phys. Soc. London,58(1946) 669–676. 15) E. A. Brandes and G. B. Brook:Smithells Metals Reference Book, 7th
ed, (Butterworth-Heinemann, London, 1992) pp. 6–9. 16) H. W. King: J. Mater. Sci.1(1966) 79–90.
17) Y. Mishima, S. Ochiai, N. Hamano, Y. Yodogawa and T. Suzuki: Trans. JIM27(1986) 656–664.
18) T. Shinoda, G. Choi, Y. Mishima and T. Suzuki: Tetsu-to-Hagane:76 (1990) 1720–1726.