ORIGINAL RESEARCH
HEAD & NECK
Head and Neck Tumors: Assessment of Perfusion-Related
Parameters and Diffusion Coefficients Based on the
Intravoxel Incoherent Motion Model
M. Sumi and T. Nakamura
ABSTRACT
BACKGROUND AND PURPOSE: IVIM MR imaging provides perfusion and diffusion information with a single diffusion-weighted MR image. We determined whether PP and D differ among various types of head and neck tumors.
MATERIALS AND METHODS: The study cohort included 123 head and neck tumors: 30 SCCs, 28 benign and 20 malignant SG tumors, 36 lymphomas, and 9 schwannomas. The D and PP values were determined by using b-values of 0, 500, and 1000 s/mm2based on the IVIM
model.
RESULTS: The PP values (lymphomas, 0.09⫾0.04; SCCs, 0.15⫾0.04; and malignant SG tumors, 0.22⫾0.07) and D values (0.47⫾0.07⫻ 10⫺3mm2/s, 0.82⫾0.17⫻10⫺3mm2/s, and 1.03⫾0.16⫻10⫺3mm2/s, respectively) were significantly different among the malignant
tumors (P⬍.01). These values were also significantly different between pleomorphic adenomas (0.13⫾0.02 and 1.44⫾0.39⫻10⫺3mm2/s)
and Warthin tumors (0.19⫾0.04 and 0.73⫾0.22⫻10⫺3mm2/s) (P⬍.001). The PP values of malignant SG tumors were significantly different
from those of pleomorphic adenomas (P⫽.001) and the D values of the malignant SG tumors were significantly different from those of pleomorphic adenomas (P⫽.002) and Warthin tumors (P⫽.007). Schwannomas had large PP (0.23⫾0.08) and D values (1.26⫾0.20⫻10⫺3
mm2/s), greatly overlapping those of some SG tumor types.
CONCLUSIONS: Head and neck tumors had distinctive PP and D values by using IVIM MR imaging.
ABBREVIATIONS:D⫽diffusion coefficient; D*⫽perfusion-related incoherent microcirculation; f⫽perfusion factor; IVIM⫽intravoxel incoherent motion; PP⫽ perfusion-related parameter; SCC⫽squamous cell carcinoma; SG⫽salivary gland
D
WI can estimate the Brownian motion of intracellular and ex-tracellular water molecules. It is based on the displacement of water molecules that are allowed to migrate for a given time.1,2The movement of water molecules is impeded by the presence of cells, membranes, and extracellular and intracellular macromolecules. In biologic tissues, however, DWI is also affected by microcirculation of blood in the capillaries. Water proton mobility can be characterized by ADC. However, this parameter cannot separate the pure molecu-lar diffusion from the motion of water molecules in the capilmolecu-lary network. IVIM imaging can quantitate molecular diffusion and mi-crocirculation in the capillary network in a single-image voxel at MR imaging.3Le Bihan et al4and Luciani et al5demonstrated that IVIM imaging can distinguish between the pure molecular diffusion andmotion of water molecules in the capillary network with a single DWI acquisition technique, provided that large b-values encompassing both low b-values (⬍200 s/mm2) and high b-values (⬎200 s/mm2) are used.
Recently, several attempts have been made to determine the perfusion and diffusion parameters separately by using IVIM MR imaging.5-7The diffusion properties of tumor tissues largely de-pend on cell attenuation. Some studies have shown that ADCs are useful for predicting malignancy (eg, metastatic nodes in the necks of patients with SCC and salivary gland tumors).8,9 How-ever, this concept has not yet been established.10Perfusion is a very important marker of many physiologic or pathologic pro-cesses. For example, the perfusion parameter can be used as a biomarker for predicting the responsiveness of some types of tu-mors to chemotherapy.11,12Therefore, estimating these 2 distinc-tive phenomena in tumor tissues may be helpful in the preopera-tive characterization of tumors.
A simplified IVIM MR imaging technique based on the IVIM model was used to assess the PP and D of hepatocellular carcino-mas.12In that study, the PP was determined with 4 b-values (0, 200, 400, and 800 s/mm2), a technique that is easy to apply and fast Received February 29, 2012; accepted after revision May 19.
From the Department of Radiology and Cancer Biology, Nagasaki University School of Dentistry, Nagasaki, Japan.
Please address correspondence to Takashi Nakamura, DDS, PhD, Department of Radiology and Cancer Biology, 1-7-1 Sakamoto, Nagasaki 852-8588, Japan; e-mail: [email protected]
compared with the IVIM imaging by using multiple b-values (eg, 0, 10, 20, 30, 50, 80, 100, 200, 400, and 800 s/mm2).5
In the present study, we characterized different types of head and neck tumors by assessing PP and D values on the basis of the IVIM model by using 3 b-values.
MATERIALS AND METHODS
Patients
We retrospectively analyzed IVIM MR images obtained from 118 patients with head and neck tumors who underwent preoperative MR imaging examinations between 2005 and 2010. Of these, 5 patients were excluded from the present study due to poor MR images (severe susceptibility and/or motion artifacts) or prior surgical intervention, such as excisional biopsy. Consequently, we studied diffusion-weighted MR images from 113 patients with head and neck tumors (51 women and 62 men; average age, 60 years; age range, 21–91 years). Eight patients with lymphoma had multiple lesions (1 patient had 4 lesions and 7 patients had 2 lesions each). Therefore, we studied IVIM images of 123 head and neck tumors having⬎10-mm short-axis diameters on contrast-enhanced T1-weighted MR images and comprising 30 SCCs, 28 benign and 20 malignant SG tumors, 36 lymphomas, and 9 schwannomas (Table). This retrospective study was approved by the institutional review board.
Conventional MR Imaging
MR imaging was performed by using a 1.5T MR imaging unit (Gyroscan Intera 1.5T Master; Philips Healthcare, Best, the Neth-erlands) with a 2-channel 11-cm (Synergy-Flex S), 17⫻14 cm (Synergy-Flex M), or 20-cm (Synergy-Flex L) surface coil or a 3-channel head and neck coil (Synergy; Philips Healthcare). We obtained axial T1-weighted (TR/TE/number of signal acquisi-tions⫽ 500/15 ms/2) and fat-suppressed (spectral attenuated with inversion recovery) T2-weighted (TR/TE/number of signal acquisitions⫽6385/80 ms/2) MR images by using a TSE sequence with a TSE factor of 3 (T1-weighted) or 15 (fat-suppressed T2-weighted). We used a 200-mm FOV, 256⫻204 scan and 512⫻ 512 reconstruction matrix sizes, a 4-mm section thickness, and a 0.4-mm section gap.
Contrast-Enhanced MR Imaging
Contrast-enhanced T1-weighted MR images were used as refer-ences for manually placing ROIs on DWI of head and neck tu-mors. Gadolinium (gadopentetate dimeglumine, Magnevist; Bayer Yakuhin, Osaka, Japan) was intravenously injected at a dose of 0.2 mL/kg body weight and at an injection rate of 1.5 mL/s, followed by a 20-mL saline flush.
Diffusion-Weighted Imaging
DWI was performed before the contrast-enhanced MR imaging. Axial DWI (TR/TE/number of signal acquisitions ⫽ 4283/87 ms/4) was obtained by using single-shot spin-echo EPI.8,10We used 3 b factors (0, 500, and 1000 s/mm2). We obtained isotropic diffusion images by applying the 2 higher b factors along the 3 orthogonal directions by using a 200-mm FOV, 4-mm section thickness, 0.4-mm section gap, and 112⫻90 matrix size. Phase-encoding was applied along the anteroposterior direction. The surface coils were placed on the left and right sides of the neck, and the head and neck coil elements were placed on the anterior and posterior sides of the head and neck. The parallel imaging (sensi-tivity encoding factor⫽2) technique was used for rapid image acquisition and reducing susceptibility artifacts. Imaging time was 2 minutes 8 seconds for the acquisition of 25 sections.
Region-of-Interest Placement
We analyzed DWI obtained atb⫽0, 500, and 1000 s/mm2. We used 1–3 sections from each tumor, depending on the tumor size. A region of interest was manually placed onto each tumor area of the DWI so that it encompassed as much of the tumor area as possible. Visually large cystic or necrotic areas were excluded. We used contrast-enhanced and nonenhanced T1-weighted MR im-ages as references to determine tumor areas on the corresponding DWI. The IVIM values (PP and D) obtained from 1–3 sections from each tumor were averaged. A radiologist with 15 years’ ex-perience in head and neck radiology placed ROIs and analyzed DWI.
IVIM MR Imaging
The relationship between signal intensities and b-values was as-sessed on the basis of the IVIM theory by using the following equation:
Tumor types, histologic types, and locations of 123 head and neck tumors
Tumor Types No. Locations No.
SCC 30 Tongue 12
Gingiva 10
Oropharynx 3
Oral floor 2
Buccal mucosa 1
Hypopharynx 1
Paranasal sinus 1 SG tumor
Benign 28 Parotid gland 10
Pleomorphic adenoma Submandibular gland 3 Minor salivary gland 2
Warthin tumor Parotid gland 13
Malignanta 20 Parotid gland 7
Submandibular gland 3 Sublingual gland 3 Minor salivary gland 3
Mandible 2
Paranasal sinus 2
Lymphoma 36 Lymph node 19
Oropharynx 3
Nasal cavity 3 Paranasal sinus 2 Thyroid gland 2 Parotid gland 2 Parapharyngeal space 2
Nasopharynx 1
Mandible 1
Submandibular space 1
Schwannoma 9 Carotid space 7
Buccal space 1
Mandible 1
a
1)
Sb/S0 ⫽ (1⫺f )䡠exp(⫺bD)⫹f䡠exp[⫺b(D⫹D*)],
where f is a microvascular volume fraction representing the frac-tion of diffusion linked to microcirculafrac-tion,5D is the diffusion parameter representing pure molecular diffusion (diffusion coef-ficient), and D* is the perfusion-related incoherent microcircula-tion.S0andSbare signal intensities atb⫽0 andb⬎0 s/mm
2,
re-spectively (Fig 1). Because D* is much greater than D, the effects of D* on the signal at large b-values (⬎300 s/mm2) can be ne-glected,5and equation 1 can be simplified as
2) Sb1/Sb2 ⫽ exp[(b2⫺b1)D)],
whereSb1andSb2are signal intensities at 2 different b-values.8 Accordingly, by using logarithmic plots, D can be obtained with a linear regression algorithm. Given an estimated D value from equation 2, the corresponding f and D* values can be calculated by using a nonlinear regression algorithm based on equation 1.
However, the PPs can be determined as 1⫺Sinter/ S0(Sinteris the interception of the logarithmic regression line obtained by using b-values of 500 and 1000 s/mm2with the y-axis) (Fig 1).12 Therefore, we defined the PP value as signal decays due to quasi-random proton movement within the capillary network between
b⫽0 andb⫽500 s/mm2. In the present study, we evaluated tumor perfusion by using PP values and did not assess D* values.
Perfusion and Diffusion Maps
DWIs obtained atb⫽0, 500, and 1000 s/mm2in a DICOM format were transferred onto a personal computer (iMac; Apple, Cuper-tino, California) and were then analyzed by using ImageJ software (National Institutes of Health, http://rsbweb.nih.gov/ij). 2D dis-tributions of the PP and D values were displayed as PP and D maps, respectively (Figs 2– 6).
Statistics
Kruskal-Wallis and Steel-Dwass tests were used for the compari-son of the IVIM parameters among the 6 different types of head and neck tumors. Kruskal-Wallis and Steel-Dwass tests were per-formed by using Excel Statistics, Version 1.12 (Social Survey Re-search Information, Tokyo, Japan).
RESULTS
Perfusion-Related Parameters of Head and Neck Tumors The PP values were significantly different among the 6 types of head and neck tumors (P⬍.001, Kruskal-Wallis test) (Figs 2– 4 and 5A).
The Steel-Dwass test revealed that the PP values of lymphomas (0.09⫾0.04) were the smallest among the different types of head and neck tumors examined (Figs 2 and5A). The PP values of
FIG 1. Perfusion-related parameter and diffusion coefficient as deter-mined on the basis of the IVIM model. The PP is estimated by the equation PP⫽(S0⫺Sinter) /S0. The D is calculated by the equation D⫽ln (S500/S1000)/ 500.S0andSinterare signal intensities atb⫽0 s/mm2and at the interception of the logarithmic regression line
ob-tained by using b-values of 500 and 1000 s/mm2with the y-axis, respectively.
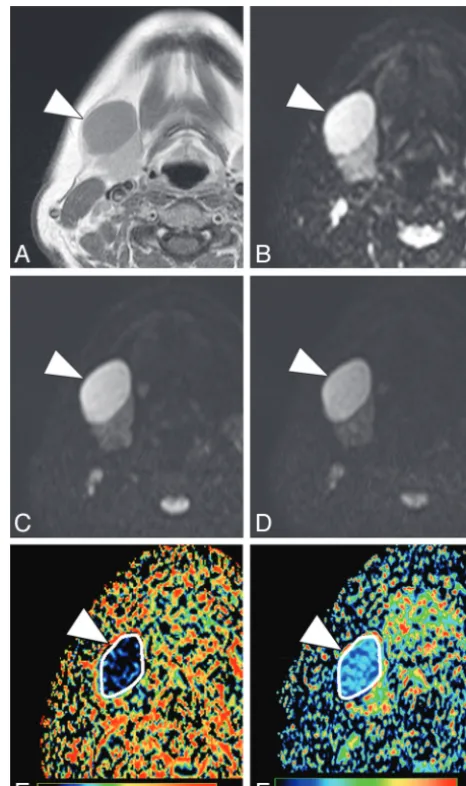
FIG 2. A 50-year-old woman with nodal lymphoma (follicular lym-phoma).A, Axial contrast-enhanced T1-weighted image shows a ho-mogeneously enhancing tumor (arrowhead) in the submandibular space.B, Axial DWI atb⫽0 s/mm2.C, Axial DWI atb⫽500 s/mm2.D,
Axial DWI atb⫽1000 s/mm2.E, Axial PP map shows the tumor
(arrowhead) with very small perfusion (average PP value⫽0.05). The white contour indicates the tumor area on the map.F, Axial D map shows the tumor (arrowhead) with small diffusion (average D value⫽ 0.53⫻10⫺3mm2/s). The white contour indicates the tumor area on
[image:3.594.300.533.46.439.2] [image:3.594.54.284.46.241.2]malignant SG tumors (0.22⫾0.07) were the largest, and those of SCCs (0.15⫾0.04) were intermediate among the 3 types of ma-lignant tumors (Figs 3 and 5A).
Pleomorphic adenomas had the smallest PP values (0.13⫾ 0.02) among the 3 types of SG tumors (Figs 4 and 5A). The PP values of schwannomas (0.23⫾0.08) were significantly larger than those of pleomorphic adenomas but were similar to those of Warthin tumors (0.19⫾0.04) (Fig 5A).
Diffusion Coefficients of Head and Neck Tumors
The D values were also significantly different among the 6 types of head and neck tumors (P⬍.001, Kruskal-Wallis test) (Figs 2– 4, 5B).
The D values of lymphomas (0.47⫾0.07⫻10⫺3mm2/s) were the smallest among the different types of head and neck tumors examined (Figs 2 and 5B) (Steel-Dwass test). The D values of
malignant SG tumors (1.03⫾0.16⫻10⫺3mm2/s) were the larg-est, and those of SCCs were intermediate (0.82⫾0.17⫻10⫺3 mm2/s) among the 3 types of malignant tumors (Figs 3 and 5B).
The D values were significantly different among the 3 types of SG tumors (Steel-Dwass test); pleomorphic adenomas had the largest (1.44⫾0.39⫻10⫺3mm2/s) and Warthin tumors had the smallest (0.73⫾0.22⫻10⫺3mm2/s) values (Figs 4 and 5B). Furthermore, the D values of pleomorphic adenomas were the largest among the different head and neck tumors examined, but the values were similar to those of schwannomas (1.26⫾0.20⫻ 10⫺3mm2/s) (Fig 5B).
Flow-Related Fraction and Diffusion Properties of Head and Neck Tumors
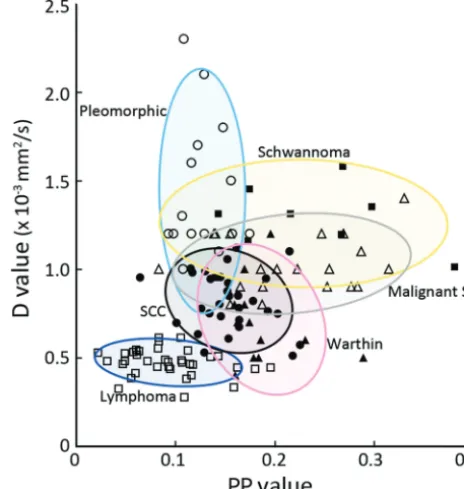
Figure 6 shows the 2D distributions of PP and D values of the head and neck tumors. Lymphomas had low PP (⬍0.15) and D
FIG 3.A 37-year-old woman with SCC in the tongue.A, Axial fat-suppressed contrast-enhanced T1-weighted image shows enhancing tumor (arrowheads), which occupies the right anterior two-thirds of tongue.B, Axial DWI atb⫽0 s/mm2.C, Axial DWI atb⫽500 s/mm2.
D, Axial DWI atb⫽1000 s/mm2.E, Axial PP map shows the tumor
(arrowheads) with small perfusion (average PP value⫽0.14).F, Axial D map shows the tumor (arrowhead) with small diffusion (average D value⫽0.68⫻10⫺3mm2/s).
FIG 4. A 42-year-old woman with pleomorphic adenoma in the pa-rotid gland.A, Axial contrast-enhanced T1-weighted image shows en-hancing tumor (arrowhead) in the left parotid gland.B, Axial DWI atb
⫽0 s/mm2.C, Axial DWI atb⫽500 s/mm2.D, Axial DWI atb⫽1000
s/mm2.E, Axial PP map shows the tumor (arrowhead) with small
[image:4.594.300.534.46.438.2] [image:4.594.54.286.48.438.2](⬍1.0⫻10⫺3mm2/s) values. Pleomorphic adenomas also had high PP values; however, their D values were high (⬎1.0⫻10⫺3 mm2/s) and varied greatly. SCCs and Warthin tumors had low-to-high f (⬎0.15) values and low D values. Malignant SG tumors had broad-range to-high PP values and narrow-range low-to-high D values. The PP values of schwannomas were broad-range and similar to those of malignant SG tumors, but their D values were high.
DISCUSSION
We characterized benign and malignant head and neck tumors by using perfusion-related (PP) and purely molecular-based (D) dif-fusion parameters based on the IVIM model. The present study demonstrated that different types of head and neck tumors had distinct IVIM profiles consisting of varying proportions of capil-lary perfusion and pure molecular diffusion components.
Malignant salivary gland tumors, Warthin tumors, and schwannomas had large PP values among the head and neck
tu-mors examined. The PP values of SCCs were intermediate, and those of lymphomas were the smallest among the head and neck tumors examined. These results may be attributed to the differ-ences in histologic structure (in particular, differdiffer-ences in the rel-ative area of stromal tissues) among these tumors. Malignant sal-ivary gland tumors are composed of cancer cell nests within varying amounts of stromal tissues, which may be associated with abundant vessels.13Schwannomas are composed of cellular An-toni A areas with Verocay bodies and hypocellular myxoid AnAn-toni B areas. Small vessels with ectasia are frequently observed in the Antoni B areas. On the other hand, lymphomas exclusively com-prised condensed proliferating lymphoma cells, with scarce amounts of stromal tissues between the tumor cells.14SCCs are associated with varying degrees of deposition of extracellular ma-trix; under these conditions, neovascularization frequently oc-curs. Therefore, the perfusion level of the tumor may represent the relative area of stromal tissues with varying levels of vessel attenuation to the overall tumor area.
The diffusion coefficient level is largely dependent on the ra-tios of the intracellular and extracellular spaces of tumors.4The observed differences in D values among the benign and malignant tumors examined are consistent with this notion; tumors with large areas of stromal tissues appear to exhibit higher D values. The levels of tumor PP values do not correlate with those of tumor D values. For example, the D values of pleomorphic adenomas were significantly higher than those of Warthin tumors and ma-lignant salivary gland tumors; however, the PP values of pleomor-phic adenomas were significantly lower than those of Warthin tumors and malignant salivary gland tumors. These results are
FIG 5. Boxplots show PP (A) and D (B) values of head and neck tumors. The horizontal line is a median (50th percentile) of the measured values; the top and bottom of the box represent the 25th and 75th percentiles, respectively; and whiskers indicate the range from the largest and smallest observed data within the 1.5 interquartile range presented by the box. P indicates the Steel-Dwass test. Plots demon-strated as open circles indicate outliers. Warthin indicates Warthin tumor; Pleomorphic, pleomorphic adenoma.
[image:5.594.300.532.50.294.2] [image:5.594.53.285.50.422.2]consistent with the notion that tumors have distinctive stromal components with varying degrees of vascularization.
The perfusion levels in head and neck tumors may be depen-dent on the tumor microvessel attenuation.15The PP value is determined as the signal intensity ratios of blood capillaries and tumor tissues. However, T2 contributions from tumor tissues and blood capillaries may differ greatly.16Therefore, one should be careful with the interpretation of f in tumors. A prolonged T2 of the tissue will lead to an increasingly lower calculated value of PP. Inconsistent with the present results, a study by using perfu-sion CT imaging showed that blood volumes of malignant salivary gland tumors were significantly lower than those of benign sali-vary gland tumors.17In the present study, however, we found that the f values of malignant salivary gland tumors were significantly higher than those of pleomorphic adenomas. The discrepancy between these studies implies that the tumor perfusion estimated on the basis of contrast-enhanced imaging techniques differs from the tumor perfusion estimated on the basis of the DWI technique.
In the present study, we used 3 b-values (0, 500, and 1000 s/mm2) to determine the PP values on the basis of the IVIM model. However, more b-values⬍300 s/mm2could be used to simulate the biexponential IVIM model to estimate tumor perfu-sion more accurately. Recently, in an attempt to differentiate be-tween patients with liver cirrhosis and those without liver fibrosis, Luciani et al5used 10 b factors (0, 10, 20, 30, 50, 80, 100, 200, 400, and 800 s/mm2) to calculate pure molecular-based and perfusion-related diffusion parameters. Therefore, further studies on a larger cohort comprising a broader spectrum of head and neck tumors should be conducted by using DWI with increased num-bers of b-values⬍300 s/mm2to determine the clinical usefulness of assessing perfusion characteristics of head and neck tumors on the basis of the IVIM model. Another limitation of this study is that we did not perform cross-validation with established perfu-sion techniques, such as CT perfuperfu-sion, arterial spin-labeling, dy-namic susceptibility contrast MR imaging, and/or dydy-namic con-trast-enhanced MR imaging.18-20Future cross-validation studies are required to establish the usefulness of the IVIM parameters in assessing the perfusion characteristics of head and neck tumors.
IVIM MR imaging could potentially be used as a technique for predicting the prognosis of patients with head and neck tumors. Hermans et al21and, more recently, Zima et al11and Bisdas et al22,23demonstrated that CT-determined tumor perfusion effi-ciently predicted the local outcomes of patients with head and neck cancer who received radiation therapy or chemoradiother-apy. These previous studies suggest that perfusion levels of head and neck tumors determine the tumor responsiveness to chemo-radiotherapy. Therefore, perfusion studies by using IVIM imag-ing and contrast-enhanced CT may be useful for predictimag-ing the efficacy of chemoradiotherapy in patients with head and neck SCCs, thereby predicting the prognosis of patients with those SCCs.
Previous studies have also shown that the diffusion coeffi-cients could serve as the criteria for differentiating between be-nign and malignant salivary gland tumors as well as between lym-phomas and SCCs in the pharynx.9,24The results of the present study support the clinical feasibility of using
non-contrast-en-hanced perfusion MR imaging as a diagnostic tool for differenti-ating benign and malignant tumors and even for differentidifferenti-ating among different types of malignant tumors in the head and neck. Furthermore, the combined use of PP and D values of tumors might potentiate the clinical use of DWI.
The PP and D values were much overlapped among different types of head and neck tumors as shown in Fig 6. However, these values may be useful in differentiating among some types of head and neck tumors, for example between benign and malignant salivary gland tumors. In addition, this simplified technique for simultaneously assessing perfusion and diffusion characteristics is easy to use and fast. Therefore, a combined use of PP and D values obtained with DWI could be an adjunct to conventional MR im-aging for preoperatively diagnosing different types of head and neck tumors.
CONCLUSIONS
We demonstrated that head and neck tumors have distinctive perfusion-related parameters and diffusion coefficients by using IVIM MR imaging. Characterization of both perfusion and diffu-sion properties of head and neck tumors could be achieved by using a single DWI study with multiple b-values.
REFERENCES
1. Padhani AR, Liu G, Mu-Koh D, et al.Diffusion-weighted magnetic
resonance imaging as a cancer biomarker: consensus and recom-mendations.Neoplasia2009;11:102–25
2. Le Bihan D.Looking into the functional architecture of the brain
with diffusion MRI.Nat Rev Neurosci2003;4:469 – 80
3. Le Bihan D, Breton E, Lallemand D, et al.MR imaging of intravoxel
incoherent motions: application to diffusion and perfusion in neu-rologic disorders.Radiology1986;161:401– 07
4. Le Bihan D, Breton E, Lallemand D, et al.Separation of diffusion and
perfusion in intravoxel incoherent motion MR imaging.Radiology
1988;168:497–505
5. Luciani A, Vignaud A, Cavet M, et al.Liver cirrhosis: intravoxel
incoherent motion MR imaging—pilot study.Radiology2008;249: 891–99
6. Moteki T, Horikoshi H.Evaluation of hepatic lesions and hepatic
parenchyma using diffusion-weighted echo-planar MR with three values of gradient b-factor.J Magn Reson Imaging2006;24:637– 45
7. Coenegrachts K, Delanote J, Ter Beek L, et al.Evaluation of true
diffusion, perfusion factor, and apparent diffusion coefficient in non-necrotic liver metastases and uncomplicated liver hemangio-mas using black-blood echo planar imaging. Eur J Radiol
2009;69:131–38
8. Sumi M, Nakamura T.Diagnostic importance of focal defects in the
apparent diffusion coefficient-based differentiation between lym-phoma and squamous cell carcinoma nodes in the neck.Eur Radiol
2009;19:975– 81
9. Eida S, Sumi M, Sakihama N, et al.Apparent diffusion coefficient
mapping of salivary gland tumors: prediction of the benignancy and malignancy.AJNR Am J Neuroradiol2007;28:116 –21
10. Habermann CR, Arndt C, Graessner J, et al.Diffusion-weighted
echo-planar MR imaging of primary parotid gland tumors: is a pre-diction of different histologic subtypes possible?AJNR Am J Neuro-radiol2009;30:591–96
11. Zima A, Carlos R, Gandhi D, et al.Can pretreatment CT perfusion
predict response of advanced squamous cell carcinoma of the upper aerodigestive tract treated with induction chemotherapy? AJNR Am J Neuroradiol2007;28:328 –34
12. Lewin M, Fartoux L, Vignaud A, et al.The diffusion-weighted
in advanced hepatocellular carcinoma: a pilot study.Eur Radiol
2011;21:281–90
13. Barnes L, Eveson JW, Reichart P, et al.Pathology and Genetics of Head
and Neck Tumours. Lyon, France: IARC Press; 2005
14. Swerdlow SH, Campo E, Harris NL, et al.WHO Classification of
Tu-mours of Haematopoietic and Lymphoid Tissues. 4th ed. Lyon, France: IARC Press; 2008
15. Ash L, Teknos TN, Gandhi D, et al.Head and neck squamous cell
carcinoma: CT perfusion can help noninvasively predict intratu-moral microvessel density.Radiology2009;251:422–28
16. Clark CA, Le Bihan D.Water diffusion compartmentation and
an-isotropy at high b values in the human brain.Magn Reson Med
2000;44:852–59
17. Bisdas S, Baghi M, Wagenblast J, et al.Differentiation of benign and
malignant parotid tumors using deconvolution-based perfusion CT imaging: feasibility of the method and initial results.Eur J Radiol
2007;64:258 – 65
18. Abdel Razek A, Gaballa G.Role of perfusion magnetic resonance
imaging in cervical lymphadenopathy. J Comput Assist Tomogr
2011;35:21–25
19. Schraml C, Boss A, Martirosian P, et al.FAIR true-FISP perfusion
imaging of the thyroid gland.J Magn Reson Imaging2007;26:66 –71
20. Shah G, Wesolowski J, Ansari S, et al.New directions in head and
neck imaging.J Surg Oncol2008;97:644 – 48
21. Hermans R, Meijerink M, Van den Bogaert W, et al.Tumor perfusion
rate determined noninvasively by dynamic computed tomography predicts outcome in head-and-neck cancer after radiotherapy.Int J Radiat Oncol Biol Phys2003;57:1351–56
22. Bisdas S, Rumboldt Z, Sˇurlan-Popovicˇ K, et al.Perfusion CT in
squa-mous cell carcinoma of the upper aerodigestive tract: long-term predictive value of baseline perfusion CT measurements. AJNR Am J Neuroradiol2010;31:576 – 81
23. Bisdas S, Nguyen SA, Anand SK, et al.Outcome prediction after
surgery and chemoradiation of squamous cell carcinoma in the oral cavity, oropharynx, and hypopharynx: use of baseline perfusion CT microcirculatory parameters vs. tumor volume.Int J Radiat Oncol Biol Phys2009;73:1313–18
24. Sumi M, Ichikawa Y, Nakamura T.Diagnostic ability of apparent