J. Range Manage.
55: 535-541 November 2002
Grazing intensity impacts on pasture carbon and nitrogen flow
V.S. BARON'', E. MAPFUMO2, A.C. DICK' , M.A. NAETH2, E.K. OKINE3 AND D.S. CHANASYK2
'Research Scientist and Research Associate with Lacombe Research Centre, Agriculture and Agri-Food Canada, 6000 C&E Trail, Lacombe, Alberta, Canada T4L
1WJ, 2Post-doctoral fellow with the Department of Renewable Resources, University of Alberta, Edmonton, Alberta, Canada T6G 2H1; and Professors with the Department of Renewable Resources, University of Alberta, Edmonton, Alberta, Canada T6G 2H1; 'Associate Professor with Department of Agriculture, Food and Nutritional Science, Agriculture and Forestry Centre, University of Alberta, Edmonton, AB, T6G 2P5.
*Corresponding author (Email address: [email protected]. Contribution #974.
Abstract
There is little information on the impact of grazing intensity on productivity and sustainability of intensively managed pastures in the humid, short-season parkland of the Canadian prairies.
Our hypothesis was that above-ground productivity of dry mat- ter, carbon, nitrogen, and in vitro digestible organic matter would be reduced proportionately with increasing grazing inten- sity. The study was conducted on a Typic Haplustoll at Lacombe, Alberta. Paddocks of meadow bromegrass (Bromus riparius Rhem.), replicated 4 times, were subjected to heavy, medium and light grazing intensities. Measurements and analyses were car- ried out for 3 years. Yields of dry matter, carbon, nitrogen, and in vitro digestible organic matter before and after grazing were determined and seasonal pools of above ground production, dis- appearance and residual were calculated. Concentrations of acid and neutral detergent fiber and lignin were also determined before and after grazing. Increasing grazing intensity tended to increase nitrogen and decrease fiber concentrations for available and residual forage. Heavy and medium grazing intensities pro- duced 83 and 90% as much above ground dry matter and 87 and 90% above ground carbon as the light intensity. All disappear- ance pools were similar among grazing intensities except in vitro digestible organic matter, where heavy was 116% of light. Heavy grazing reduced the contribution of vegetative dry matter, in vitro digestible organic matter, carbon and nitrogen to the resid- ual to 41, 50, 36, and 52% of that for light grazing. Adding esti- mated fecal-carbon to the residual significantly increased total residual carbon. Estimated fecal-carbon represented 68, 51, and 42% of all carbon inputs to litter for heavy, medium and light grazing, respectively. Grazing intensity did not affect estimated pools of excreted nitrogen, but increased estimated percent of nitrogen excreted as urine.
Key Words: nutrient flow, productivity, disappearance, residual, pasture, nutritive value
Resumen
Hay poca informacion sobre el impacto de la intensidad de
apacentamiento en la productividad y sustentabilidad de praderas manejados intensivamente en la region de las praderas humedas de estacion corta de Canada. Nuestra hipotesis fue que la productividad aerea de materia seca, carbon, nitrogeno y materia organica digestible seria reducida proporcionalmente al incremento de la intensidad de apacentamiento. Este estudio se
condujo en Lacombe, Alberta. Potreros de "Meadow bromegrass" (Bromus riparius Rhem.), repetidos 4 veces, se sometieron a intensidades de apacentamiento ligera, moderada y fuerte, las mediciones y analisis se condujeron durante 3 anos.
Los rendimientos de materia seca, carbon, nitrogeno y la materia organica digestible in vitro se determinaron antes y despues del apacentamiento y se calcularon las reservas estacionales de la produccion aerea, desaparicion y del residuo, tambien se deter- minaron las concentraciones de fibra neutro y acido detergente y de lignina. El aumento de la intensidad de apacentamiento tendio a incrementar la concentracion de nitrogeno y a disminuir las concentraciones de fibra del forraje disponible y residual. Las intensidades de apacentamiento moderada y fuerte produjeron el 83 y 90% de la materia seca aerea y el 87 y 90% del carbon aereo productdos con la intensidad ligera. Todas las cantidades de desaparicion fueron similares entre las intensidades de apacentamiento, excepto materia organica digestible in vitro, la cual con el apacentamiento fuerte fue de 116% con respecto al apacentamiento ligero. El apacentamiento fuerte redujo la con- tribucion de materia seca vegetativa, materia organica digestible in vitro, carbon y nitrogeno del residuo en proporciones de 41, 50, 36, y 52% de to registrado con el apacentamiento ligero.
Agregando la estimacion del carbon fecal al residual incremento significativamente el carbon total residual. El carbon fecal esti- mado represento el 68, 51, y 42% de todas las entradas de car- bon en el mantillo, para el apacentamiento fuerte, moderado y ligero respectivamente. La intensidad de apacentamiento no afecto las cantidades estimadas de nitrogeno excretado, pero incremento el porcentaje estimado del nitrogeno excretado en la orina.
Funding for this research was provided by Canada-Alberta Environmentally Sustainable Agriculture Agreement. Support from Norwest Labs, Edmonton, AB is greatly appreciated. We thank David Young, Chris Meyers, and Pascal Ogle for technical assistance. The assistance of Drs. K.N. Harker and E.A. de St Remy in reviewing the manuscript is greatly appreciated.
Manuscript accepted
3Jan. 02.
Managed intensive grazing is relatively new in the parkland vegetation zone of the Canadian prairies. The parkland has a short growing season, and is wetter and cooler than the southern prairies (Campbell et al. 1990), but is more productive. Despite
JOURNAL OF RANGE MANAGEMENT 55(6) November 535
the potential of intensive grazing, very lit- tle basic research has been conducted into its' effect on productivity, and subsequent impact on pasture and soil sustainability.
Grazing per se and grazing intensity, in particular, affects productivity and nutri- tive value of pasture (Briske and Heitschmidt 1991, Wedin 1996), potential for pasture to sequester soil carbon (Schnabel et al. 2001), and for pasture soils to immobilize or mineralize N
(Wedin 1996). Studying the flow of C and N through pasture systems in response to varying grazing intensities, should provide information on potential impacts and limi- tations to long-term pasture sustainability.
Grazing and grazing intensity modify pasture production through effects on leaf area and light interception (Briske and Heitschmidt 1991, Lemaire and Chapman 1996). Generally, productivity is reduced as grazing intensity increases (Parsons et al. 1983, Matches 1992). It follows that the capacity for pastures to accumulate C, N and other nutrients above and below ground may be reduced with increased grazing intensity (Schnabel et al. 2001).
Grazing intensity affects the quantity and quality of organic and mineralized materials that are delivered to the litter and soil as vegetative residues, urine, and feces. As grazing intensifies so does sea- sonal utilization of pasture dry matter, C and N by livestock (Parsons et al. 1983, Briske and Heitschmidt 1991). Therefore the relative proportion of herbage material that passes directly to the litter via senes- cence, rather than indirectly via ruminant feces and urine is also affected (Parsons et al. 1983, Whitehead 1995, Lemaire and Chapman 1996).
Grazing also affects the quality of herbage in the sward and this ultimately impacts degradation rate of litter, soil organic matter, and soil nutrient mineral- ization rates (Wedin 1996). Generally, parameters used to describe nutritive value, such as crude protein and acid detergent fiber (ADF) concentrations have analogous parameters such as C: N ratio and lignin concentration, which are close- ly related to microbial degradation of litter and soil organic matter (Wedin 1996, Schnabel et al. 2001). Improved grazing efficiency as a result of intensive grazing
results in higher leaf to stem ratios (Parsons et al. 1983, Matches 1992) and less dead material left in the sward after grazing (Lemaire and Chapman 1996).
Leaves have higher crude protein and lower ADF concentrations than stems at most stages of grass development (Baron et al. 2000), so leafy residues should
degrade faster than stemy residues. Dead material has a higher C: N ratio than live material, so residence time of organic-C in litter and soil pools is longer (Holland et al. 1992). Ultimately the quality of vegeta- tive material moving from sward to litter pools affects quantity and residence time of C entering the soil pool (McGill et al.
1981, Holland et al. 1992, Wedin 1996, Schnabel et al. 2001).
Nutritive value of ingested herbage influences the fate of waste materials returned as feces and urine. For example, as N content of the sward increases a greater percentage of ingested-N is excret- ed as urine (Haynes and Williams 1993, Whitehead 1995), which then becomes susceptible to loss or plant uptake within a short time (McGill et al. 1981, Holland et al. 1992, Wedin 1996).
In this short-season area, plant growth and nutrient uptake is confined to a period of less than 100 days. Grazing can be intensified over shorter periods (within the window of plant growth) or extended to longer periods beyond the period of plant growth (e.g. 160 days). The pattern and intensity of nutrient flow from sward to litter will impact the quantity and quality of litter and the quantity and residence time of C in the soil, which ultimately affects pasture productivity and sustain- ability. The objectives of this study were:
to determine the impact of grazing intensi- ty on relative pool sizes of sward produc- tivity, residual and disappearance dry mat- ter C, and N; to determine the impact of grazing intensity on herbage and residual nutritive value; to estimate the impact of grazing intensity on proportional amounts of dry matter, C and N passed through a ruminant and returned to residual, com- pared to the vegetative contribution on a rotationally grazed meadow bromegrass (Bromus riparius Rhem.) pasture, grown in a short season area.
Materials and Methods Experiment Establishment
The study was established in 1993 at Lacombe, Alberta, Canada (52° 28' N;
113° 45'W; 847 m) on a Penhold silt loam (Typic Haplustoll) soil. In the spring the experimental area received a broadcast application of 8, 14, 26, and 5 kg ha' of N, P, K, and S, respectively, followed by a
light cultivation and packing. Then
`Paddock' meadow bromegrass was hand broadcast at a rate of 16.8 kg ha' mixed with
1kg ha' of Spredor II alfalfa (Medicago sativa L.). Seeding was fol- lowed by harrowing and packing. Each paddock was a fenced area of 9 x 30 m.
Within each of 4 replicates, 3 paddocks (12 in total) were established for 3 grazing levels. All paddocks were hand weeded during the summer of 1993 and were grazed in late fall, but prior to freezing of the soil. Each spring (1994-1997), fertiliz- ers to supply 100, 22, 42 kg ha' of N, P, and K, respectively were broadcast over all paddocks. No herbicide was applied to the paddocks. By 1995 almost no alfalfa was present in the grazing treatments.
Grazing Treatments
Paddocks were grazed rotationally by yearling heifers from 1994 until 1997, with 3 grazing levels (GL) represented by
different pre-grazing canopy heights.
Canopy heights for grazing initiation were
determined using the weighted disk method (Bransby et al. 1977). Target pre- grazing heights were 13, 17, and 26 cm for heavy, medium, and light grazing levels, respectively. These heights were used to maintain consistency of grazing treat- ments, not to predict pasture yield.
Grazing parameters are given in Table 1.
From 2 to 6 heifers were placed in a pad- dock at a time and left for a period of no more than 24 hours to bring forage mass down to a desired residual mass for each treatment.
Paddock Sampling.
Detailed sampling for grass productivity and C and N flow was carried out during 1995, 1996, and 1997 on meadow bromegrass paddocks. For randomization of sampling, a grid with 2 x 2 m cells was superimposed on each paddock, with the perimeter of the grid
1m from the outside on each side of the paddock. Three loca-
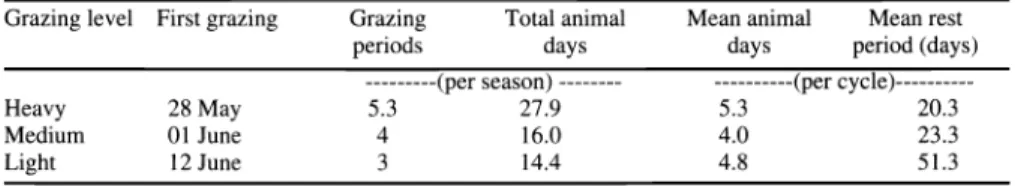
Table 1. Grazing management parameters for grazing intensity levels averaged over 1995, 1996, and 1997.
Grazing level First grazing Grazing animal animal rest
periods days
days (days)
---(per season) --- ---(per cycle)---
Heavy 28 May 5.3
Medium 01 June 4
3
536 JOURNAL OF RANGE MANAGEMENT 55(6) November 2002
tions on the grid were chosen at random for each sampling period with the stipula- tion that each new sample area be at least
1
grid-square away from the one used in the previous harvest. Within a grid-square, 2 stakes were placed at random to mark sampling areas. Prior to and after grazing periods, a rectangular frame (25 x 50-cm) was placed with one corner against the marker stake and the herbage inside the frame was cut 2.5 cm above the soil sur- face. All of the harvested herbage from each paddock was bulked, weighed fresh and then subsampled for determination of dry matter, C, N, in vitro digestible organ- ic matter (IVDOM), acid (ADF) and neu- tral detergent fiber (NDF), and lignin con- centrations.
Leaf area index (LAI) was measured before and after grazing periods in 1995 and 1996 using a LAI-2000 plant canopy analyzer consisting of a LAI-2050 optical sensor (Li-Cor Ltd., Lincoln, Nebr.). Ten readings, taken at random, at least
1m from the edge of each paddock were aver- aged by the instrument.
Chemical and Biological Composition Herbage sub-samples (250 g), taken before and after grazing to be used for determination of dry matter concentration were weighed fresh and dried at 80° C for 72 hours. Similar sub-samples (250 g) taken before and after grazing to be used for determination of forage quality and C composition were dried at 50° C for 72 hours. These were ground, first through a
Wiley mill (Model no. 4; Arthur H.
Thomas Co., Philadelphia, Penn.) equipped with a 2-mm screen and then through a Cyclone mill (Model MS; UD Corporation, Boulder, Colo.) using a 1.0- mm screen, prior to quality determina- tions. The samples were analyzed for total N concentration by a micro-Kjeldahl tech- nique (Wall and Gerke 1975) and an auto analyzer system (industrial method no.
786-86T. Bran & Luebbe INC, Tarrytown, N.Y.,10591-5097). Crude protein concen- tration was calculated as 6.25 x N concen- tration. In vitro digestible organic matter concentration (IVDOM) was measured with direct acidification during a 24 hour second stage pepsin digestion (Marten and Barnes 1980). Neutral detergent fiber, ADF and permanganate lignin (lignin) concentrations were determined sequen- tially (Van Soest and Robertson 1980).
Total C was measured with a Leco Carbon Determinator (Model CN 2000, Leco Corp., St. Joseph, Mich.).
Derived Variables
Available herbage and residual yields were calculated for pre- and post-grazing, respectively. Seasonal pools of above ground productivity, disappearance and the vegetative component of the residual for dry matter, C, N, and IVDOM were determined by a method similar to that described by Singh et al. (1975) as:
n
AP=A1 + (Ai+1- R1) i=1
n
DP=)(A1 -R1) i=1
VR = AP - DP
(1)
(2)
(3) where seasonal above ground productivity (1), disappearance (2), and vegetative residual (3) were calculated from A, avail- able herbage mass, and R, residual, deter- mined before and after each grazing peri- od (i), respectively. Corresponding values for C, N, and IVDOM were determined by multiplying the C, N, and IVDOM con- centration at each grazing period for avail- able herbage and residue by the respective paddock dry matter yield and summing over the season as indicated for above ground productivity, disappearance, and vegetative residue.
Fecal C (which is deposited in the litter) was estimated by partitioning disappear- ance C into digested C and fecal C.
Digested C was determined by multiplying the IVDOM concentration of herbage mass at each grazing period by the C dis- appearance from each grazing period. This was summed over the season as for disap- pearance. Then fecal C was the difference between disappearance C and digested C.
Excreted N of growing cattle was assumed to be 90% of N disappearance (Whitehead 1995). To partition N excreted in urine and fecal-N, percent N excreted in urine at each grazing period was estimated from the generalized equation below (Whitehead 1995):
% N excreted in urine = 45 + 14 x (%N in herbage mass -1.0) (4) Urine N was estimated by multiplying the fraction times N disappearance for that
grazing period, summing over grazing periods within the season. Fecal-N excret- ed was estimated by subtracting urine N from excreted N for the season.
Statistical Analyses
Data shown for LAI were analyzed as averages over grazing cycles within each paddock and year. Data for chemical and biological composition of available herbage (before grazing) and residual (after grazing) were analyzed statistically as weighted- means of all grazing periods within pad- docks and years. Data were subjected to analysis of variance using the SAS GLM procedure (SAS Institute 1989) with a split- plot model. Grazing levels (GL) were main plot effects tested for significance using replication (GL) as the error term, years (repeated measures) were a subplot factor and the interactions were tested with the residual error (Steel and Torrie 1980).
Where the F-test indicated a significant (P
< 0.05) effect, means were separated by LSMEANS using the appropriate error mean squares (SAS Institute 1989).
Results and Discussion Precipitation from April to October was high in all 3 years, ranging from 106% in 1996 to 146% above the long-term aver- age (362 mm) in 1997, although intermit- tent dry periods occurred as in August of 1996. Long term average mean tempera- tures for June, July, August, and September are 13.6, 16.1, 16.0, and 14.6° C, respectively. Average mean temperatures for these months were usually average to below average during summers of all 3 years.
Productivity
Heavy, medium, and light grazing inten- sities were subjected to 5, 4 and 3 grazing periods, respectively per season (Table 1).
Average rest periods for light were approx- imately 2.5 times longer than for heavy.
Commercial intensive grazing operations in the area might graze 2 to 3 times and occasionally 4 times under conditions of high pasture growth, rainfall and soil fertil- Table 2. Seasonal mean leaf area index before and after grazing meadow bromegrass pastures at
3 intensities averaged over grazing periods and 2 years (1995 and 1996).
Heavy
Grazing intensity Medium
(cm2 cm
2)---
Before grazing 3.07ct 3.53b
After grazing 1.42a 1.46a
Within rows, values followed by the different letters are significantly different (P < 0.05) according to LSMEANS test in SAS (SAS 1989).
JOURNAL OF RANGE MANAGEMENT 55(6) November 537
Table 3. Weighted mean concentrations of in vitro digestible organic matter, neutral detergent fiber, acid detergent fiber, lignin, and protein for available herbage and residual mass from meadow bromegrass pastures grazed at 3 intensities averaged over 3 years (1995, 1996, and 1997).
Grazing intensity IVDOMt NDF ADF Lignin Protein
--- Available Herbage (before grazing) (g kg-) ---
Heavy 759at 474b 253b 33.2b 210a
Medium 710b 522a 284ab 37.Oab 182b
Light 688b 535a 301a 41.2a 168b
Mean 720 510 279 37.0 187
---Vegetative Residual (after grazing) (g kg-') ---
Heavy 694a 502c 269c 56.7a 169a
Medium 685a 549b 300b 51.4a 164a
Light 650b 575a 322a 53.4a 152b
Mean 676 542 297 53.5 161
tIVDOM is in vitro digestible organic matter, NDF is neutral detergent fiber, and ADF is acid detergent fiber.
$Within columns, values followed by different letters are significantly different (P < 0.05) according to LSMEANS test in SAS.
ity, which occurred in the current study.
Efficient pasture production has been reported on perennial ryegrass (Lolium perenne L.) pastures in Europe over a range of LAI between 2 and 4 cm2 cm
2,when managed under continuous or rota- tional grazing (Lemaire and Chapman 1996). Despite higher than normal grazing intensities seasonal average LAI prior to grazing ranged from 3.0 to 5.0 cm2 cm
2for heavy to light grazing intensities (Table 2). There was no difference among grazing intensities for LAI after grazing.
The LAI following grazing would not have been considered low by standards of other studies, where residual LAI were below 1.0 cm2 cm
2(Korte et al. 1982, Parsons et al. 1983).
The nutritional qualities of available herbage before and after grazing are shown in Table 3. Available herbage for heavy grazing had greater nutritional value than light for all parameters shown, while medium was intermediate. Also, medium and light grazing intensities were similar for all of these parameters. However, pre- grazing ADF and lignin for medium were similar to both light and heavy grazing treatments. With the exception of weight- ed-mean lignin concentration nutritive value of residue following grazing was higher for heavy than for light grazing.
However, unlike available herbage,
residue of the medium intensity had higher IVDOM and protein and lower NDF and ADF concentrations than light (Table 3).
Nutritive values for heavy, medium and light intensities, based on weighted-means for available herbage could support aver- age daily gains for growing steers of 1.03, 0.80 and 0.74 kg day' if consumption was as predicted from NDF concentration of the available forage (NRC 1996).
Above-ground productivity of the heavy and medium grazing treatments were 83%
and 90% of the light grazing intensity, respectively for dry matter, and 87% and 90%, respectively for C (Table 4). Above ground productivity of IVDOM and N were similar among grazing intensities (Table 4). The C: N ratio of above ground production was higher for light than other grazing intensities (Table 4).
Magnitudes of above ground productivi- ty of dry matter and C were remarkably close among grazing intensities, even though light and heavy intensities were significantly different (P < 0.05). The results were in general agreement with those of Parsons et al. (1983) who found shoot and gross photosynthesis increased from heavy to light grazing. Generally, gross production increases with increasing LAI (Lemaire and Chapman 1996).
However, in Europe, dry matter produc- tion was relatively more efficient per unit LAI when swards were severely defoliated with short rest periods, than when allowed to attain a large LAI over rest periods longer than 20 days (Parsons et al. 1983, 1988, Parsons and Penning 1988).
The weighted mean above ground pro- ductivity for N and IVDOM reflect differ- ences among treatments, where the higher N and IVDOM concentrations of the
heavy grazing treatment compensate for a
lower above ground production of dry matter, with the reverse apparent for the light grazing intensity (Table 3).
Disappearance
Disappearance of dry matter, C, and N, and the C: N ratio were similar among grazing intensities (Table 4). However, this was the result of seasonal utilization of above ground production of dry matter of approximately 83, 73, and 66% for heavy, medium, and light grazing treat- ments, respectively (data not shown).
Ranges among grazing intensities for sea- sonal utilization of above ground produc- tion of N, C, and IVDOM were compara- ble. By contrast, IVDOM disappearance was significantly higher for heavy com- pared to light grazing intensity, with medi- um being intermediate. Parsons et al.
(1983) observed greater intakes of dry matter from hard compared to leniently grazed treatments. Defoliation was more severe than in our current study.
Mean utilization rate for specific graz-
Table 4. Seasonal above ground productivity, disappearance and residual dry matter, in vitro digestible organic matter, C and N from meadow bromegrass pastures grazed at 3 intensities averaged over 3 years (1995, 1996, and 1997).
Grazing intensity
Heavy Medium Light Mean
--- Above ground productivity (kg ha') ---
DM 5862bt 6355b
IVDOM 4458a 4522a
C 2668b 2746ab
N 212a 217a
C:N 12.6b 12.7b
Disappearance (kg hat) ---
DM 4891a 4661a
IVDOM 3710at 3302ab
C 2327a 2102a
N 182a 160a
C:N 12.8a 13. l a
Vegetative Residual (kg ha
1)---
DM 972c 1694b
IVDOM 748b 1220a
C
341ct645b
N 30.Ob 57.6a
C:N 11.4b 11.2b
Wi Within rows, values followed by different letters are significantly different (P<0.05) according to LSMEANS test in SAS.
DM is dry matter, IVDOM is in vitro digestible organic matter, C is carbon, and N is nitrogen.
538 JOURNAL OF RANGE MANAGEMENT 55(6) November 2002
Table 5. End of season residual dry matter, carbon (C) and nitrogen (N) mass and C:N ratio left in meadow bromegrass pastures subjected to 3 grazing intensities for 3 years (1995, 1996, and 1997).
Grazing intensity
Heavy Medium Light Mean
--- Dry matter (kg ha
1)---
1995
452a 908a
1996 1095bt 3034a
1997