Discriminative Deep Random Walk for Network Classification
Juzheng Li, Jun Zhu, Bo Zhang
Dept. of Comp. Sci. & Tech., State Key Lab of Intell. Tech. & Sys. Tsinghua University, Beijing, 100084, China
[email protected];{dcszj,dcszb}@tsinghua.edu.cn
Abstract
Deep Random Walk (DeepWalk) can learn a latent space representation for describ-ing the topological structure of a network. However, for relational network classifi-cation, DeepWalk can be suboptimal as it lacks a mechanism to optimize the ob-jective of the target task. In this paper, we present Discriminative Deep Random Walk (DDRW), a novel method for re-lational network classification. By solv-ing a joint optimization problem, DDRW can learn the latent space representations that well capture the topological struc-ture and meanwhile are discriminative for the network classification task. Our ex-perimental results on several real social networks demonstrate that DDRW signif-icantly outperforms DeepWalk on multi-label network classification tasks, while retaining the topological structure in the latent space. DDRW is stable and con-sistently outperforms the baseline meth-ods by various percentages of labeled data. DDRW is also an online method that is scalable and can be naturally parallelized.
1 Introduction
Categorization is an important task in natural lan-guage processing, especially with the growing scale of documents in the Internet. As the doc-uments are often not isolated, a large amount of the linguistic materials present a network structure such as citation, hyperlink and social networks. The large size of networks calls for scalable ma-chine learning methods to analyze such data. Re-cent efforts have been made in developing statis-tical models for various network analysis tasks, such as network classification (Neville and Jensen,
2000), content recommendation (Fouss et al., 2007), link prediction (Adamic and Adar, 2003), and anomaly detection (Savage et al., 2014). One common challenge of statistical network models is to deal with the sparsity of networks, which may prevent a model from generalizing well.
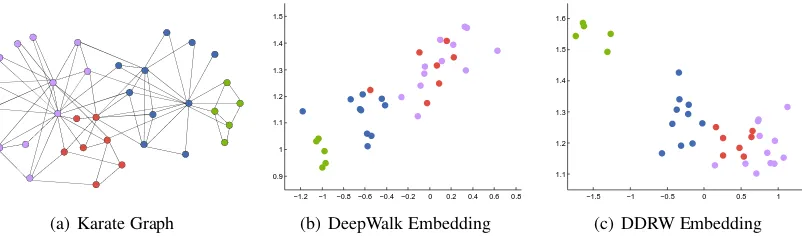
One effective strategy to deal with network sparsity is to learn a latent space representation for the entities in a network (Hoff et al., 2002; Zhu, 2012; Tang and Liu, 2011; Tang et al., 2015). Among various approaches, DeepWalk (Perozzi et al., 2014) is a recent method that embeds all the entities into a continuous vector space using deep learning methods. DeepWalk captures entity fea-tures like neighborhood similarity and represents them by Euclidean distances (See Figure 1(b)). Furthermore, since entities that have closer rela-tionships are more likely to share the same hobbies or belong to the same groups, such an embedding by DeepWalk can be useful for network classifica-tion, where the topological information is explored to encourage a globally consistent labeling.
Although DeepWalk is effective on learning embeddings of the topological structure, when dealing with a network classification task, it lacks a mechanism to optimize the objective of the tar-get task and thus often leads to suboptimal embed-dings. In particular, for our focus of relational net-work classification, we would like the embeddings to be both representing the topological structure of the network actors and discriminative in predicting the class labels of actors.
To address the above issues, we present Dis-criminative Deep Random Walk (DDRW) for re-lational network classification. DDRW extends DeepWalk by jointly optimizing the classification objective and the objective of embedding entities in a latent space that maintains the topological structure. Under this joint learning framework, DDRM manages to learn the latent representations
(a) Karate Graph
−1.2 −1 −0.8−0.6−0.4−0.2 0 0.2 0.4 0.6 0.8 0.9
1 1.1 1.2 1.3 1.4 1.5
(b) DeepWalk Embedding
−1.5 −1 −0.5 0 0.5 1 1.1
1.2 1.3 1.4 1.5 1.6
[image:2.595.101.502.64.183.2](c) DDRW Embedding
Figure 1: Different experimental results of embedding a network into a two dimensional real space. We use Karate Graph (Macskassy and Provost, 1977) for this example. Four different colors stand for the classes of the vertices. In (b), vertices which have stronger relations in the network are more likely to be closer in the embedding latent space. While in (c), besides the above-mentioned property, DDRW makes vertices in different classes more separated.
that are strongly associated with the class labels (See Figure 1(c)), making it easy to find a separat-ing boundary between the classes, and the actors that are connected in the original network are still close to each other in the latent social space. This idea of combining task-specific and representation objectives has been widely explored in other re-gions such as MedLDA (Zhu et al., 2012) and Su-pervised Dictionary Learning (Mairal et al., 2009). Technically, to capture the topological struc-ture, we follow the similar idea of Deep-Walk by running truncated random walks on the original network to extract sequences of ac-tors, and then building a language model (i.e., Word2Vec (Mikolov et al., 2013b)) to project the actors into a latent space. To incorporate the super-vising signal in network classification, we build a classifier based on the latent space representations. By sharing the same latent social space, the two objectives are strongly coupled and the latent so-cial space is guided by both the network topology and class labels. DDRW optimizes the joint objec-tive by using stochastic gradient descent, which is scalable and embarrassingly parallizable.
We evaluate the performance on several real-world social networks, including BlogCatalog, Flickr and YouTube. Our results demonstrate that DDRW significantly boosts the classification ac-curacy of DeepWalk in multi-label network clas-sification tasks, while still retaining the topolog-ical structure in the learnt latent social space. We also show that DDRW is stable and consis-tently outperforms the baseline methods by var-ious percentages of labeled data. Although the networks we use only bring topological
informa-tion for clarity, DDRW is flexible to consider addi-tional attributes (if any) of vertices. For example, DDRW can be naturally extended to classify docu-ments/webpages, which are often represented as a network (e.g., citation/hyperlink network), by con-joining with a word2vec component to embed the documents/webpages into the same latent space, similar as previous work on extending DeepWalk to incorporate attributes (Yang et al., 2015).
2 Problem Definition
We consider the network classification problem, which classifies entities from a given network into one or more categories from a set Y. Let G = (V, E, Y)denote a network, whereV is the set of vertices, representing the entities of the network;
E⊆(V ×V)is the set of edges, representing the relations between the entities; andY ⊆ R|V|×|Y| denotes the labels of entities. We also considerYU
as a set of unknown labels in the same graphG. The target of the classification task is to learn a model from labeled data and generate a label set
YP to be the prediction ofYU. The difference
be-tweenYP andYUindicates the classification
qual-ity.
When classifying elementsX∈Rn, traditional
machine learning methods learn a weight matrix
H to minimize the difference between YP =
F(X, H) and YU, where F is any known fixed
pop-ularly employed. In network classification, the internal structure of a network is resolved to ex-tract the neighboring features of the entities (Mac-skassy and Provost, 2007; Wang and Sukthankar, 2013). Accordingly, the core problem is how to describe the irregular networks within formal fea-ture spaces. A variety of approaches have been proposed with the purpose of finding effective statistical information through the network (Gal-lagher and Eliassi-Rad, 2008; Henderson et al., 2011; Tang and Liu, 2011).
DeepWalk (Perozzi et al., 2014) is an outstand-ing method for network embeddoutstand-ing, which uses truncated random walks to capture the explicit structure of the network and applies language models to learn the latent relationships between the actors. When applied to the network classifica-tion task, DeepWalk first learnsXwhich describes the topological structure of G and then learns a subsequent classifierH. One obvious shortcom-ing of this two-step procedure is that the embed-ding step is unaware of the target class label in-formation and likely to learn embeddings that are suboptimal for classification.
We present Discriminative Deep Random Walk (DDRW) to enhance the effect of DeepWalk by learning X ∈ R|V|×d and H ∈ Rd×|Y| jointly. By using topological and label information of a certain network simultaneously, we will show that DDRW improves the classification accuracy significantly compared with most recent related methods. Furthermore, we will also show that the embedded resultXproduced by DDRW is able to retain the structure ofGwell.
3 Discriminative Deep Random Walk
In this section, we present the details of Discrimi-native Deep Random Walk (DDRW). DDRW has both embedding and classification objectives. We optimize the two objectives jointly to learn latent representations that are strongly associated with the class labels in the latent space. We use stochas-tic gradient descent (Mikolov et al., 1991) as our optimization method.
3.1 Embedding Objective
Letθ = (θ1,θ2, . . . ,θ|V|) denote the embedded vectors in the latent space, andαdenote the topo-logical structure of the graph. The embedding ob-jective can be described as an optimization
prob-4
9 18
12 3
11 5 16
…
Wi : …4 16 18 3 5 …
Wi+1 : …16 12 11 5 9 18…
[image:3.595.328.498.67.263.2]…
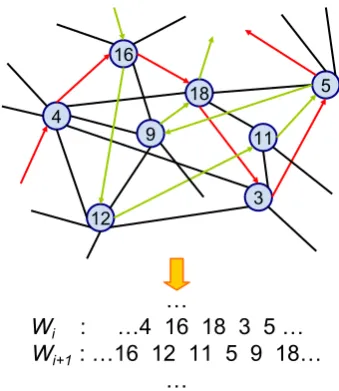
Figure 2: A part of Random Walk process in an undirected graph. Every time an adjacent vertex is chosen randomly (no matter visited or not) as the arrows indicate, until reaching the maximum lengths.
lem as follows:
min
θ Lr(θ,α), (1)
whereLrindicates the difference between the
em-bedded representations θ and original topologi-cal structure α. For this objective, we use trun-cated random walks to capture the topological structure of the graph and the language model Word2Vec (Mikolov et al., 2013b) to learn the la-tent representations. Below, we explain each in turn.
3.1.1 Random Walk
Random Walk has been used in different regions in network analysis to capture the topological structure of graphs (Fouss et al., 2007; Ander-sen et al., 2006). As the name suggests, Random Walk chooses a certain vertex in the graph for the first step and then randomly migrates through the edges. Truncated random walk defines a maxi-mum lengthsfor all walk streams.
τ|V|samples (i.e. walk streams) from the graph. Thus our sample setW ∈ Rτ|V|×s is obtained as
the training materials. 3.1.2 Word2Vec
Existing work has shown that both the vertices in truncated random walks and the words in text arti-cles follow similar power-law distributions in fre-quency, and then the idea of reshaping a social network into a form of corpus is very straight-forward (Perozzi et al., 2014). Corresponding to linguistic analysis region, the objective is to find an embedding for a corpus to show the latent sig-nificances between the words. Words which have closer meanings are more likely to be embedded into near positions. Word2Vec (Mikolov et al., 2013b) is an appropriate tool for this problem. We use the Skip-gram (Mikolov et al., 2013a) strat-egy in Word2Vec, which uses the central word in a sliding window with radius R to predict other words in the window and make local optimiza-tions. Specifically, let ω = rw(α) denote the full walk streams obtained from truncated random walks in Section 3.1.1. Then by Skip-gram we can get the objective function
Lr(θ,α) =− τ
X
i=1
1
s
s
X
t=1
X
−R≤j≤R,j6=0
logp(ωi,t+j|ωi,j).
(2)
The standard Skip-gram method defines
p(ωi,t+j|ωi,j)in Eq.(2) as follows:
p(ωO|ωI) = exp(θ T
ωOθˆωI) P|V|
i=1exp(θTi θˆωI)
, (3)
whereθˆiandθiare the input and output
represen-tations of theith vertex, respectively.
One shortcoming of the standard form is that the summation in Eq.(3) is very inefficient. To reduce the time consumption, we use the Hierar-chical Softmax (Mnih and Hinton, 2009; Morin and Bengio, 2005) which is included in Word2Vec packages∗. In Hierarchical Softmax, the Huffman binary tree is employed as an alternative represen-tation for the vocabulary. The gradient descent step will be faster thanks to the Huffman tree struc-ture which allows a reduction of output units nec-essarily evaluated.
∗https://code.google.com/archive/p/word2vec/
3.2 Classification Objective
Lety = (y1,y2, . . . ,y|V|)denote the labels, and βdenote the subsequent classifier. The classifica-tion objective can be described as an optimizaclassifica-tion problem:
min
θ,β Lc(θ,β,y). (4)
In DDRW, we use existing classifiers and do not attempt to extend them. Although SVMmulticalss (Crammer and Singer, 2002) often
shows good performance in multi-class tasks em-pirically, we choose the classifier being referred to as L2-regularized and L2-loss Support Vector Classification (Fan et al., 2008) to keep pace with the baseline methods to be mentioned in Section 4.
In L2-regularized and L2-loss SVC, the loss function is
Lc(θ,β,y)
=C
|V|
X
i=1
(σ(1−yiβTθi))2+12βTβ, (5)
whereC is the regularization parameter, σ(x) =
x if x > 0 andσ(x) = 0 otherwise. Eq.(5) is for binary classification problems, and is extended to multi-class problems following the one-against-reststrategy (Fan et al., 2008).
3.3 Joint Learning
The main target of our method is to classify the unlabeled vertices in the given network. We achieve this target with the help of intermediate embeddings which latently represent the network structure. We simultaneously optimize two ob-jectives in Section 3.1 and 3.2. Specifically, let L(θ,β,α,y) = ηLr(θ,α) +Lc(θ,β,y), where
η is a key parameter that balances the weights of the two objectives. We solve the joint optimization problem:
min
θ,β L(θ,β,α,y). (6)
We use stochastic gradient descent (Mikolov et al., 1991) to solve the optimization problem in Eq.(6). In each gradient descent step, we have
θ←θ−δ∂∂Lθ =θ−δ(η∂∂Lθr +∂∂Lθc),
β←β−δ∂L
∂β =β−δ
∂Lc
∂β,
(7)
0.025and linearly decreased with the steps, same as the default setting of Word2Vec. The deriva-tives in Eq.(7) are estimated by local slopes.
In Eq.(7), the latent representations adjust them-selves according to both topological information (∂Lr/∂θ) and label information (∂Lc/∂θ). This
process intuitively makes vertices in the same class closer and those in different classes farther, and this is also proved by experiments (See Fig-ure 1). Thus by joint learning, DDRW can learn the latent space representations that well capture the topological structure and meanwhile are dis-criminative for the network classification task.
We take each sampleWifrom walk streamsW
to estimate the local derivatives of the loss func-tion for a descent step. Stochastic gradient descent enables DDRW to be an online algorithm, and thus our method is easy to be parallelized. Besides, a vertex may repeatedly appear for numerous times inW produced by random walks. This repeat is superfluous for classifiers and there is a consider-able possibility to arise overfitting. Inspired from DropOut (Hinton et al., 2012) ideas, we randomly ignore the label information to control the opti-mization process in an equilibrium state.
4 Experimental Setup
In this section we present an overview of the datasets and baseline methods which we will com-pare with in the experiments.
4.1 Datasets
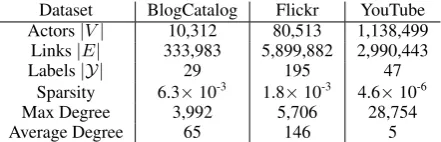
We use three popular social networks, which are exactly same with those used in some of the base-line methods. Table 1 summarizes the statistics of the data.
• BlogCatalog: a network of social relation-ships provided by blog authors. The labels of this graph are the topics specified by the uploading users.
• Flickr: a network of the contacts between users of the Flickr photo sharing website. The labels of this graph represent the interests of users towards certain categories of photos.
• YouTube: a network between users of the Youtube video sharing website. The labels stand for the groups of the users interested in different types of videos.
Dataset BlogCatalog Flickr YouTube Actors|V| 10,312 80,513 1,138,499
Links|E| 333,983 5,899,882 2,990,443
Labels|Y| 29 195 47
Sparsity 6.3×10⁻³ 1.8×10⁻³ 4.6×10⁻⁶
Max Degree 3,992 5,706 28,754
[image:5.595.309.530.62.133.2]Average Degree 65 146 5
Table 1: Statistics of the three networks. Sparsity indicates the ratio of the actual links and links in a complete graph.
4.2 Baseline Methods
We evaluate our proposed method by comparing it with some significantly related methods.
• LINE (Tang et al., 2015)†: This method takes the edges of a graph as samples to train the first-order and second-order prox-imity seprately and integrate the results as an embedding of the graph. This method can handle both graphs with unweighted and weighted and is especially efficient in large networks.
• DeepWalk (Perozzi et al., 2014): This method employs language models to learn latent relations between the vertices in the graph. The basic assumption is that the closer two vertices are in the embedding space, the deeper relationships they have and there is higher possibility that they are in the same categories.
• SpectralClustering (Tang and Liu, 2011): This method finds out that graph cuts are use-ful for the classification task. This idea is implemented by finding the eigenvectors of a normalized graph Laplacian of the original graph.
• EdgeCluster (Tang and Liu, 2009b): This method usesk-means clustering algorithm to segment the edges of the graph into pieces. Then it runs iterations on the small clusters to find the internal relationships separately. The core idea is to scale time-consuming work into tractable sizes.
• Majority: This baseline method simply chooses the most frequent labels. It does not use any structural information of the graph.
†Although LINE also uses networks from Flickr and
As the datasets are not only multi-class but also multi-label, we usually need a thresholding method to test the results. But literature gives a negative opinion of arbitrarily choosing threshold-ing methods because of the considerably different performances. To avoid this, we assume that the number of the labels is already known in all the test processes.
5 Experiments
In this section, we present the experimental results and analysis on both network classification and la-tent space learning. We thoroughly evaluate the performance on the three networks and analyze the sensitivity to key parameters.
5.1 Classification Task
We first represent the results on multi-class clas-sification and compare with the baseline methods. To have a direct and fair comparison, we use the same data sets, experiment procedures and test-ing points as in the reports of our relevant base-lines (Perozzi et al., 2014; Tang and Liu, 2011; Tang and Liu, 2009b). The training set of a spec-ified graph consists of the vertices, the edges and the labels of a certain percentage of labeled ver-tices. The testing set consists of the rest of the la-bels. We employ Macro-F1 and Micro-F1 (Yang, 1999) as our measurements. Micro-F1 computes
F1 score globally while Macro-F1 caculates F1 score locally and then average them globally. All the results reported are averaged from 10 repeated processes.
5.1.1 BlogCatalog
BlogCatalog is the smallest dataset among the three. In BlogCatalog we vary the percentage of labeled data from 10% to 90%. Our results are presented in Table 2. We can see that DDRW performs consistently better than all the baselines on both Macro-F1and Micro-F1with the increas-ing percentage of labeled data. When compared with DeepWalk, DDRW obtains larger improve-ment when the percentage of labeled nodes is high. This improvement demonstrates the significance of DDRW on learning discriminative latent em-beddings that are good for classification tasks. 5.1.2 Flickr
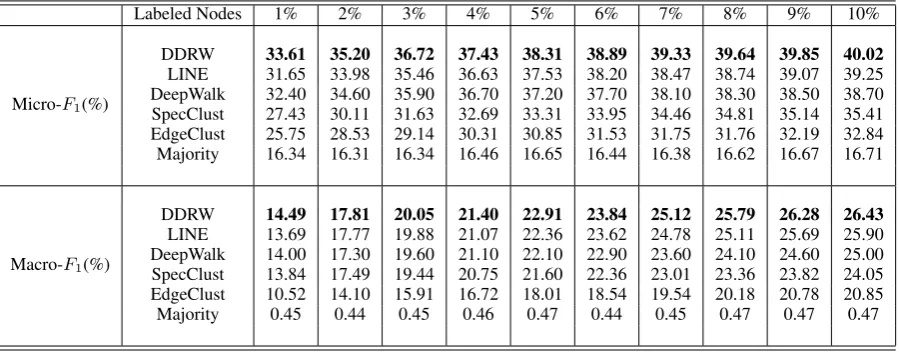
Flickr is a larger dataset with quite a number of classes. In this experiment we vary the percentage of labeled data from 1% to 10%. Our results are
presented in Table 3. We can see that DDRW still performs better than the baselines significantly on both Macro-F1 and Micro-F1, and the results are consistent with what in BlogCatalog.
5.1.3 YouTube
YouTube is an even larger dataset with fewer classes than Flickr. In YouTube we vary the per-centage of labeled data from 1% to 10%. Our re-sults are presented in Table 4. In YouTube, LINE shows its strength in large sparse networks, proba-bly because the larger scale of samples reduces the discrepancy from actual distributions. But from a general view, DDRW still performs better at most of the test points thanks to the latent representa-tions when links are not sufficient.
5.2 Parameter Sensitivity
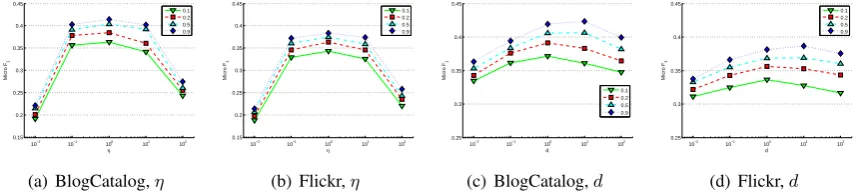
We now present an analysis of the sensitivity with respect to several important parameters. We mea-sure our method with changing parameters to eval-uate its stability. Despite the parameters which are unilateral to classification performance, the two main bidirectional parameters are η and the di-mension d of embedding space in different per-centages of labeled data. We use BlogCatalog and Flickr networks for the experiments, and fix pa-rameters of random walks (τ = 30, s = 40, R = 10). We do not represent the effects of changing parameters of random walks because results usu-ally show unilateral relationships with them.
5.2.1 Effect ofη
The key parameterη in our algorithm adjusts the weights of two objectives (Section 3.3). We rep-resent the effect of changingηin Figure 3(a) and 3(b). We fixd = 128in these experiments. Al-though rapid gliding can be observed on either sides, there are still sufficient value range where DDRW keeps the good performance. These ex-periments also show that η is not very sensitive towards the percentage of labeled data.
5.2.2 Effect of Dimensionality
We represent the effect of changing dimension d
Labeled Nodes 10% 20% 30% 40% 50% 60% 70% 80% 90%
Micro-F1(%)
DDRW 37.13 39.31 41.08 41.76 42.64 43.17 43.80 44.11 44.79 LINE 35.42 37.89 39.71 40.62 41.46 42.09 42.55 43.26 43.68 DeepWalk 36.00 38.20 39.60 40.30 41.00 41.30 41.50 41.50 42.00 SpecClust 31.06 34.95 37.27 38.93 39.97 40.99 41.66 42.42 42.62 EdgeClust 27.94 30.76 31.85 32.99 34.12 35.00 34.63 35.99 36.29 Majority 16.51 16.66 16.61 16.70 16.91 16.99 16.92 16.49 17.26
Macro-F1(%)
DDRW 21.69 24.33 26.28 27.78 28.76 29.53 30.47 31.40 32.04 LINE 20.98 23.44 24.91 26.06 27.19 27.89 28.43 29.10 29.45 DeepWalk 21.30 23.80 25.30 26.30 27.30 27.60 27.90 28.20 28.90 SpecClust 19.14 23.57 25.97 27.46 28.31 29.46 30.13 31.38 31.78 EdgeClust 16.16 19.16 20.48 22.00 23.00 23.64 23.82 24.61 24.92 Majority 2.52 2.55 2.52 2.58 2.58 2.63 2.61 2.48 2.62
Table 2: Multi-class classification results in BlogCatalog.
Labeled Nodes 1% 2% 3% 4% 5% 6% 7% 8% 9% 10%
Micro-F1(%)
DDRW 33.61 35.20 36.72 37.43 38.31 38.89 39.33 39.64 39.85 40.02 LINE 31.65 33.98 35.46 36.63 37.53 38.20 38.47 38.74 39.07 39.25 DeepWalk 32.40 34.60 35.90 36.70 37.20 37.70 38.10 38.30 38.50 38.70 SpecClust 27.43 30.11 31.63 32.69 33.31 33.95 34.46 34.81 35.14 35.41 EdgeClust 25.75 28.53 29.14 30.31 30.85 31.53 31.75 31.76 32.19 32.84 Majority 16.34 16.31 16.34 16.46 16.65 16.44 16.38 16.62 16.67 16.71
Macro-F1(%)
[image:7.595.89.511.78.255.2]DDRW 14.49 17.81 20.05 21.40 22.91 23.84 25.12 25.79 26.28 26.43 LINE 13.69 17.77 19.88 21.07 22.36 23.62 24.78 25.11 25.69 25.90 DeepWalk 14.00 17.30 19.60 21.10 22.10 22.90 23.60 24.10 24.60 25.00 SpecClust 13.84 17.49 19.44 20.75 21.60 22.36 23.01 23.36 23.82 24.05 EdgeClust 10.52 14.10 15.91 16.72 18.01 18.54 19.54 20.18 20.78 20.85 Majority 0.45 0.44 0.45 0.46 0.47 0.44 0.45 0.47 0.47 0.47
Table 3: Multi-class classification results in Flickr.
Labeled Nodes 1% 2% 3% 4% 5% 6% 7% 8% 9% 10%
Micro-F1(%)
DDRW 38.18 39.46 40.17 41.09 41.76 42.31 42.80 43.29 43.81 44.12 LINE 38.06 39.36 40.30 41.14 41.58 41.93 42.22 42.67 43.09 43.55 DeepWalk 37.95 39.28 40.08 40.78 41.32 41.72 42.12 42.48 42.78 43.05 SpecClust 26.61 35.16 37.28 38.35 38.90 39.51 40.02 40.49 40.86 41.13 EdgeClust 23.90 31.68 35.53 36.76 37.81 38.63 38.94 39.46 39.92 40.07 Majority 24.90 24.84 25.25 25.23 25.22 25.33 25.31 25.34 25.38 25.38
Macro-F1(%)
DDRW 29.35 32.07 33.56 34.41 34.89 35.38 35.80 36.15 36.36 36.72 LINE 27.36 31.08 32.51 33.39 34.26 34.81 35.27 35.52 35.95 36.14 DeepWalk 29.22 31.83 33.06 33.90 34.35 34.66 34.96 35.22 35.42 35.67 SpecClust 24.62 29.33 31.30 32.48 33.24 33.89 34.15 34.47 34.77 34.98 EdgeClust 19.48 25.01 28.15 29.17 29.82 30.65 30.75 31.23 31.45 31.54 Majority 6.12 5.86 6.21 6.10 6.07 6.19 6.17 6.16 6.18 6.19
[image:7.595.75.525.317.494.2]10−2 10−1 100 101 102 0.15 0.2 0.25 0.3 0.35 0.4 0.45 η Micro F 1 0.1 0.2 0.5 0.9
(a) BlogCatalog,η
10−2 10−1 100 101 102 0.15 0.2 0.25 0.3 0.35 0.4 0.45 η Micro F 1 0.1 0.2 0.5 0.9
(b) Flickr,η
10−2 10−1 100 101 102 0.25 0.3 0.35 0.4 0.45 d Micro F 1 0.1 0.2 0.5 0.9
(c) BlogCatalog,d
10−2 10−1 100 101 102 0.25 0.3 0.35 0.4 0.45 d Micro F 1 0.1 0.2 0.5 0.9
[image:8.595.86.516.63.160.2](d) Flickr,d
Figure 3: Parameter Sensitivity in BlogCatalog and Flickr
K 1 5 10 20 50
DDRW(10%) 91.3 71.0 58.3 44.3 31.2 DDRW(50%) 90.9 69.8 62.0 44.7 30.7 DDRW(90%) 90.2 72.8 59.7 43.4 31.1 DeepWalk 91.2 73.2 59.8 46.5 31.2
[image:8.595.80.282.203.266.2]Random 0.7 0.7 0.7 0.6 0.6
Table 5: Adjacency Predict Accuracy(%) in Blog-Catalog.
5.3 Representation Efficiency
Finally, we examine the quality of the latent em-beddings of entities discovered by DDRW. For network data, our major expectation is that the em-bedded social space should maintain the topologi-cal structure of the network. A visualization of the topological structure in a social space is showed in Figure 1. Besides, we examine the neighborhood structure of the vertices. Specifically, we check the top-K nearest vertices for each vertex in the embedded social space and calculate how many of the vertex pairs have edges between them in the observed network. We call this Adjacency Pre-dict Accuracy. Table 5 shows the results, where DDRW with different percentages of labeled data, DeepWalk and Random are compared in BlogCat-alog dataset. The baseline method Random maps all the vertices equably randomly into a fixed-size space. The experiments show that although Deep-Walk outperforms on the whole, the performance of DDRW is approximate. DDRW is proved to inherit some important properties in latent repre-sentations of the network.
6 Related Work
Relational classification (Geman and Geman, 1984; Neville and Jensen, 2000; Getoor and Taskar, 2007) is a class of methods which in-volve the data item relation links during classi-fication. A number of researchers have studied different methods for network relational learning. (Macskassy and Provost, 2003) present a simple
weighted vote relational neighborhood classifier. (Xu et al., 2008) leverage the nonparametric infi-nite hidden relational model to analyze social net-works. (Neville and Jensen, 2005) propose a la-tent group model for relational data, which dis-covers and exploits the hidden structures respon-sible for the observed autocorrelation among class labels. (Tang and Liu, 2009a) propose the latent social dimensions which are represented as con-tinuous values and allow each node to involve at different dimensions in a flexible manner. (Gal-lagher et al., 2008) propose a method that learn sparsely labeled network data by adding ghost edges between neighbor vertices, and (Lin and Co-hen, 2010) by using PageRank. (Wang and Suk-thankar, 2013) extend the conventional relational classification to consider more additional features. (Gallagher and Eliassi-Rad, 2008) propose a com-plimentary approach to within-network classifica-tion based on the use of label-independent fea-tures. (Henderson et al., 2011) propose a re-gional feature generating method and demonstrate the usage of the regional feature in within-network and across-network classification. (Tang and Liu, 2009b) propose an edge-centric clustering scheme to extract sparse social dimensions for collective behavior prediction. (Tang and Liu, 2011) propose the concept of social dimensions to represent the latent affiliations of the entities. (Vishwanathan et al., 2010) propose Graph Kernels to use rela-tional data during classification process and (Kang et al., 2012) propose a faster approximated method of Graph Kernels.
7 Conclusion
than baseline methods. Experiments on differ-ent real-world datasets represdiffer-ent adequate stabil-ity of DDRW. Furthermore, the representations produced by DDRW is both an intermediate vari-able and a by-product. Same as other embedding methods like DeepWalk, DDRW can provide well-formed inputs for statistical analyses other than classification tasks. DDRW is also naturally an online algorithm and thus easy to parallel.
The future work has two main directions. One is semi-supervised learning. The low proportion of labeled vertices is a good platform for semi-supervised learning. Although DDRW has already combined supervised and unsupervised learning together, better performance can be expected after introducing well-developed methods. The other direction is to promote the random walk step. Lit-erature has represented the good combination of random walk and language models, but this com-bination may be unsatisfactory for classification. It would be great if a better form of random walk is found.
Acknowledgments
The work was supported by the National Ba-sic Research Program (973 Program) of China (No. 2013CB329403), National NSF of China (Nos. 61322308, 61332007), the Youngth Top-notch Talent Support Program, Tsinghua TNList Lab Big Data Initiative, and Tsinghua Initiative Scientific Research Program (No. 20141080934).
References
Lada A. Adamic and Eytan Adar. 2003. Friends and neighbors on the web. Social Networks, 25:211– 230.
Reid Andersen, Fan R. K. Chung, and Kevin J. Lang. 2006. Local graph partitioning using pagerank vec-tors. In Foundations of Computer Science, pages 476–486.
Koby Crammer and Yoram Singer. 2002. On the algo-rithmic implementation of multiclass kernel-based vector machines. Journal of Machine Learning Re-search, 2:265–292.
Rong-En Fan, Kai-Wei Chang, Cho-Jui Hsieh, Xiang-Rui Wang, and Chih-Jen Lin. 2008. LIBLINEAR: A library for large linear classification. Journal of Machine Learning Research, 9:1871–1874.
Franc¸ois Fouss, Alain Pirotte, Jean-Michel Renders, and Marco Saerens. 2007. Random-walk compu-tation of similarities between nodes of a graph with
application to collaborative recommendation. IEEE Transactions on Knowledge and Data Engineering, 19:355–369.
Brian Gallagher and Tina Eliassi-Rad. 2008. Lever-aging label-independent features for classification in sparsely labeled networks: An empirical study. In Proceedings of the Second International Conference on Advances in Social Network Mining and Analy-sis, pages 1–19.
Brian Gallagher, Hanghang Tong, Tina Eliassi-Rad, and Christos Faloutsos. 2008. Using ghost edges for classification in sparsely labeled networks. In Pro-ceedings of the 14th ACM SIGKDD International Conference on Knowledge Discovery and Data Min-ing, pages 256–264.
Stuart Geman and Donald Geman. 1984. Stochas-tic relaxation, gibbs distributions, and the bayesian restoration of images. IEEE Trans. Pattern Anal. Mach. Intell., 6:721–741.
Lise Getoor and Ben Taskar. 2007. Introduction to statistical relational learning. The MIT Press.
Keith Henderson, Brian Gallagher, Lei Li, Leman Akoglu, Tina Eliassi-Rad, Hanghang Tong, and Christos Faloutsos. 2011. It’s who you know: graph mining using recursive structural features. In Pro-ceedings of the 17th ACM SIGKDD International Conference on Knowledge Discovery and Data Min-ing, pages 663–671.
Geoffrey E. Hinton, Nitish Srivastava, Alex Krizhevsky, Ilya Sutskever, and Ruslan Salakhut-dinov. 2012. Improving neural networks by preventing co-adaptation of feature detectors. CoRR, abs/1207.0580.
Peter D. Hoff, Adrian E. Raftery, and Mark S. Hand-cock. 2002. Latent space approaches to social net-work analysis. Journal of the American Statistical Association, 97:1090–1098.
U. Kang, Hanghang Tong, and Jimeng Sun. 2012. Fast random walk graph kernel. InSDM, pages 828–838.
Frank Lin and William W. Cohen. 2010. Semi-supervised classification of network data using very few labels. InProceedings of the 2010 International Conference on Advances in Social Networks Analy-sis and Mining, pages 192–199.
Sofus A. Macskassy and Foster J. Provost. 1977. An information flow model for conflict and fission in small groups.Journal of Anthropological Research, 33:452–473.
Sofus A. Macskassy and Foster J. Provost. 2007. Clas-sification in networked data: A toolkit and a univari-ate case study. Journal of Machine Learning Re-search, 8:935–983.
Julien Mairal, Jean Ponce, Guillermo Sapiro, Andrew Zisserman, and Francis R. Bach. 2009. Supervised dictionary learning. InAdvances in Neural Informa-tion Processing Systems, pages 1033–1040.
Tomas Mikolov, Ilya Sutskever, Kai Chen, Gregory S. Corrado, and Jeffrey Dean. 1991. Stochastic gradi-ent learning in neural networks. InProceedings of Neuro-Nˆımes 91.
Tomas Mikolov, Kai Chen, Greg Corrado, and Jef-frey Dean. 2013a. Efficient estimation of word representations in vector space. arXiv preprint arXiv:1301.3781.
Tomas Mikolov, Ilya Sutskever, Kai Chen, Gregory S. Corrado, and Jeffrey Dean. 2013b. Distributed rep-resentations of words and phrases and their compo-sitionality. InAdvances in Neural Information Pro-cessing Systems, pages 3111–3119.
Andriy Mnih and Geoffrey E. Hinton. 2009. A scal-able hierarchical distributed language model. In Ad-vances in Neural Information Processing Systems, pages 1081–1088.
Frederic Morin and Yoshua Bengio. 2005. Hierarchi-cal probabilistic neural network language model. In Proceedings of the International Workshop on Arti-ficial Intelligence and Statistics, pages 246–252. Jennifer Neville and David Jensen. 2000. Iterative
classification in relational data. In Proceedings of AAAI-2000 Workshop on Learning Statistical Mod-els from Relational Data, pages 13–20.
Jennifer Neville and David Jensen. 2005. Leveraging relational autocorrelation with latent group models. InProceedings of the 4th International Workshop on Multi-relational Mining, pages 49–55.
Bryan Perozzi, Rami Al-Rfou, and Steven Skiena. 2014. DeepWalk: online learning of social represen-tations. InProceedings of the 20th ACM SIGKDD International Conference on Knowledge Discovery and Data Mining, pages 701–710.
David Savage, Xiuzhen Zhang, Xinghuo Yu, Pauline Lienhua Chou, and Qingmai Wang. 2014. Anomaly detection in online social networks. Social Networks, 39:62–70.
Lei Tang and Huan Liu. 2009a. Relational learning via latent social dimensions. InProceedings of the 15th ACM SIGKDD International Conference on Knowl-edge Discovery and Data Mining, pages 817–826. Lei Tang and Huan Liu. 2009b. Scalable learning of
collective behavior based on sparse social dimen-sions. InProceedings of the 18th ACM Conference on Information and Knowledge Management, pages 1107–1116.
Lei Tang and Huan Liu. 2011. Leveraging social me-dia networks for classification. Data Mining and Knowledge Discovery, 23:447–478.
Jian Tang, Meng Qu, Mingzhe Wang, Ming Zhang, Jun Yan, and Qiaozhu Mei. 2015. LINE: Large-scale information network embedding. InProceedings of the 24th International Conference on World Wide Web, pages 1067–1077.
S. V. N. Vishwanathan, Nicol N. Schraudolph, Risi Kondor, and Karsten M. Borgwardt. 2010. Graph kernels. Journal of Machine Learning Research, 11:1201–1242.
Xi Wang and Gita Sukthankar. 2013. Multi-label re-lational neighbor classification using social context features. InProceedings of the 19th ACM SIGKDD International Conference on Knowledge Discovery and Data Mining, pages 464–472.
Zhao Xu, Volker Tresp, Shipeng Yu, and Kai Yu. 2008. Nonparametric relational learning for social network analysis. Inthe 2nd SNA-KDD Workshop on Social Network Mining and Analysis.
Cheng Yang, Zhiyuan Liu, Deli Zhao, Maosong Sun, and Edward Y. Chang. 2015. Network representa-tion learning with rich text informarepresenta-tion. In Proceed-ings of the 24th International Joint Conference on Artificial Intelligence, pages 2111–2117.
Yiming Yang. 1999. An evaluation of statistical ap-proaches to text categorization. Information Re-trieval, 1:69–90.
Jun Zhu, Amr Ahmed, and Eric P. Xing. 2012. MedLDA: maximum margin supervised topic mod-els. The Journal of Machine Learning Research, 13:2237–2278.