ORIGINAL RESEARCH
Preliminary Experience with Visualization of
Intracortical Fibers by Focused High-Resolution
Diffusion Tensor Imaging
T. Jaermann N. De Zanche P. Staempfli K.P. Pruessmann A. Valavanis P. Boesiger S.S. Kollias
BACKGROUND AND PURPOSE:The inherent low anisotropy of gray matter and the lack of adequate imaging sensitivity and resolution has, so far, impeded depiction of axonal fibers to their intracortical origin or termination. We tested the hypothesis that an experimental approach with high-resolution diffusion tensor imaging (DTI) provides anisotropic data for fiber tractography with sufficient sensitivity to visualize in vivo the fine distribution of white matter bundles at the intracortical level.
MATERIALS AND METHODS: We conducted phantom measurements of signal-to-noise ratio (SNR) and obtained diffusion tensor maps of the occipital lobe in 6 healthy volunteers using a dedicated miniature phased array detector at 3T. We reconstructed virtual fibers using a standard tracking algorithm.
RESULTS: The coil array provided a SNR of 8.0 times higher at the head surface compared with a standard quadrature whole head coil. Diffusion tensor maps could be obtained with an in-plane resolution of 0.58⫻0.58 mm2. The axonal trajectories reconstructed from the diffusion data penetrate into the cortical ribbon perpendicular to the pial surface. This is the expected pattern for the termina-tions of thalamocortical afferent fibers to the middle layers of the occipital cortex and is consistent with the known microstructural organization of the mammalian cerebral cortex.
CONCLUSION:High-resolution DTI reveals intracortical anisotropy with a distinct parallel geometrical order, perpendicular to the pial surface, consistent with structures that may be identified as the terminal afferents in cortical gray matter.
A
noninvasive method that seems promising for the inves-tigation of the neuronal network in the living human brain is diffusion tensor imaging (DTI).1,2Parameters associ-ated with the diffusion tensor, such as fractional anisotropy (FA),2,3give an indication of the degree of tissue organization.In the measurement of the molecular diffusion of water along neural pathways, DTI techniques have been widely applied for determining the orientation of fiber bundles in the white mat-ter of the human brain.4,5
To study connectivity in the human brain, fiber tracts should be reconstructed and followed to their intracortical neuronal origin or terminations in the gray matter. In white matter, axonal membranes and myelination modulate the de-gree of anisotropic water diffusion,6whereas gray matter has
relatively low anisotropy and thus is extremely difficult to re-construct by DTI. Directional diffusion properties in the gray matter are complicated by a significant component of parallel interconnecting fibers, both within and between cortical lay-ers. Conversely, no anatomic structure extends through the full cortical thickness, and the cell bodies of cortical neurons produce quasi-isotropic water diffusion. Thus, the resulting diffusion tensor in the gray matter appears either more isotro-pic without fully reflecting the microscoisotro-pic anisotropy, or it contains a set of diffusion directions similar to that of a single
specific preferred direction. Resolving intravoxel heterogene-ity can be achieved either by increasing the spatial resolution, or by developing alternative strategies (eg, modeling of the diffusion process in the neural tissue) that are able to resolve multiple intravoxel fiber directions.7,8
A few studies so far have described distinct anisotropy at the cortical gray matter in experimental animals,9,10in the fetal cerebrum,11and more recently in the adult brain, though at a
low spatial resolution.12All of these studies emphasized that
image resolution is of utmost importance for the extraction of anisotropic data for fiber tractography.
In our study, we tested the hypothesis that a high-resolu-tion DTI experimental approach can provide anisotropic data with a distinct geometric order that would allow in vivo visu-alization of the fine distribution of axonal bundles at the in-tracortical level. By using an imaging approach, we combined miniature surface coils with the application of parallel imaging on a 3T MR system. We expected that this combination would provide sufficient sensitivity and resolution to detect in vivo the anisotropic organization of thalamocortical afferents and their reconstruction at the corticomedullary junction and, eventually, intracortically.
Materials and Methods
Subjects and MR Imaging Hardware
We acquired DTI data from 6 healthy volunteers by using a 3T Intera whole-body MR imaging scanner (Philips Medical Systems, Best, the Netherlands) equipped with a Quasar Dual gradient system. It pro-vides a maximum gradient strength of 80 mT/m and a slew rate of up to 100 mT/m/s.
Coil Setup and Measurements of Signal-to-Noise Ratio To achieve the signal-to-noise ratio (SNR) required for high-resolu-tion DTI of the cortical ribbon suitable for an in vivo human study, we
Received February 28, 2007; accepted after revision May 11.
From the Institute for Biomedical Engineering (T.J., N.D.Z., P.S., K.P.P., P.B.), University and ETH Zurich, Zurich, Switzerland; and the Institute of Neuroradiology (T.J., P.S., A.V., S.S.K.), University Hospital Zurich, Zurich, Switzerland.
This work was financially supported by the National Center of Competence in Research on Neural Plasticity and Repair. A fellowship (N.D.Z.) from the Natural Sciences and Engi-neering Research Council of Canada is also gratefully acknowledged.
developed a dedicated receive-only radio-frequency coil array and interface box.13The rectangular dimensions of each element were 35⫻70 mm to maximize signal intensity strength while achieving the required penetration depth and field of view (FOV). We connected each rectangular loop to a high-impedance, low-noise preamplifier through a matching network to minimize the effects of inductive coupling14and to attain favorable noise figures.15In its final form, the array was assembled by placing several such coils on an arced acrylic plate in which its 10-cm radius of curvature permitted a comfortable fit to the occiput of the volunteer’s head. Depending on the desired lateral FOV, either 3 or 5 coils were used.
To objectively evaluate the quality of the obtained images, we performed SNR phantom measurements using 3 detectors: the above-described coil array, an 8-element whole head coil (Philips Medical Systems), and a standard quadrature head coil from the same manufacturer. We measured SNR by taking transverse images of a cylindrical 2-L phantom placed axially in the coil or array. A gradient-echo sequence with the following parameters was used: resolution, 256⫻256; FOV, 180⫻180 mm2; section thickness, 10 mm; 15° flip angle; TE, 5.1 ms; and TR, 10.3 ms. We reconstructed the images using root-sum-of-squares and noise amplitudes calculated as the standard deviations of noise in the corners.
Imaging Protocol
For diffusion-weighted (DW) image acquisition, a single-shot, spin-echo, EPI (sshSE-EPI) sequence was applied with the following pa-rameters: matrix, 256⫻256; FOV, 150⫻150 mm2; sections, 5; thick-ness, 2.5 mm; TE, 67 ms; TR, 2140 ms; and partial Fourier acquisition, 60%. The effective in-plane resolution achieved was 0.58⫻0.58 mm2 (Fig 1). To improve image quality, we used R⫽2.4 fold sensitivity encoding (SENSE)16reduction. Diffusion weighting with a b-factor of 1400 s/mm2was carried out along 15 icosahedrally distributed directions,17complemented by 1 scan with b⫽0. To compensate for
motion, we grouped the signal intensity averages into 2 scans of 12 averages each, permitting registration of the groups before final aver-aging. The duration of 1 scan was 12 minutes, leading to a total scan time (including the SENSE reference scan) of 26 minutes.
Postprocessing and Visualization
After SENSE reconstruction, we performed retrospective interscan motion correction using a 3D rigid coregistration algorithm. Subse-quently, eddy-current-induced image warping was removed with an affine registration algorithm,18and the diffusion tensor’s elements were derived by singular value decomposition. In contrast to Ronen et al,10who investigated the cat visual cortex using a biexponential dif-fusion model, we fitted the data to a single-compartment difdif-fusion model, though the used b-values exceeded the typical value of b⫽ 1000 s/mm2. After diagonalization, the eigenvalues and eigenvectors were determined and color-coded diffusion orientation maps were created (Fig 2B), in which each pixel’s principal eigenvector was visu-alized as a colored line. It is assumed that the direction of this line coincides with the main diffusion direction within the voxel and cor-responds to the orientation of the axon bundle. The length of each line is proportional to the local FA value. We reconstructed the fiber tra-jectories in Fig 2Cusing standard line propagation based on the FACT algorithm.19The rectangular seed area was placed in the white matter close to the white/gray matter junction, covering approximately 20 voxels. From each voxel, 5 trajectories were launched in both direc-tions. The algorithm terminated when a certain lower-limit FA value was reached. A limit of FA⫽0.1 was chosen to trace the structure within the gray matter. In addition to the advantages of parallel im-aging with respect to artifacts and blurring, the tractography ap-proach enabled us to “trace” fiber tracts to a certain depth within the cortical ribbon. We performed postprocessing by using a dedicated software package developed in C⫹⫹.
Fig 1.High-resolution (580⫻580m2
in-plane) diffusion-weighted images of the occipital lobe. The images were obtained with the miniature coil array consisting of 5 coils with use of 2.4-fold SENSE acceleration. The diffusion weighting was b⫽1400 s/mm2.
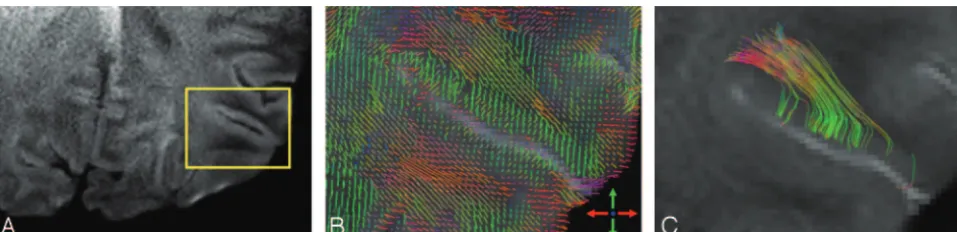
Fig 2.Magnified occipital cortex visualized with 3 different methods.A,Diffusion-weighted image of the occipital lobe with a coil array consisting of 3 coils and 2.4-fold SENSE acceleration. B,Color-coded main diffusion vectors superimposed on T2-weighted (b⫽0) image.C,Reconstructed trajectories representing occipital white matter fibers.
BRAIN
ORIGINAL
[image:2.594.59.536.41.159.2] [image:2.594.56.535.196.312.2]Results
SNR Measurements
We measured and compared the SNRs of 3 different coils at 2 penetration depths. The miniature coil array provided a SNR gain relative to that of the quadrature head coil of 8.0 at the phantom’s surface and 3.4 at a depth of 35 mm. The SNR gains relative to those of the 8-element whole-head array were 4.5 and 1.2 at the same locations. This demonstrated the effective-ness of the miniature coil elements at providing large SNR gains down to depths approximately equal to the coils’ minor dimensions, as required by the DTI protocol used in our study.
DW Images, Tensor Maps, and Fiber Reconstructions
Figure 1 demonstrates DTI data acquired with a detector array consisting of 5 miniature coils. A T2-weighted image (b⫽0), as well as 2 sensitivity-encoded DW examples, obtained with different diffusion-encoding directions, are presented. The data are free of residual SENSE aliasing artifacts and reveal only minor distortions related to variations in susceptibility. The images demonstrate an excellent distinction between gray and white matter. All images are hyperintense at the anterior border because of the restricted penetration depth of the coils. Whereas conventional images are shaded where coil sensitivity is reduced, the SENSE procedure balances the sensitivity in-homogeneity of the coil array, thus leading to increased signal intensity in these areas. Consequently, noise is enhanced com-pared with regions nearer to the surface coils.
We obtained the DW images of the reconstructions shown in Fig 2 with an array consisting of 3 miniature coils. The rectangle of Fig 2Aillustrates an area of 32⫻22 mm2, which is
enlarged in Figs 2B and 2C. Looking at the main diffusion directions represented by the color-coded lines within each voxel (Fig 2B), the gray-white matter junction is clearly iden-tifiable by the sharp change in orientation of the eigenvectors. The anisotropy in the CSF within the subarachnoid space (hy-perintense on the T2-weighted background image) is low, and thus the displayed diffusion orientations appear random. The fibers reconstructed from the high-resolution DTI data, dis-played in Fig 2C, can be followed to the gray-white matter junction where they visibly bend as they penetrate into the cortical ribbon. Their intracortical columnar arrangement perpendicular to the pial surface probably represents thalamic afferents terminating in the middle layers of the cortex.
Discussion
Anatomic Issues
A relatively small number of high-resolution DTI sections (0.58⫻0.58 mm2in-plane), acquired by the combination of a
phased array detector with parallel MR imaging, was sufficient in our experiments to visualize the fine distribution of indi-vidual axonal bundles at the intracortical level. Thalamocor-tical fibers from their paraventricular location were recon-structed up to the gray-white matter junction and eventually intracortically, exhibiting a parallel arrangement perpendicu-lar to the pial surface. It is readily seen that the DTI-generated fibers penetrate the gray matter at the gray-white matter junc-tion, in a manner consistent with structures that may be iden-tified as the terminal afferents in cortical gray matter. It is
generally agreed that the axonal cytoskeleton of neurofila-ments and microtubules as well as membranes are the primary determinant of anisotropic water diffusion in neural fibers.6
Other factors may also contribute to the observed intracortical anisotropy. The adult cerebral cortex is believed to operate as an ensemble of functionally linked radial columns.20,21This
columnar organization, first introduced by Lorente de No21in
1938, has also been described in a wide range of mammalian brains. Nerve cells in layer IV are joined by narrow vertical connections to cells in layers more superficial and subjacent to them, forming columns that are arranged in repeating units across the horizontal extent of the cortex, perpendicular to the pial surface.22This organization would account for a high an-isotropy in the cortex, which, however, is not observed or has a minimal contribution in diffusion measurements. The rea-son for the relatively low anisotropy in the cortex is that during embryonic development (approximately 36 weeks’ gestational age), a sequence of cellular events during neuronal maturation results in microstructural changes, with the formation of local circuits that will eventually lead to a replacement of the radial cortical organization by a predominant laminar one. Degen-eration studies23,24and studies with axonal transport
tech-niques25,26as well as histologically stained sections of the adult
human cerebral cortex demonstrate that individual cortical neurons are capable of forming projections of extraordinary richness and extent oriented parallel or orthogonal to the brain surface in different cortical areas. These changes in mi-crostructure disrupt the initially more pronounced columnar organization, which results in relatively low water diffusion intracortical anisotropy. The radial organization of the cortex has been demonstrated with use of DTI in the human fetal cerebrum at 26 weeks of gestational age, before the appearance of a prominent laminar organization that characterizes the adult cortex.11Strong anisotropies within the cortex are also
likely to arise from the apical dendrites of pyramidal cells, which are generally thicker than axons, and which often as-cend from deep layers to layer I being oriented also perpendic-ular to the pial surface. Certainly, the pattern of anisotropy depicted in the tractography reconstructions (Fig 2) cannot represent the fine distribution of individual axons. With the spatial resolution achieved in our study, each voxel contains thousands of axons. It seems more likely that both dendrites and axons contribute to the discrete radial organization re-vealed by the depicted intracortical anisotropy signal intensity.
Methodologic Issues
SNR, and hence resolution, is an increasing function of main magnetic field strength, and a decreasing function of object size. A magnetic field strength of 3T and the application of SENSE contributed to achieve the necessary high SNR by re-ducing the sampling attenuation and therefore shortening the echo-planar readout and TE.27,28In addition, it narrows the
point spread function, which thus enhances the intrinsic in-plane image resolution used.29We obtained the images with
an in-plane resolution of 0.58⫻0.58 mm2. However, an
unique-ness of the individual coil sensitivity profiles are important. The sensitivity profiles of the newly developed miniature coil elements are sufficiently distinct to assist a robust, artifact-free encoding process, also for increased acceleration factors. No unfolding artifacts are visible in the images acquired with 3 coils. Moreover, despite enhanced field inhomogeneity at 3T, parallel acquisition permitted control of geometric distor-tions. A fundamental feature of the multi-channel miniature coils is the high sensitivity, thus providing a very high SNR at the surface, which is required for high-resolution imaging of the cortex. A TR of 2100 ms was chosen, though at 3T this parameter may lead to incomplete tissue relaxation. In the time constraint of 12 minutes of acquisition, we expect a better SNR by using a relatively short TR with multiple averages, rather than a longer TR with a limited number of averages. As demonstrated in Fig 2, the high SNR achieved in our study allowed us to resolve a distinct intracortical anisotropic com-ponent perpendicular to the pial surface. This corresponds to the known radial intracortical termination of white matter fibers and, probably, to the columnar geometry, which is one of the defining features of cortical organization.30 Similar findings were reported in the cat visual cortex by Ronen et al,10
who used a 2-compartment model to decompose the data into a slow- and fast-component diffusion tensor. Fibers generated on the basis of the slow diffusion tensor seemed to follow the vertical fibers in gray matter. It is suggested that a biexponen-tial model, in which the slow diffusion component is extracted from high b-value data, may be more suitable to describe the diffusion properties in gray matter, in which both the isotropic (eg, cell bodies, glia) and anisotropic (eg, axons) restricted intracellular diffusion components are included, as well as the faster extracellular components. Ronen et al10used b-values of
up to 12,000 s/mm2in their study. On the basis of their data, we decided to use b-values that exceeded the typical choice of 1000 s/mm2 for the monoexponential model used in our
study, though a moderate SNR reduction and a slight increase of eddy currents were expected.
Limitations
Although the achieved results represent a step forward in the detailed depiction of white matter tracts with use of diffusion tractography, our study did not have the microscopic resolu-tion of invasive methods. Methodologic developments allow-ing even higher spatial resolution are necessary to clarify the origin of the anisotropy pattern observed within the cortex. Despite the high in-plane resolution, the voxel size is still anisotropic with a ratio of approximately 4:1. Additional im-provements in the section resolution require a higher SNR that, in the consideration of time acquisition limitations, can only be achieved either in higher magnetic field strengths or by improvement in coil technology. We conducted our study in well-motivated healthy subjects at a total acquisition time of 26 minutes. For this methodology to be applied in clinical patient studies for resolving pathologic changes in cortical mi-crostructure, issues related to the acquisition time should be considered.
The complex, matrix-like structure of cortical gray matter may not be characterized appropriately by a simple monoex-ponential or multiexmonoex-ponential model of 3 orthogonal vectors at each spatial location. High angular resolution diffusion
im-aging (HARDI), such as diffusion spectrum31,32and Q-ball imaging,8could provide more sophisticated models to
char-acterize the complex microscopic organization of the cerebral cortex. HARDI methods have been applied to depict myeloar-chitectonics in the human brain, but applications in the inves-tigation of cortical architecture are still lacking. Unfortu-nately, data acquisition of these methods is very prolonged.
The in vivo nature of our study lacked a direct comparison of our results with other methods such as degeneration, axonal transport, and histologic techniques that can provide infor-mation on the structural organization of the cortex. Correla-tive DTI studies with these invasive techniques in animal mod-els are still necessary to further substantiate the origin of the pattern of intracortical diffusion anisotropy observed in our study.
Conclusions
It has been demonstrated in vivo that a high-resolution DTI technique can reveal the microscopic organization of white matter terminations at the intracortical level in a nondestruc-tive manner. Anisotropy with a distinct parallel geometric or-der consistent with structures that may be identified as the terminal afferents in the gray matter of the visual cortex has been revealed. These data allowed fiber tractography with suf-ficient sensitivity for reconstructing thalamocortical afferents to the corticomedullary junction and eventually within the cortical ribbon. Comparable resolution has previously been achievable only in small-bore animal scanners with field strengths of at least 3 times higher than those in our human study. High-resolution intracortical tracking can evolve into an important method for the study of the structural anatomy of cortical organization and neuronal connectivity in vivo.
Acknowledgments
The authors thank Christoph Leussler, Philips Research Ham-burg, for technical assistance.
References
1. Basser PJ, Mattiello J, LeBihan D.MR diffusion tensor spectroscopy and imag-ing.Biophys J1994;66:259 – 67
2. Pierpaoli C, Jezzard P, Basser PJ, et al.Diffusion tensor MR imaging of the human brain.Radiology1996;201:637– 48
3. Basser PJ, Pierpaoli C.Microstructural and physiological features of tissues elucidated by quantitative-diffusion-tensor MRI.J Magn Reson B1996;111: 209 –19
4. Mori S, Barker PB.Diffusion magnetic resonance imaging: its principle and applications.Anat Rec1999;257:102– 09
5. Mangin JF, Poupon C, Cointepas Y, et al.A framework based on spin glass models for the inference of anatomical connectivity from diffusion-weighted MR data — a technical review.NMR Biomed2002;15:481–92
6. Beaulieu C.The basis of anisotropic water diffusion in the nervous system — a technical review.NMR Biomed2002;15:435–55
7. Tuch DS, Reese TG, Wiegell MR, et al.High angular resolution diffusion im-aging reveals intravoxel white matter fiber heterogeneity.Magn Reson Med
2002;48:577– 82
8. Tuch DS.Q-ball imaging.Magn Reson Med2004;52:1358 –72
9. Hoehn-Berlage M, Eis M, Schmitz B.Regional and directional anisotropy of apparent diffusion coefficient in rat brain.NMR Biomed1999;12:45–50 10. Ronen I, Kim KH, Garwood M, et al.Conventional DTI vs. slow and fast
dif-fusion tensors in cat visual cortex.Magn Reson Med2003;49:785–90 11. McKinstry RC, Mathur A, Miller JH, et al.Radial organization of developing
preterm human cerebral cortex revealed by non-invasive water diffusion an-isotropy MRI.Cereb Cortex2002;12:1237– 43
12. Tuch DS, Reese TG, Wiegell MR, et al.Diffusion MRI of complex neural archi-tecture.Neuron2003;40:885–95
adaptable MRI array systems.Annual Meeting and Exposition of the Interna-tional Society for Magnetic Resonance in Medicine; May 6 –12, 2006; Seattle, Wash. Available from: http://www.ismrm.org/06/Traditional2b.htm 14. Roemer PB, Edelstein WA, Hayes CE, et al.The NMR phased array.Magn Reson
Med1990;16:192–225
15. Reykowski A, Wright SM, Porter JR.Design of matching networks for low noise preamplifiers.Magn Reson Med1995;33:848 –52
16. Pruessmann KP, Weiger M, Scheidegger MB, et al.SENSE: sensitivity encoding for fast MRI.Magn Reson Med1999;42:952– 62
17. Batchelor PG, Atkinson D, Hill DL, et al.Anisotropic noise propagation in diffusion tensor MRI sampling schemes.Magn Reson Med2003;49:1143–51 18. Netsch T, van Muiswinkel A.Quantitative evaluation of image-based
distor-tion correcdistor-tion in diffusion tensor imaging. IEEE Trans Med Imaging
2004;23:789 –98
19. Mori S, Crain BJ, Chacko VP, et al.Three-dimensional tracking of axonal projections in the brain by magnetic resonance imaging. Ann Neurol
1999;45:265– 69
20. Mountcastle VB. The columnar organization of the neocortex. Brain
1997;120:701–22
21. Lorente de No R.Cerebral cortex: architecture, intracortical connections, mo-tor projections.In: Fulton JF, ed.Physiology of the Nervous System.Oxford: Oxford University Press; 1938:288 –330
22. Jones EG.Microcolumns in the cerebral cortex.Proc Natl Acad Sci U S A
2000;97:5019 –21
23. Fisken RA, Garey LJ, Powell TP.The intrinsic, association and commissural
connections of area 17 on the visual cortex.Philos Trans R Soc Lond B Biol Sci
1975;272:487–536
24. Creutzfeldt OD, Garey LJ, Kuroda R, et al.The distribution of degenerating axons after small lesions in the intact and isolated visual cortex of the cat.Exp Brain Res1977;27:419 – 40
25. Ku¨nzle H.Alternating afferent zones of high and low axon terminal density within the macaque motor cortex.Brain Res1976;106:365–70
26. Jones EG, Coulter JD, Hendry SH.Intracortical connectivity of architectonic fields in the somatic sensory, motor and parietal cortex of monkeys.J Comp Neurol1978;181:291–347
27. Bammer R, Auer M, Keeling SL, et al.Diffusion tensor imaging using single-shot SENSE-EPI.Magn Reson Med2002;48:128 –36
28. Jaermann T, Crelier G, Pruessmann KP, et al.SENSE-DTI at 3 T.Magn Reson Med2004;51:230 –36
29. Jaermann T, Pruessmann KP, Valavanis A, et al.Influence of SENSE on image properties in high-resolution single-shot echo-planar DTI.Magn Reson Med
2006;55:335– 42
30. Rockland KS, Pandya DN.Laminar origins and terminations of cortical con-nections of the occipital lobe in the rhesus monkey.Brain Res1979;179:3–20 31. Cory DG, Garroway AN.Measurement of translational displacement
proba-bilities by NMR: an indicator of compartmentation. Magn Reson Med
1990;14:435– 44