Predicting and preventing
ED crowding
1
Predicting and preventing ED crowding
Combining linear regression and discrete event simulation to predict and
prevent ED crowding
Author Supervisors
J.A. Posthumus, BSc Dr. Ir. M.R.K. Mes
Master student Industrial Engineering and University Twente
Management Industrial Engineering and Business Information
Systems (IEBIS)
By order of Dr. D. Demirtas
Ziekenhuisgroep Twente University Twente
Industrial Engineering and Business Information Systems (IEBIS)
R. Visser, Msc
Ziekenhuisgroep Twente S. Busscher, Msc
Ziekenhuisgroep Twente J. Egbers
2
Management summary
The Emergency Department (ED) personnel of ZGT in Almelo experiences periods of crowding. These periods cause high work pressure for the personnel as well as reduced quality of care for the
patients. In April, two important changes occurred: the ED in Hengelo closed, which led to part of its patients going to Almelo, and the A-unit and B-unit (high care and low care respectively) have been introduced in Almelo. After these changes, on average 40-50% of the patients does not start triage within the set norm, and approximately 75% does not finish triage within the norm. Most of the explanations personnel give for these results are related to ED crowding.
The goal of this study is to predict and, with the use of these predictions, reduce the amount, length and intensity of periods of crowding of the ED. To analyze the current situation, crowding scores are measured over a period of three months, the results of which are compared with data from the hospital information system (HiX). A linear regression model is built to predict crowding, and an existing simulation model is updated, extended and revalidated to assess the effects of potential interventions.
The analysis of the measurement and HiX data shows that personnel perceives the morning as significantly less crowded than the other day parts. Monday, Tuesday, Wednesday and Friday are perceived as more crowded than Thursday and weekend days. Differences in perceived crowding per personnel type are insignificant or related to non-patient related tasks. The different patient/staff ratios during the week, the number of departures and number of U1 patients are the most relevant causes of crowding.
When predicting crowding, linear regression is most appropriate given the ease-of-use and the available data. Linear regression models for average crowding score and Length Of Stay (LOS) are not sufficiently accurate for practical use, thus discarded. The linear regression model for average census (number of patients in the ED) has a very good accuracy 1 hour ahead, good accuracy 2 hours ahead and decent accuracy 3+ hours ahead.
Promising interventions are integrated triage, reducing pick-up time (waiting time till patient is picked-up to go to ward), particularly when combined with calling AOA nurses based on the number of patients in the waiting room, and using crowding thresholds to call in temporary extra personnel based on predictions instead of adding extra shifts. Combining these interventions can lead to a LOS decrease of more than 20%. Furthermore, we conclude that adding nurses typically leads to a bigger improvement than adding doctors, both when adding shifts and calling temporary staff. The
exception to this is a combination of calling in extra personnel and applying integrated triage, in this case adding an ED specialist (SA) shift or temporarily calling in an extra SA has a bigger effect than adding nurses. When calling extra internal staff, calling an AOA nurse decreases LOS more than calling an IC nurse, especially when combined with decreased pick-up time. Changing the nurse shifts is not advisable. When adding a nurse shift, adding a early shift has a bigger effect on LOS than a late shift, when adding a PA or SA shift adding a late shift has a bigger effect.
3
Management samenvatting
Het SEH-personeel van het ZGT in Almelo ervaart periodes van drukte. Deze periodes veroorzaken hoge werkdruk en een lagere kwaliteit van zorg. In april hebben twee belangrijke veranderingen plaatsgevonden: de SEH in Hengelo is gesloten, waardoor een deel van die patiëntenpopulatie nu naar Almelo komt, en de A-unit en B-unit zijn ingevoerd op de SEH (respectievelijk intensieve en minder intensieve zorg). Na deze veranderingen starten gemiddeld 40-50% van de patiënten triage niet binnen de gestelde tijd, en voltooien ongeveer 75% van de patiënten triage niet binnen de gestelde tijd. De meeste oorzaken die het personeel hiervoor noemt zijn gerelateerd aan drukte op de SEH.
Het doel van dit onderzoek is het voorspellen en, aan de hand van deze voorspellingen, het reduceren van het aantal, de duur en de intensiteit van de drukke periodes op de SEH. Om de huidige situatie te analyseren wordt de ondervonden drukte gedurende drie maanden gemeten. De resultaten hiervan worden vergeleken met data uit het ziekenhuis informatiesysteem (HiX). Een lineair regressie model wordt gebouwd voor het voorspellen van drukte en een reeds bestaand simulatiemodel wordt ge-update, uitgebreid en opnieuw gevalideerd om de effecten van potentiele interventies te kunnen beoordelen.
Analyse van de meetresultaten en HiX data toont aan dat personeel de ochtend als significant minder druk ervaart dan andere dagdelen. Verder ervaart men maandag, dinsdag, woensdag en vrijdag als drukker dan donderdag en het weekend. Verschillen in ervaren drukte tussen
verschillende type personeel zijn insignificant of te wijten aan niet patiënt-gerelateerde taken. De verschillende staf/patiënt ratios gedurende de week, de hoeveelheid vertrekkende patiënten en de hoeveelheid urgentie 1 patiënten vormen de belangrijkste oorzaken van ervaren drukte.
Lineaire regressie is het meest geschikt om drukte te voorspellen, gegeven de beschikbare data en de gebruiksvriendelijkheid. Lineaire regressie modellen om de druktescore of de ligduur te
voorspellen zijn niet betrouwbaar genoeg voor gebruik, dus afgekeurd. Het lineaire regressie model voor het voorspellen van de gemiddelde census (aantal aanwezige patiënten) is 1 uur vooruit zeer accuraat, 2 uur vooruit accuraat, en 3 uur of verder vooruit acceptabel accuraat.
Veelbelovende interventies zijn sneltriage, het reduceren van ophaaltijden (vooral in combinatie met het inroepen van AOA-verpleegkundigen gebaseerd op het aantal patiënten in de wachtkamer) en het gebruik van drukte grenzen om extra personeel in te roepen aan de hand van voorspellingen in plaats van het standaard toevoegen van personeel shiften. Het combineren van deze interventies kan leiden tot een verlaging van de gemiddelde verblijfsduur met tot meer dan 20%. Verder concluderen we dat het toevoegen van verpleegkundigen over het algemeen leidt tot meer verbetering dan het toevoegen van artsen, zowel als tijdelijk extra capaciteit of standaard shiften. Uitgezonderd wanneer extra personeel wordt gecombineerd met sneltriage, dan leidt het toevoegen van een SEH-arts of arts-assistent tot meer verbetering. Als interne extra capaciteit wordt
ingeroepen, heeft een AOA-verpleegkundige meer effect dan een IC-verpleegkundige, vooral als dit gecombineerd wordt met het reduceren van de ophaaltijd. Het veranderen van shifttijden van verpleegkundigen wordt niet aangeraden. Als een verpleegkundige shift wordt toegevoegd, heeft een vroege shift meer effect dan een late shift. Als een SEH-arts(assistent) of Physiscians assistent shift wordt toegevoegd, heeft een late shift meer effect.
4 capaciteit, zei het door middel van drukte grenzen of extra shiften. Daarom is het advies om
5
Abbreviations and translations / Afkortingen en vertalingen
Abbreviations
AMU Acute Medical Unit / Acute Opname Afdeling (AOA) DES Discrete Event Simulation
ED Emergency Department / Spoedeisende Hulp (SEH) IC Intensive Care
IEP Integrated Emergency Post / Spoedpost KPI Key Performance Indicator
GP General Practitioner / Huisarts
GPC General Practice Center / HuisArtsen Post (HAP) LOS Length Of Stay / Verblijfsduur
TFC Time to First Consult ZGT Ziekenhuisgroep Twente
Translations
6
Contents
Management summary ... 2
Management samenvatting ... 3
Abbreviations and translations / Afkortingen en vertalingen ... 5
Abbreviations ... 5
Translations ... 5
Chapter 1 - Introduction ... 9
1.1 Context and background ... 9
1.1.1 ZGT ... 9
1.1.2 ED patient flow ... 9
1.1.3 Simulation model ... 10
1.2 Problem statement ... 11
1.3 Research objective and questions ... 11
1.3.1 Research objective ... 11
1.3.2 Research questions ... 12
1.3.3 Scope ... 12
1.4 Research methods ... 12
Chapter 2 - Current situation ... 14
2.1 Situation overview ... 14
2.2 Comparison situation after April ... 15
2.3 Conclusion current situation ... 17
Chapter 3 - Theoretical framework ... 18
3.1 Causes of ED crowding ... 18
3.2 Performance Indicators... 18
3.3 Stakeholders ... 19
3.4 Prediction of ED crowding... 20
3.4.1 Formula based... 20
3.4.2 Regression-based ... 21
3.4.3 Time-series analysis ... 21
3.4.4 Queuing theory ... 22
3.4.5 Discrete Event Simulation ... 22
3.4.6 Comparison of methods ... 23
3.5 Potential solutions to reduce ED crowding ... 23
3.5.1 Capacity management ... 24
3.5.2 Reducing LOS/waiting times ... 24
7
Chapter 4 – Data analysis ... 26
4.1 Crowding score measurements ... 26
4.2 Crowding indicators ... 28
4.3 Prediction of ED crowding... 33
4.3.1 Method ... 33
4.3.2 Prediction model results ... 34
4.4 Conclusion data analysis ... 37
Chapter 5 – Updating the simulation model ... 38
5.1 Software and syntax ... 39
5.2 Input parameters and verification assumptions ... 39
5.3 Logistical and structural changes ... 41
5.4 Validation and verification ... 42
5.5 Conclusion updating simulation model ... 43
Chapter 6 – Intervention design ... 44
6.1 Interventions ... 44
6.1.1 Potential interventions that will be modelled ... 44
6.1.2 Potential solutions that will not be modeled ... 47
6.2 Experimental design ... 48
6.2.1 Personnel shift interventions design ... 48
6.2.2 Crowding threshold interventions design ... 49
6.2.3 Combination of all interventions design ... 49
6.3 Sensitivity analysis ... 50
6.4 Conclusion solution design ... 50
Chapter 7 – Solution tests ... 51
7.1 Model settings ... 51
7.2 Experiment results ... 52
7.2.1 Personnel shift intervention results ... 52
7.2.2. Crowding threshold intervention results ... 54
7.2.3 Combination of all interventions results... 57
7.2.4 Sensitivity analysis results ... 59
7.3 Conclusion solution tests ... 62
Chapter 8 - Conclusions and recommendations ... 63
8.1 Research questions ... 63
8.2 Results in practice ... 64
8.3 Recommendations ... 65
8
9.1 Theoretical and practical implications ... 66
9.2 Limitations ... 66
9.3 Further research ... 67
9.3.1 Crowding prediction ... 67
9.3.2 Simulation model ... 68
9.3.3 Interventions ... 68
References ... 70
Appendix A – Patient flow including potential delays ... 73
Appendix B –Linear regression models’ method ... 74
Appendix C – Prediction model average crowding score ... 78
Appendix D – Prediction model LOS ... 84
Appendix E – Prediction model census ... 90
Appendix F – Input simulation model: ratio tables ... 103
Appendix G - Input simulation model: arrival rates ... 103
Appendix H - Input simulation model: processes ... 103
Appendix I – Experiment design ... 104
9
Chapter 1 - Introduction
Emergency Departments (ED) treat a varying number of patients each day. When demand exceeds capacity, this is referred to as ED crowding. ED crowding can lead to patient harm (Wiler, Griffey, & Olsen, 2011), including mortality, reduced quality of care and impaired access to care for patients, as well as provider losses for hospitals (N. R. Hoot & Aronsky, 2008) and patient dissatisfaction (Wiler et al., 2011).
Multiple hospitals in the Netherlands recognize this problem and initiated projects to investigate and reduce ED crowding. During the annual regional gatherings on acute care in the Netherlands (ROAZ), best practices with regards to capacity problems at Dutch EDs are shared and updated (ROAZ, 2016). Personnel of Ziekenhuisgroep Twente (ZGT) experience periods of ED crowding. With this study, ZGT wants to investigate options to predict crowding of their ED and enable better anticipation and handling of periods of perceived crowding.
Section 1.1 elaborates on ZGT and the patient flow inside its ED, Section 1.2 provides the problem statement, which results in the objective and research questions of this study in Section 1.3, which will be studied using the methods described in Section 1.4.
1.1
Context and background
This study is performed in the ED of ZGT Almelo. Section 1.1.1 provides some key figures on ZGT, Section 1.1.2 explains the patient flow in this ED.
1.1.1 ZGT
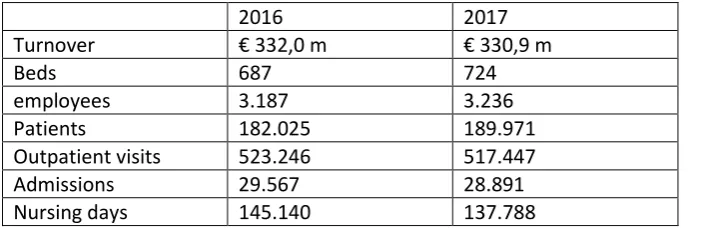
Ziekenhuisgroep Twente (ZGT) is a general hospital with currently a yearly patient flow of 250.000 patients, 220 medical specialists and 3.200 employees. Since 1998, ZGT has two locations, one in Almelo and one in Hengelo. On April 1st 2018, the ED in Hengelo closed, after which an increase an
[image:10.595.71.425.464.579.2]patients could be observed in Almelo (see Chapter 2). This research concerns the ED of the hospital in Almelo.
Table 1 key figures ZGT, source: (ZiekenhuisgroepTwente, 2018)
2016 2017
Turnover € 332,0 m € 330,9 m
Beds 687 724
employees 3.187 3.236
Patients 182.025 189.971
Outpatient visits 523.246 517.447
Admissions 29.567 28.891
Nursing days 145.140 137.788
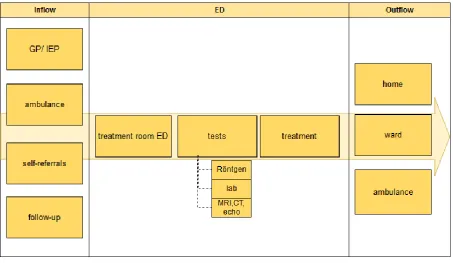
1.1.2 ED patient flow
Patients enter the ED through one of four ways: arrival by ambulance, referred by another doctor (often general practitioner), follow-up, or through self-referral. Since the ED became part of an Integrated Emergency Post (IEP), the number of self-referrals has decreased. Outside office hours patients are, upon entry or when calling, assigned to either the GP-post or the ED depending on their complaints. It is possible for a patient to be referred to the ED after visiting the GP, the opposite does not happen.
10 Once in the ED the patient takes place in the waiting room, unless the patient arrives by ambulance, in which case he is immediately assigned a treatment room. Upon entry the general information and health information of a patient are either recorded or already known (depending on the arrival process). From the waiting room the patient is called in for triage (for which there are specific rooms adjacent to the waiting room), after which the patient returns to the waiting room. If needed, blood samples are taken or photos (X-ray, CT or echo) are requested by the triage nurse. After the triage process, the patient has a triage category, and the patient’s complaint is more clearly defined. Based on this information, a doctor is assigned, and the urgency is determined. The doctor picks up the patient from the waiting room as soon as he becomes available (if no tests are required or patient has a high urgency) or when the tests results are known. The patient is brought to a treatment room. Personnel try to avoid moving patients after they have been assigned a treatment room while in the ED. In the treatment room the patient is examined, and a treatment plan is determined. This examination or treatment plan can include (more) tests such as blood samples or photos, as well as treatment in the ED.
[image:11.595.72.526.314.577.2]There are three main ways in which patients leave the ED: they are discharged and go home, they are admitted to the hospital (AMU, ward or IC), or they are transported per ambulance to other hospitals or care environments. Figure 1 shows the patient flow through the ED.
Figure 1 Patient flow through ED
A more detailed patient flow, including potential delays, can be found in Appendix A.
1.1.3 Simulation model
11
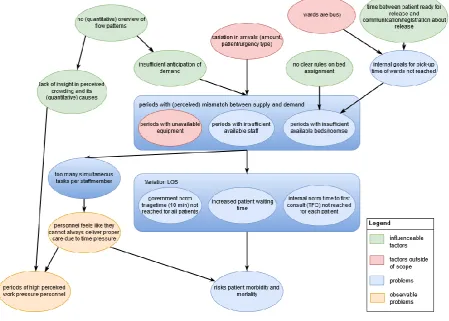
1.2 Problem statement
Due to fluctuations in input, throughput and output, the ED experiences periods of crowding. The objective of this study is to identify causes of crowding, to predict periods of crowding and to assess possible organizational interventions to reduce the amount and intensity of these periods.
High input, slow throughput, low output, or a combination of those can contribute to ED crowding. This can be caused by the following:
- Fluctuation in inflow, mainly due to time/date, number of referrals from GP, and arrival of ambulances.
- Fluctuation of throughput, due to experience of personnel, amount of personnel, capacity (rooms and equipment), required care intensity of patients, organization (e.g., prioritization of tasks), and waiting times with regards to external processes such as lab tests and X-rays. - Fluctuation of output, due to capacity of subsequent wards/personnel, and capacity and
location ambulances.
[image:12.595.74.524.329.650.2]The problem in this case, is that there is insufficient insight in the behavior of these fluctuations. Because of this, the fluctuations are not taken into account when assigning treatment rooms and prioritizing tasks.
Figure 2 Problem cluster
1.3 Research objective and questions
This section outlines the research objective and questions, based on the problem statement as described before.
1.3.1 Research objective
12
1.3.2 Research questions
Based on the research objective, the following research questions are determined: - What is the current situation in the ED in Almelo?
- What is known in literature on ED crowding?
o Causes
o KPIs
o Stakeholders
o Predicting ED crowding
o Potential solutions
- What are the causes of the perceived periods of crowding at the ED? - How can perceived crowding be quantified?
- How can periods and amount of ED crowding be predicted?
o Which trends do the influencing factors follow?
o Which method is best suited to predict ED crowding?
- How can the amount and intensity of the periods of ED crowding be decreased, using the predictions?
o What are potential solutions? - How can potential solutions be evaluated?
o Based on which criteria should the potential solutions be evaluated (KPIs)?
o How should the DES model be updated to create a valid model of the current situation?
- What is the expected performance of the potential solutions?
1.3.3 Scope
This study will be limited to the ED, other steps in the patient trajectory will be considered as in- or outflow only.
1.4 Research methods
To analyze the causes of ED crowding, a literature study is combined with the collection of information through observations and interviews.
To predict crowding, a statistical analysis of ED data is performed, using a regression-based analysis. Crowding indicators are determined by analyzing correlation between ED data and crowding scores gathered by means of a survey among ED staff. Through this survey, the perceived crowding is measured per day part. The day is divided into four day parts based on personnel opinions on crowding peak hours and personnel shifts. The night shift is not taken into account, since the patient flow through the hospital is different at night.
14
Chapter 2 - Current situation
In this chapter the current situation of the ED in Almelo is evaluated based on data from the hospital information system (HiX). Sections 2.1 provides an overview of the situation. Unless stated
otherwise, the data presented in this chapter is from Jan 1st 2017 to June 3rd 2018.
On the first of April 2018, the ED in location was Hengelo closed. This led to an increase in arrivals in Almelo as well as an extra nurse shift. On April 11th , a logistic change was made in Almelo. Between
9:30 and 18:00 on weekdays, the ED is split in an A-unit and B-unit, high care and low care
respectively, with dedicated personnel for each unit. This led to a system with a lower patient/staff ratio and more specialized care on the A-unit and a higher throughput with less acute patients on the B-unit. In Section 2.2 the data from before and after the changes in April is compared.
2.1 Situation overview
Currently, the ED of ZGT Almelo treats a little over 26.000 patients per year. An overview of the patient characteristics as well as the performance of the ED is given in Table 2. Triage norms indicate that all patients must start triage within 5 minutes after arrival, and finish triage within 10 minutes (NVSHV, 2005). As can be seen, the average start-triage time is 5 minutes, which is within the norm, however, the norm is a maximum limit not an intended average. The average finish-triage time currently violates the regulation.
Table 2 Patient characteristics and performance of ED ZGT Almelo. Period: Jan 1st 2017 – April 1st 2018
confidential
confidential
Figure 3 Average number of patients per room type and per urgency type per hour. Period: Jan 1st 2017 – April 1st 2018
Figure 3 shows the average number of patients (census) over the day, divided by room type and urgency type. The figure shows that for all patient types, the number of patients peaks during office hours, with a steep increase in patients occurring between 9 and 11 AM. This corresponds with personnel experience, as personnel states that the ED typically gets crowded around 11 AM. When room-types are compared, the A-unit (high-care) contains the most patients at all times, which contrasts somewhat with the high number of U3 patients (which are also treated in the B-unit), but is not surprising when considering that the A-unit has the largest number of rooms and treatment at the B-unit and in the plaster rooms (GIPS) is typically shorter, thereby reducing patient LOS.
15
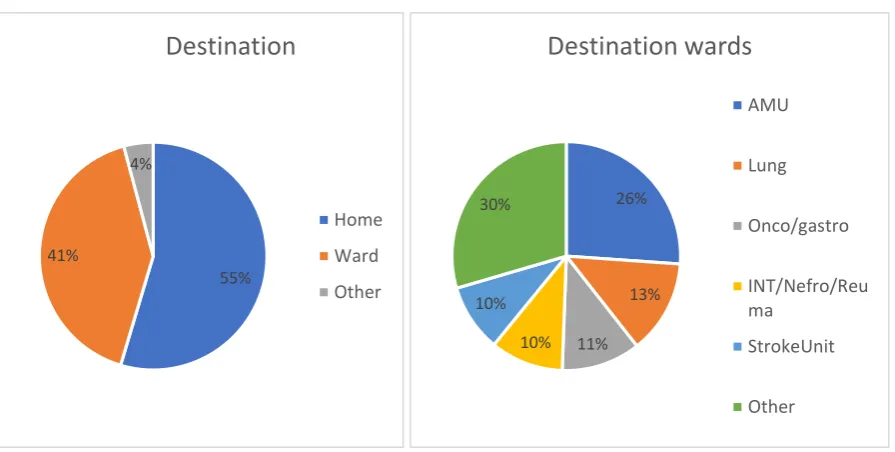
Figure 4 Origin of ED patients
Figure 5 Destination of ED patients Figure 6 Division of ED patients over wards
2.2 Comparison situation after April
After the closure of Hengelo and the implementation of the A-unit and B-unit, it took a few weeks for personnel to get used to the new system, making it hard to state an exact time on which the A-unit and B-A-unit were fully implemented. Combined with the closure of Hengelo and the addition of a staff shift, it is hard to determine the exact effect of each individual change.
Overall, there was a clear increase in patients after the ED in Hengelo closed. Where the ED previously saw an average of 70 patients per day, after April this number increased to 81 (not all Hengelo patients go to Almelo, some go to Enschede). As can be seen in Table 3, only the amount of urgency 0 patients has not significantly changed. This is expected, as resuscitation (urgency 0 patients) were normally treated in Almelo, even before the closure of Hengelo.
68% 18%
10% 2%
2% 0%
0%
Origin
GP
Ambulance
Inpatients
Checkup
Self-referral
OtherHospital
Poli
55% 41%
4%
Destination
Home
Ward
Other
26%
13%
11% 10% 10%
30%
Destination wards
AMU
Lung
Onco/gastro
INT/Nefro/Reu ma
StrokeUnit
[image:16.595.73.521.302.528.2]16
Table 3 t-test comparison amount of patients before and after April
t-test before and after April
p-value
significant difference
arrivals 0,00 Yes
census 0,00 Yes
censusU0 0,68 No
censusU1 0,00 Yes
censusU2 0,00 Yes
censusU3 0,00 Yes
censusU4 0,00 Yes
censusU5 0,00 Yes
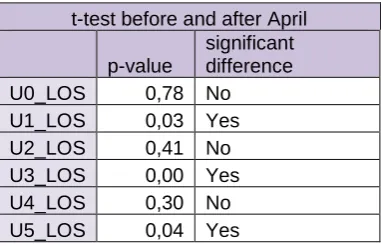
[image:17.595.73.264.397.520.2]As can be seen in Table 4 and Table 5, the LOS of urgency 1, 3 and 5 patients have decreased significantly after April. Together these urgency types form 69% of the patients, which makes a decrease of LOS in these types very interesting. Considering the fact that the number of patients has increased after April, while only one nurse shift has been added (so the patient/staff ratio has increased), a decrease in LOS indicates a process improvement. This could be attributed to the introduction of the A-unit and B-unit, which personnel experiences as a positive change. The fact that the changes in U0 and U4 patients are not statistically significant could be explained by their small number (see Table 2).
Table 4 t-test LOS before and after April
t-test before and after April
p-value
significant difference
U0_LOS 0,78 No
U1_LOS 0,03 Yes
U2_LOS 0,41 No
U3_LOS 0,00 Yes
U4_LOS 0,30 No
U5_LOS 0,04 Yes
17 As mentioned before, there are norms about the maximum time to start and finish triage; per urgency category there is also a norm on the maximum TFC (NVSHV, 2005). Table 5 shows a performance comparison before and after April, while Table 7 shows the performance after April in more detail. With the introduction of the B-unit, the triage system changed slightly. Where there used to be one nurse who was assigned the triage shift, the B-unit nurses are now collectively responsible for triage (also of the A-unit patients). As can be seen, the percentage of patients which meet the triage norms has decreased, while the number of patients who meet the TFC norms has increased. The higher TFC compliance could be explained by the fact that the lower urgency types now have a dedicated set of doctors on the B-unit, whereas they previously shared doctors with the higher urgency (thus higher priority) patients, which could cause the decrease in their TFC.
Table 6 Performance compared to triage norms before and after April
Table 7 performance compared to triage norm per urgency category after April
2.3 Conclusion current situation
When considering the patient care path on a bigger scale (outside of the scope of this research), the GPs/IEP are the most relevant actors regarding inflow, while the AMU is the most relevant actor related to the outflow of ED patients. Within the ED, urgency 1,2,3 and 5 patients have the most relevant impact on the system, while urgency 0 and 4 patients together represent around 3% of the patients, making their impact small.
18
Chapter 3 - Theoretical framework
ED crowding can have negative consequences for both quality of care and logistics. It can negatively affect patient mortality, transport delays, treatment delays, ambulance diversion, patient elopement and financial effect (N. R. Hoot & Aronsky, 2008). Research on this topic is performed across the world. This chapter provides a summary of literature published on causes of ED crowding (Section 3.1), key performance indicators (Section 3.2), stakeholder analysis (Section 3.3), prediction of ED crowding (Section 3.4), and potential solutions to reduce ED crowding (Section 3.5).
3.1 Causes of ED crowding
Literature on causes of ED crowding typically focus on one or more of the following themes: input factors, throughput factors and output factors (N. R. Hoot & Aronsky, 2008).
Causes related to inflow are nonurgent visits, 'frequent-flyer' patients and influenza season. Nonurgent visits can be caused by insufficient or untimely access to primary care. These visits lead to increased inflow, while the patient could have been helped elsewhere (often primary care). The term ‘frequent-flyers’ refers to patients who visit the ED 4 or more times per year, while some of their visits might have been appropriate for primary care (N. R. Hoot & Aronsky, 2008). Epidemics, such as influenza and bronchitis, can cause a temporary increase in ED inflow, leading to a more crowded system (Bouleux, Marcon, & Mory, 2015). The fluctuation of arrivals itself, due to seasonality and external factors, is also studied as a direct cause of ED crowding. These studies focus on matching supply and demand (see next section) (Batal, Tench, McMillan, Adams, & Mehler, 2001; Carvalho-Silva, Monteiro, de Sá-Soares, & Dória-Nóbrega, 2017; Champion et al., 2007).
The main studied potential cause of ED crowding related to throughput is inadequate staffing (N. R. Hoot & Aronsky, 2008). A smaller amount of staff is shown to increase patient waiting time (Lambe et al., 2003), but does not always affect ambulance diversion (Schull, Lazier, Vermeulen, Mawhinney, & Morrison, 2003). Other factors studied are the number of ED beds compared to the number of patients, the training background of the physician in charge and the use of ancillary services (such as CT scans) (N. R. Hoot & Aronsky, 2008).
Causes related to outflow are inpatient boarding and hospital bed shortages. Multiple studies find a positive relation between hospital occupancy and Length Of Stay (LOS) in the ED (N. R. Hoot & Aronsky, 2008). When patients in the ED that require inpatient care are unable to gain access to appropriate hospital beds within a reasonable time frame, they are forced to remain on the ED longer than necessary. This is referred to as access block. Access block leads to increased crowding, ambulance diversion and increased patient waiting times (Fatovich, Nagree, & Sprivulis, 2005).
3.2 Performance Indicators
No single universal definition of ED crowding exists (Weiss et al., 2004). A range of KPIs is used throughout literature on ED crowding, making it difficult to compare the outcomes of the different studies. The KPIs are mainly chosen based on expert opinion or data analysis. In the second case researchers look for variables which correlate with a crowding score given by staff over a certain time period or based on scenarios.
19 Another common group of ED crowding performance indicators are KPIs related to waiting times and patient Length Of Stay (LOS). KPIs used are mean LOS (Connelly & Bair, 2004; N. R. Hoot et al., 2008; Konrad et al., 2013; Wang et al., 2014; Yang, Lam, Low, & Ong, 2016) and LOS variability (Yang et al., 2016), the number of patients waiting (N. R. Hoot et al., 2008), patient waiting time (Connelly & Bair, 2004; N. R. Hoot et al., 2008; Konrad et al., 2013; Nezamoddini & Khasawneh, 2016; Weiss et al., 2004) and time to first consultation (TFC) (Yang et al., 2016). When a patient has to wait too long, they sometimes leave the ED on their own accord without being seen by a doctor. The number of patients who leave the system without being seen is also used as KPI for ED crowding (Wang et al., 2014). A stakeholder analysis in the ED in ZGT Almelo showed that stakeholders valued the following KPIs (Reinders, 2012):
- Time to First Consult (TFC)
- Percentage of patients that started triage within 5 minutes of arrival
- Percentage of patients with a TFC lower than the limit set for their triage category - Patient waiting time between consult and diagnosis (for example waiting for test results) - Patient LOS
3.3 Stakeholders
Mitchell et al (1997) propose a typology of stakeholders based on three relationship attributes: power, legitimacy, and urgency (see Figure 7).
Stakeholders that possess only one of the three attributes are called latent stakeholders, and generally do not warrant a lot of attention from management. These stakeholders are:
- Dormant stakeholders: hold power, but do not possess the legitimacy or urgency to exercise it. No active involvement is needed with this type of stakeholder. However, it is advised to remain aware of these stakeholders, in case they acquire a second attribute.
- Discretionary stakeholders: possess only the attribute of legitimacy.
- Demanding stakeholders: have urgency but lack the power or legitimacy to enforce their opinions.
Stakeholders that possess more than one attribute are called expectant stakeholders. Stakeholders possessing two attributes are moderately important, while stakeholders possessing all attributes are very important. Stakeholders which possess two of the three attributes are classified as follows:
- Dominant stakeholders are both powerful and legitimate. These stakeholders form the ‘dominant coalition’ in a firm.
- Dependent stakeholders have urgency and legitimacy, but lack power. They can only satisfy their claims by relying on dominant stakeholders. If a dominant stakeholder does adopt the claims of a dependent stakeholder, they can become an important stakeholder, possessing all three attributes.
- Dangerous stakeholders have power and urgency, but lack legitimacy. Therefore, they may resort to coercion or violence.
Stakeholders that possess all three attributes are qualified as follows:
- Definitive stakeholders possess power, legitimacy and urgency. These stakeholders are, per definition, part of the ‘dominant core’, and often result from dominant stakeholders gaining urgency. In principle, any expectant stakeholder can become a definitive stakeholder by acquiring their missing attribute.
20
Figure 7 Stakeholder framework (Mitchell, Agle, & Wood, 1997)
Reinders (2012) performed a stakeholder analysis of the Integrated Emergency Post (IEP) in Almelo. The IEP consists of the General Practice Center (GPC) and the ED. Reinders identified the GP, ED physician, manager GPC, manager ED, board of directors, health insurance company and health care inspection as definitive stakeholders (Reinders, 2012). Since the scope of this study is limited to the ED, the ED physician and the manager of the ED are most relevant among these stakeholders for this study.
3.4 Prediction of ED crowding
Literature distinguishes five methods to predict ED crowding: formula-based, regression-based, time-series analysis, queuing theory and discrete-event simulation (DES) (Wiler et al., 2011). These methods are discussed in the next sections correspondingly, ending with a comparison between the methods.
3.4.1 Formula based
Multiple formula-based predictors of ED crowding have been developed and implemented in practice, mostly in the United States. Formula-based approaches compute a (crowding) score based on variables which are considered 'empirically useful' rather than variables chosen on a statistical basis. Using mathematical conceptual formulas, these variables lead to a (crowding) score. The advantage of formula-based methods is that they are easy to use. The disadvantage is that they are less accurate than most other options (Wiler et al., 2011). Jones et al. (2006) evaluated four quantitative crowding scales on sensitivity, specificity and positive predictive value, compared to staff assessments of crowding. They found that of the different scales available, the Emergency Department Work Index (EDWIN), the National Emergency Department Overcrowding Scale (NEDOCS)* and bed ratio from READI (Real-time Emergency Analysis of Demand Indicators) have a good predictive power (AROC > 0.80). Suggesting that they could function effectively after a period of site-specific calibration (Jones et al., 2006). A similar study by Weiss, Ernst and Nick (2006) comparing only EDWIN and NEDOCS* shows that both NEDOCS and EDWIN perform well, with NEDOCS* being slightly favoured in terms of predictive power (Weiss, Ernst, & Nick, 2006). Though, EDWIN requires less data and is therefore easier to use (Bernstein, Verghese, Leung, Lunney, & Perez, 2003). The choice depends on what data is readily available.
*note that NEDOCS is a regression-based method. Since NEDOCS and EDWIN are the most common
21 However, all of these crowding scales lack scalability, and do not perform well on EDs where crowding is not the norm (Jones et al., 2006). This lack of scalability is supported by Wang et al. (2014) who found that NEDOCS* might be inaccurate in an extremely high-volume ED setting by comparing NEDOCS* scores to personnel assessments of simulated ED census scenarios (Wang et al., 2014).
3.4.2 Regression-based
Regression-based methods are one of the two statistical analyses (the other being the time-series analysis). Compared to formula-based methods, this method provides a higher quality prediction but is more difficult to use because it requires more input data (Wiler et al., 2011). After gathering arrival data from three hospital EDs and comparing an autoregression model with multiple extensions, Jones et al. (2008) concluded that regression-based models become more appropriate, informative, and consistently accurate in forecasting daily ED patient volumes when the model incorporates calendar variables, accounts for site-specific special-day effects, and allows for residual autocorrelation (Jones et al., 2008). Batal et al. (2001) performed a stepwise regression analysis, taking into account weather and calendar variables, to predict patient arrivals. Using these predictions, they improved the accuracy in staffing patterns, which leads to improvement in measures of patient satisfaction. Weather variables were found to minimally increase predictive ability (Batal et al., 2001). Carvalho-Silva et al. (2017) find no relation between arrivals and weather factors, supporting the finding from Batal et al. (2001). Bouleux et al. (2015) developed a program based on a multiperiod Serfling-based model that predicts epidemics, which lead to a temporarily increased patient inflow. This model has been introduced in a pediatric ED, which was able to anticipate crowding almost three weeks before the height of the bronchiolitis epidemic (Bouleux et al., 2015).
The previous section discusses a comparison between the formula-based method EDWIN, and NEDOCS. NEDOCS is a model based on five input-parameters/questions, which is used to predict the degree of crowding in medical centers (Weiss et al., 2004). Hoot end Aronsky compared both methods to logistic regression and recurrent neural network approaches. They found that all models showed high discriminatory ability. At comparable rates of false alarms, the logistic regression gave the most advance notice of crowding(62 min), recurrent neural network provides some advance notice (13 min) while both NEDOCS and EDWIN provide no advance notice (N. Hoot & Aronsky, 2006).
3.4.3 Time-series analysis
Time-series analysis is the second statistical analysis used to predict ED crowding. It is suggested to be a better forecasting method than a formula- or regression-based approach. Time-series provide a fair estimate when tracking trends and estimating workload but performs worse in the short-term since it has problems capturing short-term variability. It takes more time/effort to create a time-series analysis than a regression-based model. Besides this, it is comparable to regression-based methods in terms advantages and disadvantages (Wiler et al., 2011).
22
3.4.4 Queuing theory
Queueing theory is mainly useful for understanding the flow and processes in the system, and for determining the effects of interventions (such as adding capacity). Building a queueing model requires considerable time and assumptions to reach the abstraction level needed to build an effective model. Because of the assumptions and abstraction, this method is less suitable for making short-term predictions (Wiler et al., 2011). For instance, Whitt and Zhang used a two-time-scale approach for arrivals and concluded that arrivals are periodic over a week, rather than over a day, which makes models using a week as time unit more reliable (Whitt & Zhang, 2017). Another application of queueing models is the creation of threshold policies, which indicate maximum number of parallel rooms per doctor, to improve efficiency/flow through the ED. This approach incorporates DES and a Pareto analysis as well (van de Vrugt & Boucherie, 2016).
3.4.5 Discrete Event Simulation
Discrete Event Simulation (DES) is very suitable for assessing the effects of a wide range of interventions. Depending on the scope of the model (e.g., on which time-scale the model is validated), it could provide a fair short—term prediction of crowding. A downside of DES is the considerable amount of time and data that is needed to build and maintain a simulation model (Wiler et al., 2011). The amount of simulation studies of discrete event systems increases, mostly in the areas: process & performance, resource & capacity and workforce planning (Salmon, Rachuba, Briscoe, & Pitt, 2018). DES has been applied in multiple ways in relation to ED crowding, the primary goal is not always prediction. Connelly and Bair (2004) use DES to predict waiting times, resulting in a 10% accuracy of average waiting times (individual patient paths are harder to estimate correctly). This model is then used to assess different triage strategies, with inconclusive findings (Connelly & Bair, 2004). Hoot et al. (2008) build a DES model based on theoretical knowledge (instead of a physical/existing ED) and validated it using ED patient data using a sliding-window design (a method used to separate fitting and validation data using time series). The model predicts waiting count, waiting time, occupancy level, LOS and boarding count up to 8 hours into the future. The accuracy is high in the direct future but decreases when forecasting time increases (N. R. Hoot et al., 2008).
23
3.4.6 Comparison of methods
The advantages and disadvantages of each method can be seen in Table 8. To forecast ED crowding short-term, statistical analysis (regression-based or time-series analysis) and DES are suitable. Based on user references or project requirements, a choice needs to be made between ease of use for the ED personnel and the ability to analyze interventions (Wiler et al., 2011).
Table 8 source: Wiler, J. L., Griffey, R. T., & Olsen, T. (2011). Review of modeling approaches for ED patient flow and crowding research. Academic Emergency Medicine, 18(12), 1371-1379. Table2
3.5 Potential solutions to reduce ED crowding
Researched potential solutions can be divided into two categories. First, capacity management solutions that focus on one particular part of the patient flow: input, throughput or output (Section 3.5.1). Second, interventions aimed at reducing patient’s LOS or waiting times throughout the process (Section 3.5.2). As part of capacity management, prediction of arrivals can be used to adapt staff scheduling. This way, supply and demand can be matched (Batal et al., 2001; Carvalho-Silva et al., 2017; Jalalpour et al., 2015). As this is discussed above (see Section 3.4), it is not included in this section.
24
3.5.1 Capacity management
Regarding input, suggested solutions are: better handling of nonurgent referrals, ambulance diversion, destination control (N. R. Hoot & Aronsky, 2008), split-flow triage (Konrad et al., 2013), and classifying patients upon arrival. This classification leads to a probability of needing an inpatient bed, based on which the manager can monitor the process and prevent bottlenecks from forming (Resta, Sonnessa, Tànfani, & Testi, 2017). Split-flow triage involves physically splitting patient flow based on acuity to enable parallel processing. This leads to the conservation of high demand resources for higher acuity patients and an increase of overall throughput (Konrad et al., 2013). ROAZ (2016) presents multiple researches that aim to reduce ED or hospital input by adding or improving diagnoses in earlier stages of the care process (at home, GP or ambulance) and by reducing rehospitalisation. This is done by using new technologies, such as apps for the patients or diagnostic technologies, and by reallocating staff or assigning them extra tasks. Multiple projects focus on improving quality and/or efficiency of elderly care, as the elderly become an increasingly important patient group due to their growing size and their complications such as co-morbidity. Regarding throughput, suggested solutions are: additional personnel, observation units, hospital bed access, crowding measures (N. R. Hoot & Aronsky, 2008) and increasing efficiency room assignment (van de Vrugt & Boucherie, 2016). The projects described in ROAZ (2016) mostly focus on either dividing patients into categories and streamlining/standardizing the care path per category or on involving personnel, including specialists, from other departments when ED crowding occurs. Regarding output, suggested solutions are: the floating patient method (Elalouf & Wachtel, 2015, 2016; Wachtel & Elalouf, 2017), transferring patients to other hospitals when peak-hours are not coinciding (Nezamoddini & Khasawneh, 2016), and transferring non-emergency patients to other hospitals to reduce waiting time and resources needed (Nezamoddini & Khasawneh, 2016). When using the floating patient method, triage can send some patients directly to a ward, instead of having them be examined at the ED first. The projects described in ROAZ (2016) often focus on rehabilitation and preventing rehospitalisation of elderly. One project aims to start the dismissal procedure as early as possible, to allow more time for planning hospitalization if needed. Another project suggests having specialists in the ED. Due to specialist treatment in the ED and their
expertise, the amount of hospitalizations is reduced. Since hospitalization takes longer and provides more tasks than releasing the patient to go home, this option is logistically preferable.
3.5.2 Reducing LOS/waiting times
To reduce LOS, Uriarte et al. (2017) use DES to determine the optimal number of resources and the required level of improvement in key processes for the studied ED. Amaral and Costa (2014) suggest to temporarily reallocate staff during peak-hours using PROMETHEE II as a decision making tool, while Yang et al. (2016) consider different triage strategies. They conclude that a shared lab with triage personnel taking blood samples is the most efficient. Oh et al. (2016) also focus on external processes. They suggest more efficient lab testing and radiology testing protocols.
25
3.6 Conclusion theoretical framework
26
Chapter 4
–
Data analysis
In this chapter the results of the crowding score measurements and the linear regression models are discussed. In Section 4.1 the crowding score measurements are presented, in Section 4.2 linear regression is applied to identify causes of crowding based on the measurement results, whereas in Section 4.3 this method is used to predict crowding. The data analysis used to update the input parameters of the simulation model is discussed in Section 5.2.
4.1 Crowding score measurements
Since literature does not provide a single conclusive answer to when an ED is crowded, and neither does the personnel, we decided to measure crowding in terms of a crowding score given by personnel over a period of three months. Crowding scores are given four times per day. A shorter interval would be preferred; however, this would interfere too much with patient care. Every day part all working personnel are asked to score the average crowding of that day part on a scale from 1 (very quiet) to 7 (severely crowded). The chosen day parts are morning (7:15-11:00), afternoon (11:00-15:30), early evening (15:30-20:00) and late evening (20:00-0:00), based on a combination of staff shifts (it is less intrusive to vote during a break or at the end of a shift) and the times at which staff indicates a significant change in crowding. The night (0:00 – 7:15) is not considered, as both the patient arrivals and the patient care path differ from the other periods, making them hard to
compare.
Since the crowding score measurements are, by nature, subjective, only the average is used to reduce personal influence of the raters. As can be seen in Table 9 both the separate categories and all individual scores together show a high internal consistency, meaning that the average of the scores is a good representation of the individual scores. An internal consistency test is chosen instead of an inter-rater reliability test, since the raters differ for each shift. Only measurements of periods with more than 20% response are taken into account, eliminating approximately 1% of the measurement data. The average response rate is 48%, with a higher response rate during the day compared to the evening votes.
Table 9 Cronbach's alpha of measurement scores per personnel type
Cronbach’s alpha
Before April
After April
All scores 0,96 0,95
PA/VS 0,90 0,86
EDspec+EDresidents 0,87 0,84
sec/HCass 0,91 0,84
nurses 0,97 0,96
Nurses B-unit - 0,91
27 The average crowding score per day (Figure 8), does not correspond to the perception of personnel that Monday and Friday are significantly more crowded. This could be explained by the fact that in anticipation of the extra patients, there is an extra ED-specialist/resident shift on those days. Besides this, personnel agree that crowding is caused by a combination of factors, including but not limited to the number of patients (see Section 6.1).
Table 10 Average crowding score per day part
Figure 8 Average crowing score per day
Figure 9 shows the average crowding score per personnel type, while Table 11 shows the t-test results. There is no significant difference between the ED specialist/resident and the nurses (of either unit). The PA/NP has a significantly lower average crowding score while the logistic nurse scores slightly higher. This could (partially) be explained by the fact that the PA has a lot of tasks not related to patients. The support personnel do score lower on average, but not significantly. This is likely because their response peaked at different moments than that of the other categories, making their average score representative of a different set of measurements.
Figure 9 Average crowding score per personnel type
0,0 1,0 2,0 3,0 4,0 5,0 6,0 7,0
Average crowding score
Day part Avg crowding score
Morning 3,5
Afternoon 4,7
Early evening 4,5
Late evening 4,4
Average 4,2
1,0 2,0 3,0 4,0 5,0 6,0 7,0
28
Table 11 p-values of t-test between average crowding scores of different personnel types
PA/NP
ED specialist
sec/helathc-ass
logistic nurse
Triage
nurse nurse
nurse B-unit
PA/NP - 0,003 0,000 0,000 0,386 0,003 0,005
ED specialist 0,003 - 0,265 0,024 0,658 0,961 0,888
sec/helathc-ass 0,000 0,265 - 0,003 0,969 0,578 0,642
logistic nurse 0,000 0,024 0,003 - 0,032 0,010 0,088
Triage nurse 0,386 0,658 0,969 0,032 - 0,643 0,570
nurse 0,003 0,961 0,578 0,010 0,643 - 0,407
nurse B-unit 0,005 0,888 0,642 0,088 0,570 0,407 -
4.2 Crowding indicators
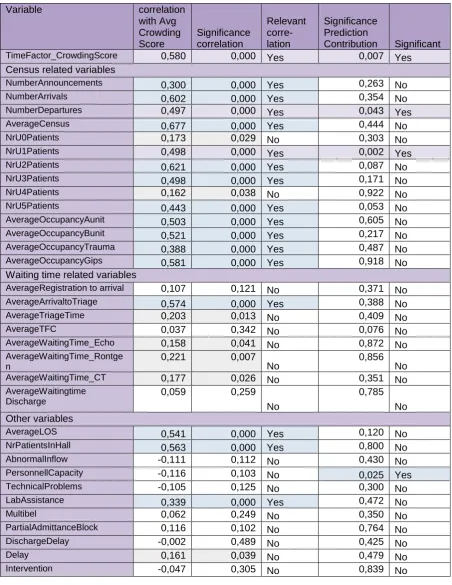
Since crowding is subjective, it is useful to find objective indicators to assess crowding. Table 12 shows the potential indicators considered, their correlation to the average crowding score as well as whether the variable has significant predictive value.
The indicators with relevant correlation (correlation > 0,3 and significance < 0,05) can be grouped as a time factor, indicators related to the census (number of patients), LOS, start-triage time and lab assistance. Interesting is that though LOS is significantly correlated to the crowding score, most waiting times and delays are less significantly correlated and have a lower correlation in general, except for time to triage. This enforces the importance of the KPI indicated by Reinders (2012): percentage of patients that started triage within 5 minutes of arrival. However, as mentioned in Section 2.2, the situation after April has a lower percentage of patients which started triage on time, but also a lower LOS. Since the LOS describes the entire patient-care path while the time to triage describes only a small part which is also included in LOS, LOS is preferred as KPI over time to triage. This is consistent with literature, in which census or LOS (or related indicators such as occupancy or waiting times) are often used crowding indicators (see Section 3.2).
29
Table 12 Variables in relation to the crowding score - correlation and predictive value
Variable correlation
with Avg Crowding Score
Significance correlation
Relevant corre- lation
Significance Prediction
Contribution Significant
TimeFactor_CrowdingScore 0,580 0,000 Yes 0,007 Yes
Census related variables
NumberAnnouncements 0,300 0,000 Yes 0,263 No
NumberArrivals 0,602 0,000 Yes 0,354 No
NumberDepartures 0,497 0,000 Yes 0,043 Yes
AverageCensus 0,677 0,000 Yes 0,444 No
NrU0Patients 0,173 0,029 No 0,303 No
NrU1Patients 0,498 0,000 Yes 0,002 Yes
NrU2Patients 0,621 0,000 Yes 0,087 No
NrU3Patients 0,498 0,000 Yes 0,171 No
NrU4Patients 0,162 0,038 No 0,922 No
NrU5Patients 0,443 0,000 Yes 0,053 No
AverageOccupancyAunit 0,503 0,000 Yes 0,605 No
AverageOccupancyBunit 0,521 0,000 Yes 0,217 No
AverageOccupancyTrauma 0,388 0,000 Yes 0,487 No
AverageOccupancyGips 0,581 0,000 Yes 0,918 No
Waiting time related variables
AverageRegistration to arrival 0,107 0,121 No 0,371 No
AverageArrivaltoTriage 0,574 0,000 Yes 0,388 No
AverageTriageTime 0,203 0,013 No 0,409 No
AverageTFC 0,037 0,342 No 0,076 No
AverageWaitingTime_Echo 0,158 0,041 No 0,872 No
AverageWaitingTime_Rontge n
0,221 0,007
No 0,856 No
AverageWaitingTime_CT 0,177 0,026 No 0,351 No
AverageWaitingtime Discharge
0,059 0,259
No
0,785 No Other variables
AverageLOS 0,541 0,000 Yes 0,120 No
NrPatientsInHall 0,563 0,000 Yes 0,800 No
AbnormalInflow -0,111 0,112 No 0,430 No
PersonnellCapacity -0,116 0,103 No 0,025 Yes
TechnicalProblems -0,105 0,125 No 0,300 No
LabAssistance 0,339 0,000 Yes 0,472 No
Multibel 0,062 0,249 No 0,350 No
PartialAdmittanceBlock 0,116 0,102 No 0,764 No
DischargeDelay -0,002 0,489 No 0,425 No
Delay 0,161 0,039 No 0,479 No
30 There are three variables that are both significantly correlated with the average crowding score as well as have significant predictive value when all variables are taken into account. Note that this does not mean that other variables may not have a significant predictive value in other models with a different set of independent variables, as multicollinearity and a causal relation between the variables may cause the predictive value of a variable to reduce (see Appendix B). It does, however, indicate that of all these variables, the time-factor, number of departures and number of urgency 1 patients have the strongest predictive value. When reducing the input variables to only the variables with relevant correlation, LOS and time to triage also have significant predictive value (this can be explained by multicollinearity or inter-IV causality, see Appendix B).
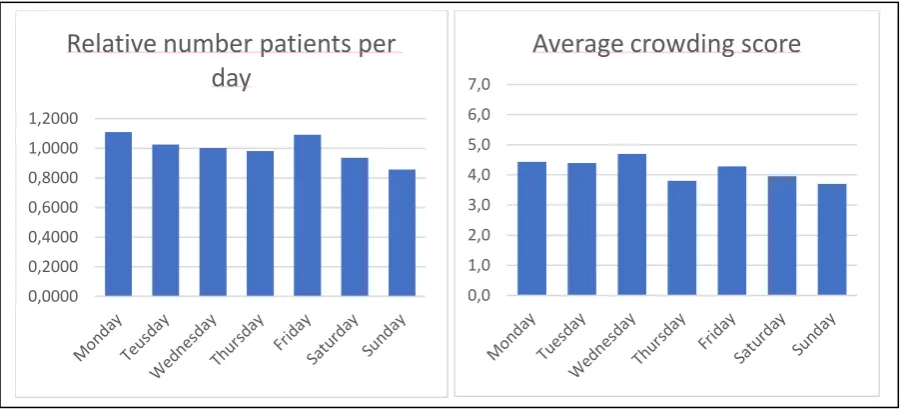
The time-factor is defined as the average crowding score of each day-day part combination (e.g., Monday morning), see next section. Wednesday is on average slightly more crowded while Thursday, Saturday and Sunday are less crowded (Figure 10). The number of patients is lower during the weekends, as well as on Thursday, which is the day on which an external party sees orthopedic patients, part of which go there instead of to the ED. Similarly, personnel experience the mornings as less crowded (see previous section), which corresponds to the relatively low number of patients during this time (see Figure 10). This does not, however, account for the relatively high score of the late shift (see Table 10), nor for the fact that the census (number of patients present in the system) has a significant correlation but not a significant predictive value. Personnel agrees that the absolute number of patients is not a direct cause of crowding, but rather the combination of the number of patients and their care-intensity relative to the personnel capacity. This corresponds to the high predictive value of U1 patients.
confidential
Figure 11 Number of patients per hour - weekday after April 0,0000
0,2000 0,4000 0,6000 0,8000 1,0000 1,2000
Relative number patients per
day
0,0 1,0 2,0 3,0 4,0 5,0 6,0 7,0
[image:31.595.72.528.395.601.2]Average crowding score
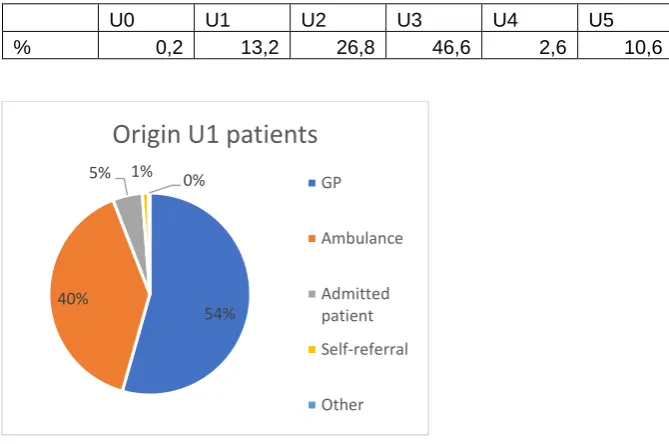
31 Though the number of patients of each urgency level correlates significantly with the crowding score, only the amount of U1 patients provides significant predictive value. Personnel explains this by the care-intensity associated with these patients. Some of these patients need constant care and prevent personnel from visiting other patients. Besides this, U1 patients often arrive by ambulance (Figure 12). Ambulance arrivals can be experienced as process-disturbing, especially if multiple ambulances arrive in close succession. Following the assumption that the lower the urgency category (higher urgency) the higher the intensity of care, which leads to more crowding, and are more likely to arrive by ambulance, which can disturb the system, one would expect the number of U0 patients to have a significant predictive value. When a U0 patient enters the system, this does have a big impact since it requires a lot of resources. As can be seen in Table 13 however, the U0 patients only account for 0,2% of the total number of patients, which decreases their impact when summarizing data.
Table 13 Patient urgency ratio in percentages
U0 U1 U2 U3 U4 U5
% 0,2 13,2 26,8 46,6 2,6 10,6
Figure 12 Origin of U1 patients
54% 40%
5% 1% 0%
Origin U1 patients
GP
Ambulance
Admitted patient Self-referral
32 The number of departures also has both significant correlation and significant predictive value. Personnel suggests this is mostly due to the extra nurse tasks when multiple patients are discharged in quick succession. Once the test results are in, the ED specialist or resident can determine a policy for a patient. This policy leads to tasks for the nursing staff, after which the patient can leave the ED. If a lot of patients are released around the same time, the number of tasks increases as well, leading to perceived crowding.
Both census and LOS correlate significantly with the crowding score and are often used in literature as KPIs for ED crowding. Since these two variables are more objective, the same model has been run with both these variables as dependent variable as well. When predicting the LOS, number of departures and number of U1 patients are also important predictors (see Appendix D). Besides this, the number of arrivals and the number of U2 patients are important when predicting LOS. The reasoning behind the importance of the number of U2 patients is similar to the reasoning behind the importance of the number of U1 patients. The number of arrivals and average census are alternately significant predictors, depending on the other variables included in the model, indicating that the number of patients in the system affects the LOS, which is not surprising. Of the waiting times, only the time of x-ray test-results is a significant predictor, indicating that if one attempts to improve waiting times, looking into the x-ray tests is a good place to start. When predicting census, only lab assistance is an important predictor besides occupancy variables (which are directly related to the number of patients, thus cannot be counted as causes) (Appendix E). Again, lab assistance is a result, not a cause of crowding.
Besides marking some good indicators for crowding, the analysis also (partially) disproved some of the personnel’s expectations. Personnel expected both the inflow and waiting times to have a bigger effect on the crowding score. Besides this, personnel experiences crowding around 11:00 and 17:00 and partially attributes this to an increased inflow of GP patients. Figure 13 shows that though there is a higher inflow of GP patients during office hours in general, there are no extreme peaks around 11:00 or 17:00. Furthermore, personnel expected longer pick-up times (time between being marked ready to leave the ED and leaving the ED by being picked-up by ward nurses) to increase crowding. They perceive the average pick-up times to be long, which is confirmed by the data (Table 14), which indicates an average pick-up time of 42 minutes. However, waiting time to discharge has no significant correlation or predictive value, and there seems to be no clear peaks in pick-up time during the expected hours (lunch-time and around 17:00) (Figure 14). The peaks which do show, might be caused by the shift-changes that occur around those times (the transition moments between weekday and weekend shifts).
Figure 13 relative* GP arrivals per hour (* total sums to 100%) 0,0
2,0 4,0 6,0 8,0 10,0 12,0
1 2 3 4 5 6 7 8 9 10 11 12 13 14 15 16 17 18 19 20 21 22 23 24
Relative percentage (Indirect) GP arrivals
per hour - weekdays
33
confidential
Figure 14 Average pick-up time per hour - after April
Table 14 Average pick-up time for the wards which more than 10% of ED patients go to
confidential
The data, combined with literature, suggest using either census/occupancy or LOS as KPI. Both have a significant correlation with the crowding score, but only LOS has significant predictive value, making LOS a logical choice. The A-unit and B-unit are partially independent systems. Therefore, besides the overall average LOS, the average LOS of the A-unit and B-unit separately will also be used as KPI. Since the B-unit is not ‘open’ 24/7, as opposed to the A-unit, the separate LOS for A and B-unit will only be measured when the B-unit is open to enable better comparison between the two.
4.3 Prediction of ED crowding
As found in Chapter 2, formula-based methods and statistical analysis (regression based and time-series analysis) are preferred and used in practice when predicting ED crowding. Statistical analysis provides a higher quality prediction, with the choice between linear regression and time-series models depending on the available data. In this case a regression-based approach is most suitable due to the available data.
Due to the low predictive value of the crowding score prediction model and potential weaknesses of the measurement data, the two most commonly found crowding indicators, LOS and occupancy, are also used as dependent variable.
4.3.1 Method
34 Steps taken to create linear regression models:
1) Run model with all variables.
2) Discard all variables that do not have a significant correlation (significance < 0,05) with the dependent variable.
3) Stepwise discard all variables that do not have significant predictive value (significance < 0,05), starting with the variable with the worst predictive value, and all variables with multicollinearity (keep the one(s) with the highest correlation with the dependent variable), taking into account the (linearity) assumption tests of all models (removing variables may lead to a less reliable model in terms of assumption testing, see Appendix B).
4) Try different models with different combination of variables which have significant correlation, taking into account multicollinearity.
5) If adjusted R-square is above 0,7 the model is reliable enough to use in practice. 6) Repeat the process using time-step data (e.g., values from x hours in the past). The models, their results and the results of the assumption tests can be found in Appendix C (crowding score models), D (LOS models) and E (census models). An explanation of the assumption tests performed, multicollinearity and causality can be found in Appendix B. The results of the assumption tests can be summarized as follows; none of the dependent variables are normally distributed, meaning the corrected R2 value will be used for all of them. All models have positive
ANOVA, Cooks distance and P-P plot results. None of the dependent variables is normally distributed, therefore the adjusted/corrected R2 value is used for all models. RSR and RSP
scatterplots of the crowding score and LOS models all have random patterns. As discussed in linear relations (Appendix B), the scatterplots of the census models have a somewhat unbalanced x-axis, probably due to the fact that most of the variables are not normally distributed. The transformations used did not improve the model. If other IVs are added or transformations are found which create normal distributions for one or more variables, this might improve the census models.
4.3.2 Prediction model results
The highest obtained corrected R2 values per dependent variable are shown in Table 15. This result is
reached when using data from the same point in time of all variables. Take into account that most of the independent variables in these models do not have significant predictive value, meaning that the model is overfit, and performance will decrease when pruning the model until it only has significant variables. Besides this, using all variables makes the measurement/IV ratio very low, which is bad for the reliability of the model, further indicating that it is wise to prune the model to contain less IVs, which will generally reduce the R2 value.
Table 15 Maximal achieved predicted value per dependent variable
KPI Max achieved predictive value (corrected R2)
Crowding score 0,619
LOS 0,660
35 With a maximum predictive value of 0,619, the prediction of the average crowding score is not good enough for practical use. This could be because not all causational variables are included in the model, because the measurements are inaccurate, or a combination of both. Personnel indicate that co-morbidity, personality of the patient, and the amount of family which comes with/to visit the patient influence the amount of care a patient needs, mainly for the nurses and supporting personnel. It might be possible to include co-morbidity, but personality factors and family are hard to objectively measure and predict. Besides this, the assumption that care intensity is related to the triage urgency of the patient is confirmed, but not fully explanatory. This may be better explained by using DBC codes instead of urgency, the disadvantage of this method is the decrease in sample size of each category. Weaknesses of the measurements are their subjectivity and time-step, a smaller time-step would make the model more sensitive to variation whereas data is now generalized over a period of 4,5 hours.
Comparable to the crowding score prediction, with a maximum predictive value of 0,660, average LOS cannot be explained or predicted, using these variables. Again, this result may improve by decreasing the time-step of the measurements (e.g., collecting data every hour rather than every day part) or by adding variables.
Since the prediction model of the average census per time period scored above 0,7, a model per hour was established, increasing the maximum corrected R2 to 0,926, which is very good. Accessibility of
data is one of the considerations when establishing this model, which is why linear regression was chosen over time-series analysis in the first place. Therefore, the census prediction is solely based on census data, which is relatively easily acquired. As most of the significantly correlated and predictive variables are census variables, this barely effects the performance of the models. Since the performance of the initial model is very good, time-step prediction models of 1 to 6 hours into the future were established. 92,5 % of the variation in the total number of patients can be explained and predicted by the number of patients 1 hour previous which is very good, for 2-hour predictions this percentage is 83,1% which is good. From 3 hours onwards, the predictive value varies between 73 to 71% which is still considered reasonable.