http://wrap.warwick.ac.uk
Original citation:
Rajpoot, Nasir M. (Nasir Mahmood) (2003) Local discriminant wavelet packet basis for texture classification. In: Wavelets - Applications in Signal and Image Processing X Conference, San Diego, CA, 04-08 Aug 2003. Published in: Wavelets: Applications in Signal and Image Processing X. SPIE Proceedings, Volume 5207 (Part 1&2). pp. 774-783
Permanent WRAP url:
http://wrap.warwick.ac.uk/7673
Copyright and reuse:
The Warwick Research Archive Portal (WRAP) makes this work by researchers of the University of Warwick available open access under the following conditions. Copyright © and all moral rights to the version of the paper presented here belong to the individual author(s) and/or other copyright owners. To the extent reasonable and practicable the material made available in WRAP has been checked for eligibility before being made available.
Copies of full items can be used for personal research or study, educational, or not-for profit purposes without prior permission or charge. Provided that the authors, title and full bibliographic details are credited, a hyperlink and/or URL is given for the original metadata page and the content is not changed in any way.
Publisher’s statement:
Copyright SPIE (2003) Society of Photo-Optical Instrumentation Engineers. One print or electronic copy may be made for personal use only. Systematic reproduction and distribution, duplication of any material in this paper for a fee or for commercial purposes, or modification of the content of the paper are prohibited.
DOI abstract link: http://dx.doi.org/10.1117/12.507681
A note on versions:
The version presented here may differ from the published version or, version of record, if you wish to cite this item you are advised to consult the publisher’s version. Please see the ‘permanent WRAP url’ above for details on accessing the published version and note that access may require a subscription.
Local Discriminant Wavelet Packet Basis
for Texture Classification
Nasir Rajpoot
Department of Computer Science
University of Warwick
Coventry CV4 7AL
United Kingdom
[email protected]
Abstract
1
Introduction
Texture classification can be defined as a mapping from a set of input image pixels to a set of class labels. Finding appropriate features from an image containing texture regions is key to utilising textural properties which can differentiate between different textures well. Recently, subband filtering methods have been shown [10] to be quite effective in characterising different types of textures. Out of these methods, some have employed wavelet bases, fixed dyadic wavelet basis [7] as well as adaptive wavelet packet basis [1, 3], to represent the image in such a way that discriminant features of underlying textures are highlighted. A major limitation of wavelet representation, however, is that only a restricted subset of possible space-frequency tilings is used to extract spatial frequency components present in the image. Wavelet packets provide a solution to this problem so that adaptive frequency segmentation can be found for a given image based on a specific criterion or a cost function.
In the context of texture classification, the cost function used to find the best wavelet packet basis should be able to provide an estimate of the discrimination power of a subband. Only then can it be ensured that the resulting basis will be an optimal choice from a library of available bases. Chang and Kuo [3] suggested using
l1-norm as a cost function for tree prunning in a top-down manner. A subband is
further decomposed only if its l1-norm is larger than a factor of the maximum norm
value at the same resolution. This approach leads to an adaptive tree-structured wavelet decomposition, a term the authors of [3] used for wavelet packet decomposi-tion. Acharyya and Kundu [1] employ an energy based cost function and a top-down search without any decimation to compute the basis wavelet packet basis for texture segmentation. It is to be noted, however, that a top-down search method employed in a best basis selection algorithm cannot guarantee an optimal solution. Laine and Fan [6] used energies of subbands from the full wavelet packet tree as a signature for images belonging to certain texture class.
Thelocal discriminant basis(LDB) of Saito & Coifman [12] proposed to use a cost function which can maximise the differences in time-frequency energy distributions of each class. Symmetric Kullback-Leibler (KL) distance was used to measure the dissimilarity between energy distributions of a particular subband for all classes. An-other related work is the local clustering basis(LCB) of Meyer & Chinrungrueng [8], wherein the authors select basis functions according to their ability to separate the fMRI time-series into activated and non-activated clusters. Locally clustering basis functions are chosen due to their discriminating power, and projections of the raw fMRI data onto these basis functions are computed for efficient segmentation of the data into activated and non-activated regions.
discrimi-nant features is chosen using the discriminating power of a subband (feature) to avoid the so-called curse of dimensionality.
The paper is organised as follows. An overview of wavelets and wavelet packets for texture analysis is provided in the next section. Algorithm for local discriminant basis selection alongwith a description of four different cost functions is provided in Section 3. Experimental settings and results are presented in Section 4 and the paper concludes with remarks on the results and further directions for research.
2
Wavelet Packets
2.1
Introduction
As opposed to Fourier basis functions, the principle behind wavelets is that shifts and dilations of a prototype functionψ(t) are chosen as basis functions, decomposing the signal into its components belonging to different frequencies while providing good localization in time (space) at the same time. The discrete wavelet transform can be computed with the help of filter banks that decompose the signal (image) into low and high frequency subbands. The low frequency subband is further decomposed in order to go down the transform one more level. Wavelet based texture classification methods use the wavelet subbands to extract textural features – see [7, 10] for a review of these methods. Contributions of each subband to the image (ie, frequency components of the image corresponding to that subband) are usually passed through a nonlinearity followed by a smoothing function to compute a feature image.
2.2
Wavelet Packet Decomposition
A more general form of the wavelet basis, known as thewavelet packet basis[4] adap-tively segments the frequency axis based on a certain cost function. The frequency intervals of varying bandwidths are adaptively selected to extract specific frequency contents present in the given signal. This frequency segmentation is useful, for exam-ple, to analyze a local phenomenon occurring in the signal and belonging to a specific frequency band. The discrete wavelet packet transform of a 1-d discrete signalx=xi,
i = 0,1, . . . , N −1 can be computed as follows. The wavelet packet coefficients are defined as
w0
0(l) = xl l= 0, . . . , N −1
w2jp(l) = X
k
gk−2l w n
j−1(k) l= 0, . . . , N2
−j−1
w2jp+1(l) = X
k
hk−2l w n
j−1(k) l= 0, . . . , N2
−j−1
(1)
where j = 1,2, . . . , J; J = log2N, w p
j(l) is the transform coefficient corresponding
to the wavelet packet function which has relative support size 2j, frequency p2j and
is located at l2j. In other words, j, p and l can be regarded as the scale, frequency
for a two-channel filter bank and the transform is invertible if appropriate dual fil-ters {˜hn}, {g˜n} are used on the synthesis side. When comparing to the wavelet
decomposition, it can be regarded as a decomposition which lifts the limit of only decomposing the lowpass filtered signal so that all the highpass subbands can be fur-ther decomposed as well. This results in a combinatorial explosion of possible bases which to select a suitable basis from. Since this library of available bases provides an overcomplete representation, a fast optimization algorithm such as [5] is required to select a combination of bases from this library which is well suited to the signal under consideration.
2.3
Wavelet Packet Texture Analysis
In the case of general wavelet packet decomposition, a basis needs to be selected which has the maximum discriminating power among all possible bases in the library of wavelet packets. Although this adds an extra computational cost, a fast dynamic programming algorithm can be used to select an optimal basis. Apart from this, texture classification using wavelet packet subbands may proceed in almost the same way a system based on wavelet subbands works, as described in Section 2.1.
3
Local Discriminant Basis
Coifman & Wickerhauser [5] proposed to use a dynamic programming approach to select the best wavelet packet basis functions that can compactly represent a given signal. To achieve the goal of signal compression, they proposed entropy based cost functions to estimate the information contents of a subband. A subband is preferred on its child subbands if its entropy is less than sum of that of all its child subbands. However, this has little relevance to texture classification as smaller entropy of a subband does not necessarily mean that the subband will prove to be efficient for separating pixels belonging to different classes of textures.
Considering a certain wavelet packet subband for two types of textures as two space-frequency energy distributions, one way of computing the discriminating power of that subband is to find how dissimilar these distributions are. Distance measures for probability distributions can then be used on psuedo-distributions yielding a measure of discrimination power. LetF andGdenote the transform coefficients of a particular subband for training images x1 and x2, belonging to two different texture classes,
respectively. We considered three ways of forming pseudo-distributions f from the subband coefficients F:
f1(x, y) =F(x, y), f2(x, y) = |F(x, y)| 2
, f3(x, y) =|F(x, y)| 2
/kx1k 2
(2)
Similarly, the pseudo-distributions gi (i= 1,2,3) can be obtained by using the
sub-band coefficients G(x, y) and texture image x2. We tested four cost functions in
divergence, Euclidean distance (ED), and Hellinger distance (HD) – denoted respec-tively by KLi, JSi, EDi, and HDi – defined as follows.
KLi(F, G) =D(fi||gi) +D(gi||fi), (3)
JSi(F, G) =
D(fi||figi) +D(gi||figi)
2 (4)
EDi(F, G) =kfi−gik2 (5)
HDi(F, G) =
s X x X y hp
fi(x, y)−
p
gi(x, y)
i2
(6)
where
D(f||g) = X
x
X
y
f(x, y) logf(x, y)
g(x, y) is the relative entropy between f and g,
figi(x, y) =
fi(x, y) +gi(x, y)
2
is the average distribution ∀x, y, k·k2 denotes the l2-norm, and µ(f) and σ2(f)
re-spectively are the mean and variance of f.
Algorithm:
Let C(x1,x2,B) denote the cost function, one of the above four, representing the
discriminating power of a basis B in terms of its capability to separate x1 and x2.
Let Bp,qj denote the wavelet packet basis for a node λ p,q
j of the full wavelet packet
tree and letOj2+1p,2q,O 2p,2q+1 j+1 , O
2p+1,2q
j+1 , andO
2p+1,2q+1
j+1 denote the wavelet packet bases
corresponding to four children of the node λp,qj . The best wavelet packet basis up to a depth J, where J = log2N and N is the number of pixels in each dimension, for
texture classification is selected as follows.
1. Compute the J-level full wavelet packet tree decomposition. 2. Initialize j←−J−1.
3. For all 0≤p<2j, 0≤q<2j, do the following:
(a) If C(x1,x2,B p,q
j )> [C(x1,x2,O 2p,2q
j+1 ) +C(x1,x2,O 2p,2q+1 j+1 )+ C(x1,x2,O
2p+1,2q
j+1 ) +C(x1,x2,O
2p+1,2q+1 j+1 )].
keep the four child subbands at depth j+ 1,
otherwise
merge them to get λp,qj . 3. Decrement j by 1.
4. If j <0, then stop, otherwise go to step 3.
4
Feature Selection
The issue of selection of features from subband decomposition demands more scrutiny now due to a large number of possible bases that can be used to represent the image. Let us define the feature selection problem in the context of subband decomposition as follows. Given a test image xthat has been decomposed into n subbands, each of which can be regarded as a feature, the goal is to select m subbands such that the resulting misclassification error is minimal. We have shown that it is still possible to gauge the discrimination power of a subband independent of the classifier. Given the nature of subband decompositions under consideration, a subband can be regarded as being highly discriminant if it highlights the frequency characteristics of one class but not the other. In other words, if the coefficients of a particular subband light up (ie, are higher in magnitude) for one class but are relatively insignificant for another one, the subband can prove to be helpful in terms of classification performance.
In our previous work [9], we have proposed to use a symmetric KL distance be-tween the normalised energies of a subband of training images as a measure of rel-evance of an estimate of the discrimination power of the subband. However, Saito et al. [11] warn that the approach of sequentially measuring the efficacy of each di-mension of the feature space independently may be “too greedy” as 2D and higher dimensional structures in the feature space may be missed. The principal advantage, however, is that we can make a feature selection solely on training data which re-duces the complexity of the final classifier on test samples. When compared with traditional multivariate feature projection methods like PCA or LDA, this advantage is significant.
Once it has been ensured that the basis chosen to represent the image is optimal for texture classification, selection of most discriminant subbands (features) can proceed by using the cost function as a measure of relevance of a feature to classification. Thus cost function values need to be computed only once to be used for basis selection and subsequent feature selection follows by ranking the features according to these values, an approach proposed in [2], saving computations if basis selection and feature selection were done separately.
5
Experimental Results
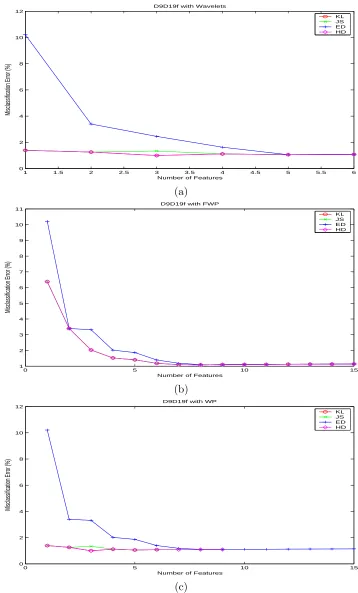
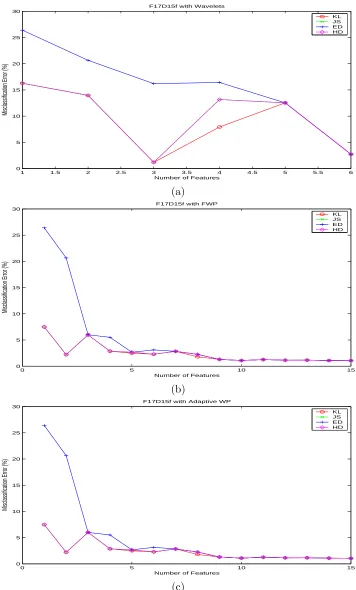
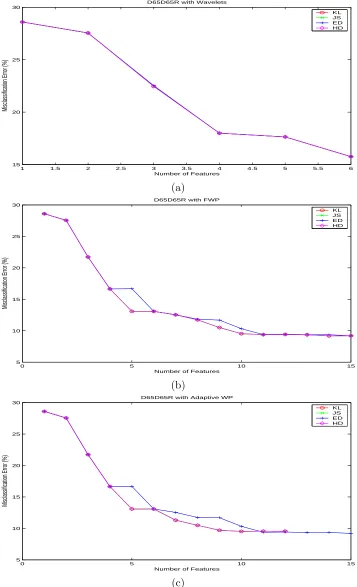
many applications. While these results may provide some indication as to which of the four cost functions performs better for a certain type of texture, it is perhaps due to the limited number of experiments that no firm conclusions may be drawn in this regard.
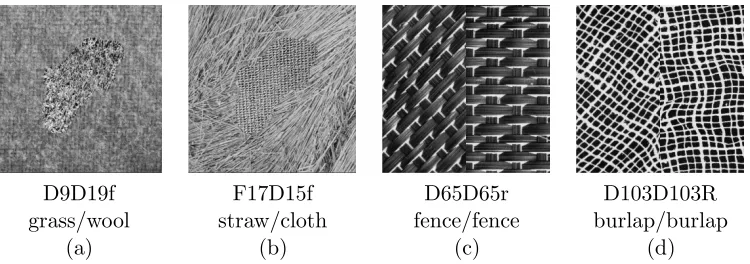
D9D19f F17D15f D65D65r D103D103R
grass/wool straw/cloth fence/fence burlap/burlap
[image:8.595.103.478.179.311.2](a) (b) (c) (d)
Figure 1: Test images created from Brodatz collection
6
Conclusions
In this paper, we proposed a fast algorithm for local discriminant basis selection from a library of wavelet packet functions for texture classification. The use of a cost function suitable for measuring the discriminating power of a subband was advocated and four such cost functions were studied. Once the basis is selected, corresponding features can be ranked based on their cost function values. Experiments were restricted to a two-class classification problem. Future research directions include extension of this algorithm to a multi-class problem and incorporation of a sophisticated classifier.
References
[1] M. Acharyya and M.K. Kundu. Adaptive basis selection for multi texture seg-mentation bym-band wavelet packet frames. InProc. IEEE Intl. Conf. on Image Proc., Oct. 2001.
[2] A.H. Bhalerao and N.M. Rajpoot. Discriminant Feature Selection for Texture Classification. In Proc. British Machine Vision Conference (BMVC’2003), Sep. 2003.
[3] T. Chang and C.C.J. Kuo. Texture analysis and classification with tree-structured wavelet transform. IEEE Trans. on Image Processing, 2, 4:429–441, 1993.
[5] R.R. Coifman and M.V. Wickerhauser. Entropy-based algorithms for best basis selection. IEEE Trans. on Info. Th., 38(2):713–718, Mar. 1992.
[6] A. Laine and J. Fan. Texture classification by wavelet packet signatures. IEEE Trans. on PAMI, 15)(11):1186–1190, 1993.
[7] S. Livens, P. Scheunders, G. Van de Wouwer, and D. Van Dyck. Wavelets for texture analysis. In Proc. IEE Conf. on Image Proc. and Its Applications, July 1997.
[8] F.G. Meyer and J. Chinrunreung. Analysis of event-related fmri data using local clustering bases. IEEE Trans. on Medical Imaging, 2003. to appear.
[9] N.M. Rajpoot. Texture Classification Using Discriminant Wavelet Packet Sub-bands. In Proc. IEEE Midwest Syposium on Circuits and Systems, Aug. 2002.
[10] T. Randen and J.H. Husoy. Filtering for texture classification: A comparative study. IEEE Trans. on PAMI, 21(4), April 1999.
[11] N. Saito, R. Coifman, F. B. Geshwind, and F. Warner. Discriminant Feature Extraction Using Empirical Probability Density Estimation and a Local Basis Library. Pattern Recognition, 35:2841–2852, 2002.
1 1.5 2 2.5 3 3.5 4 4.5 5 5.5 6 0
2 4 6 8 10 12
D9D19f with Wavelets
Number of Features
Misclassification Error (%)
KL JS ED HD
(a)
0 5 10 15
1 2 3 4 5 6 7 8 9 10 11
D9D19f with FWP
Number of Features
Misclassification Error (%)
KL JS ED HD
(b)
0 5 10 15
0 2 4 6 8 10 12
D9D19f with WP
Number of Features
Misclassification Error (%)
KL JS ED HD
[image:10.595.107.465.117.710.2](c)
Figure 2: Classification results for D9D19f
1 1.5 2 2.5 3 3.5 4 4.5 5 5.5 6 0
5 10 15 20 25 30
F17D15f with Wavelets
Number of Features
Misclassification Error (%)
KL JS ED HD
(a)
0 5 10 15
0 5 10 15 20 25 30
F17D15f with FWP
Number of Features
Misclassification Error (%)
KL JS ED HD
(b)
0 5 10 15
0 5 10 15 20 25 30
F17D15f with Adaptive WP
Number of Features
Misclassification Error (%)
KL JS ED HD
[image:11.595.110.466.117.707.2](c)
Figure 3: Classification results for F17D15f
1 1.5 2 2.5 3 3.5 4 4.5 5 5.5 6 15
20 25 30
D65D65R with Wavelets
Number of Features
Misclassification Error (%)
KL JS ED HD
(a)
0 5 10 15
5 10 15 20 25 30
D65D65R with FWP
Number of Features
Misclassification Error (%)
KL JS ED HD
(b)
0 5 10 15
5 10 15 20 25 30
D65D65R with Adaptive WP
Number of Features
Misclassification Error (%)
KL JS ED HD
[image:12.595.110.467.121.708.2](c)
Figure 4: Classification results for D65D65R
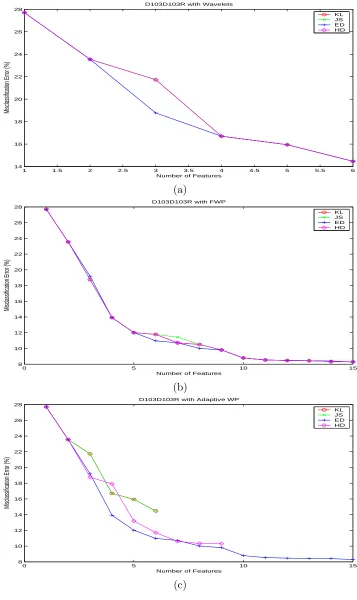
1 1.5 2 2.5 3 3.5 4 4.5 5 5.5 6 14
16 18 20 22 24 26 28
D103D103R with Wavelets
Number of Features
Misclassification Error (%)
KL JS ED HD
(a)
0 5 10 15
8 10 12 14 16 18 20 22 24 26 28
D103D103R with FWP
Number of Features
Misclassification Error (%)
KL JS ED HD
(b)
0 5 10 15
8 10 12 14 16 18 20 22 24 26 28
D103D103R with Adaptive WP
Number of Features
Misclassification Error (%)
KL JS ED HD
[image:13.595.108.465.119.719.2](c)
Figure 5: Classification results for D103D103R