MASTER THESIS
TOWARDS A HYBRID CUSTOMER CLASSIFICATION
AND CLUSTERING SCHEME FOR EFFECTIVE
TARGET-GROUP BASED MARKETING
Amit Das
FACULTY
Faculty of Electrical Engineering, Mathematics & Computer Science
STUDY PROGRAMME
Master’s in Business Information Technology
GRADUATION COMMITTEE
Dr. Maya Daneva, Assistant Professor, University of Twente. Dr. Adina Aldea, Assistant Professor, University of Twente
COMPANY SUPERVISORS
Christian Vonk (La Place) Dr. Felix Janszen (E-Tail Genius)
1
Preface
The last 21 months of my life have been memorable. Right from the time I moved to the Netherlands to pursue my Masters’ at the University of Twente, life has taught me a lot. A new country, diverse people from different nationalities and culture, different work ethics, and much more. I started studying at the University of Twente and I am very glad that I chose this university. This university has given me the opportunity to grow as a person, both personally and professionally. Right from completing my courses in the 1st year of Masters’, working part time
at the University with Career Services and then moving to Utrecht to conduct my Master thesis at La Place, it has been an eventful phase of life. I have probably learned more in this phase of life than I can otherwise recall. With mixed emotions, I am towards the completion of this phase of my life which concludes with the completion of my Master thesis.
I would like to take this opportunity to thank a few people and show my gratitude towards them, without whom this phase would have been incomplete. Firstly, I would like to thank Christian Vonk, my supervisor at La Place, who gave me the opportunity to conduct my Master Thesis amidst a lot of changes within the organization. His direction, guidance and valuable feedback is much appreciated. It was my first experience working at a Dutch company and he made sure I was comfortable and guided me whenever I was lost and looking for ideas. Secondly, I would like to thank my supervisors at my hiring company, Prof Dr. Felix Janszen and Arian Oosthoek for their guidance and support during this process. I am glad that they thought I was capable enough of working at one of their esteemed clients, La Place. Lastly, I would like to thank my University supervisors, Dr. Maya Daneva and Dr. Adina Aldea, for being there with me in this journey of 9 months of completing my Master thesis. They helped me with valuable inputs and feedback throughout the journey of my Master thesis. Meetings with them were always helpful and had a calming effect.
Working at Career Services formed an integral part of my university life. I would especially like to thank Jacqueline for being a great support, not only at work but also personally. Hemo and Selene were great colleagues to work with and I will cherish the memories.
2
3
Management Summary
The HORECA industry in the Netherlands is competitive. La Place is known to be one of the most popular restaurant chains in the Netherlands, offering customers a typically ‘Dutch’ experience, amongst other cuisines. With a range of restaurants and food joints for customers to visit, it is difficult to keep customers loyal. One way of encouraging customers to visit is to offer them incentives in terms of promotions and deals. However, regular promotions and deals are detrimental to company’s revenues. La Place is very sensitive in terms of pricing of its products and has a relatively high cost of operation because of the freshly prepared food, high quality ambience and relatively high cost of labor. So, regularly offering discounts and reducing product prices is not the most sustainable option. There is a need to be more precise with the way marketing and promotions are done. In addition to an ‘intended for all’ strategy, strategies must be designed to incentivize the loyal customers of La Place. This would not only help maintain their loyalty but spreads goodwill and a good word-of-mouth, possibly attracting more customers. Moreover, customers who have fallen out of the loyalty programme or are likely to fall out, need to be paid special attention and care to encourage them to return. This would be beneficial for both La Place and its customers.
Purpose: The goal of this study is to analyze the potential of using machine learning techniques like classification and clustering for grouping customers based on upcoming promotion and deals. Special attention to loyal customer groups would reduce the likelihood of them falling out and thereby, add to the turnover of La Place.
4
Results: The customer and transactional data analysis was done for the period between June-August 2019. Different customer groups were revealed based on the recency of their transactions. Surprisingly, it was found that more than half the customers of the loyalty programme haven’t visited La Place for more than 2 years. These were termed as ‘Lost’ customers. Almost 30% of the customers hadn’t visited La place during this period. This meant that during this period, only about 15% customers of the entire customer base visited La Place. Around 12% were frequent visitors, 1.5% were new customers and the remaining 1.5% were unexpected customers as they were believed to be lost.
Around 15% of the overall customers are termed as ‘Monitor‘ group. They are customers who did not visit during this period but have visited within the last 365 days. Around 15% of the customers are termed as ‘Inactive’. They are customers who haven’t visited in the last 365 days but had visited a year ago. Some customers turned up unexpectedly during this period. They were earlier either ‘Lost’ customers or ‘Inactive’ customers. This group is termed as ‘Redormed’. All customer groups identified are mutually exclusive and independent of each other.
Within each of these groups, customers were found to have a preference to visit La Place on a specific part of the day or a specific day of the week. Majority of the customers within these groups did not have specific preferences. For such groups without a preference, clustering was used to find patterns based on their transactional history. Based on knowledge about the clustering variables, inferences were drawn about the identified clusters having specific preferences for part of the day or day of the week.
Eventually, an approach was shown how random forest classifiers could be used to predict future visitors based on their defined labels. This would need training the model with historic data. The model would learn based on the data and then predict who would be the future visitors based on historical data.
Recommendations:
5
is a big group and efforts should be made to revive this group and turn them into frequent visitors. On the other hand, they can also become inactive and care must be taken to avoid this from happening. It is alarming to see a substantially large ‘Inactive’ group. They have high likelihood of turning into ‘Lost’ customers. It might already be too late to revive them but based on their past opinions, lessons must be learnt to be avoided in the future, and efforts should be made to try and make them visit again. ‘Redormed’ customers are probably one-off visitors but the fact that they returned after a long time must be appreciated.
In terms of improving the proposed classification method, several steps can be taken. This includes suggestion like inclusion of product level preferences for each customer, inclusion of other attributes like the preferred type of store and the location of store (highway/city), analysis of customer feedback and survey responses about their experience with La Place, sentiment analysis (Big Data) of social media data about the opinion of people about La Place, monitoring actual in-store data for a defined period. The proposed method does have some limitations which can be overcome with future improvements. The validity and reliability of the proposed method can only be verified once it has been put into practice and analyzing its results.
6
Contents
Chapter 1. INTRODUCTION ... 9
1.1 Problem Identification and Motivation ... 12
1.2 Research context ... 12
1.3 Research Objective ... 13
1.4 Research Question ... 14
1.5 Research Methodology ... 15
1.6 Structure of the report ... 17
Chapter 2. LITERATURE REVIEW ... 18
2.1 Classification Techniques ... 21
2.2 Classification Techniques ... 23
Chapter 3. DESIGN ... 26
3.1 Models, algorithms and techniques... 26
3.1.1 The LRFM Model ... 26
3.1.2 The K-means clustering algorithm ... 27
3.1.3 Random Forest Classifier ... 28
3.2 Design of the proposed method ... 29
3.3 Design choices, assumptions and constraints... 30
3.4 Tools ... 31
Chapter 4. CASE STUDY ... 33
4.1 About the Company ... 33
4.2 The model ... 34
4.3 Tools ... 37
4.4 The Tableau version of the K-means clustering algorithm ... 39
4.5 The Tableau Prep flow ... 42
Chapter 5. RESULTS ... 44
5.1 Analysis of the groups ... 46
5.1.1 Frequent Visitors ... 47
5.1.2 Monitor Group ... 52
5.1.3 Redormed Group ... 56
7
Chapter 6. EVALUATION ... 63
6.1 Setup ... 63
6.2 Respondents ... 63
6.3 Questions setup for evaluation ... 64
6.4 Evaluation Results ... 64
6.4.1 Qualitative results ... 64
6.4.2 Quantitative results ... 65
Chapter 7. CONCLUSION AND DISCUSSION ... 67
7.1 Conclusions ... 67
7.2 Discussion ... 71
7.2.1 Classification vs Clustering OR Both combined? ... 71
7.2.2 What’s in it for the Marketing team? ... 72
7.2.3 Contributions ... 73
7.2.4 Limitations ... 74
7.2.5 Validity and Reliability ... 75
7.3 Recommendations for future work ... 75
7.4 Advice to La Place ... 76
References ... 78
APPENDIX ... 81
Appendix A. Details about K-means clustering algorithm ... 81
Appendix B. Tableau Prep Flow ... 85
Appendix C. Additional Tables ... 85
Appendix D. Code for Random Forest ... 85
Appendix E. Questionnaire used for Evaluation ... 86
8 LIST OF FIGURES
Figure 1 Classification framework for data mining techniques in CRM (cited from [2]) ... 10
Figure 2 Design Science Research Methodology (DSRM) Process Model ... 16
Figure 3 Flowchart of the Grounded Theory Results ... 21
Figure 4 Proposed method ... 30
Figure 5 Generic Data flow architecture ... 32
Figure 6 Data flow architecture for La Place ... 39
Figure 7 Process diagram of Tableau Prep Flow ... 44
Figure 8 Customer Classification Overview ... 45
Figure 9 Revenue split based on Recency ... 46
Figure 10 Frequent Visitors Overview... 47
Figure 11 Frequent visitors - No daypart preference ... 48
Figure 12 Summary statistics - Clustering Frequent visitors without a daypart preference ... 49
Figure 13 ANOVA statistics - Clustering Frequent visitors without a daypart preference ... 49
Figure 14 Frequent visitors - No day preference ... 51
Figure 15 Summary statistics - Clustering Frequent visitors without a day preference ... 51
Figure 16 ANOVA statistics - Clustering Frequent visitors without a day preference ... 52
Figure 17 Monitor Group Overview ... 53
Figure 18 Monitor Group - No daypart preference ... 54
Figure 19 Summary statistics - Clustering Monitor group without a daypart preference... 54
Figure 20 Monitor Group - No day preference ... 55
Figure 21 Summary statistics - Clustering Monitor group without a day preference ... 55
Figure 22 Redormed Group Overview ... 56
Figure 23 Redormed Group - No daypart preference ... 58
Figure 24 Summary statistics - Clustering Redormed group without a daypart preference ... 58
Figure 25 Redormed Group - No day preference ... 59
Figure 26 Summary statistics - Clustering Redormed group without a day preference ... 59
Figure 27 New customers Overview ... 60
Figure 28 New customers - No daypart preference ... 61
Figure 29 Summary statistics - Clustering New customers without a daypart preference ... 61
Figure 30 New customers - No day preference ... 62
Figure 31 Summary statistics - Clustering New customers without a day preference ... 62
Figure 32 Sample output from Random forest classifier ... 70
LIST OF TABLES Table 1 Definitions of LRFM model ... 27
Table 2 Definitions of the proposed model ... 36
9
Chapter 1. INTRODUCTION
Customers are the most valuable asset of any business and are at the heart of customer relationship management (CRM). CRM is viewed as a comprehensive process of acquiring and retaining customers, and with the help of business intelligence, tries to maximize the customer value to the organization [1]. CRM is mainly comprised of a set of processes and enabling systems that support a business strategy to build long term and profitable relationships with specific customers [2]. Any CRM strategy could be viewed as a closed cycle consisting of four different dimensions; customer identification, customer attraction, customer retention, and customer development [1]. An effective classification or segmentation technique can be a powerful way of knowing customers [3]. Data about customer behavior and/or demographics can be used to divide customers into different segments. Such classification techniques can be used in targeting promotions and recommending the right products to the customers. Price promotions influence consumers’ experience positively when certain sales bargains are made, since some consumers value unexpected and spontaneous discounts and sales promotions [4]. Rather than targeting all the customers for all types of company promotions, which does not result positive response, there is always an enthusiasm as who are the people who should be targeted for the specific offer. In target marketing, it has been an arduous task to single out customers who are likely to be fascinated for a new product or service. At this juncture, data mining techniques can be applied for filtering out the target customers out of the pool. This would increase the overall effectiveness of the marketing campaign [5].
10
Figure 1 Classification framework for data mining techniques in CRM (cited from [2])
Customer classification and clustering enable the firms to group similar customers together and help managers to better understand the customers’ needs; because it is much easier to identify and analyze the characteristics of customer groups rather than studying each customer individually [7]. Dividing the customer base into homogenous groups enables them to deploy different marketing campaigns according to the characteristics of that group [8]. Success of a company depends on its ability to build and maintain loyal and valued customer relationships [9].
11
using customer clustering techniques, firms can effectively design their customer retention strategies and maximize their overall profitability [7]. Identifying different groups of customers and their needs can lead to customer satisfaction, which in turn contributes to customer loyalty [7]. When the customers discontinue doing business with a company and move to its competitors, various negative consequences such as losing current revenues due to discontinued business relations or loss of good reputation and credibility could be expected in the long term. This loss of credibility can lead to a loss of current and potential customers’ trust in products and services. In general, the probability of successfully selling a product/service to current active customers is roughly 60-70 percent, while this probability is only 5-20 percent for prospective customers [10]. It is more beneficial to identify key customers and retain them rather than acquiring new customers to fill the empty place of those who have decided to discontinue doing [11]business with the organization. This is mainly because the cost of new key customer acquisition is five times more than the cost of current customer retention [7]. Many firms understand the Pareto principle, that 20% of the customer base generates 80% of the profits, but the task of customer segmentation is to find out who belongs to the 20% [3]. If the customer loyalty is enhanced, customer life-cycle will be likely optimized, and eventually the firm will become more profitable. Customers will be more satisfied and a commitment towards relationship with customers would most likely have a positive impact on the firm’s brand loyalty and awareness.
Customer segmentation is defined as the process of dividing the entire customer base of a company or the market into smaller groups to make marketing actions more effective and concise. Each segmented group is a smaller segment of the total customer base with similar characteristics. Cluster analysis can be used to create customer segments. Customer are then mapped onto these segments. This makes it possible to increase targeting effectiveness of marketing promotions and to improve response to changing needs [12]. Clustering is an unsupervised learning techniquefor grouping similar data points. A clustering algorithm assigns many data points to a smaller number of groups such that data points in the same group share the same properties while, in different groups, they are dissimilar. In general, customer segmentation is defined as the process where customers of an enterprise are divided into groups based on their purchasing behavior and characteristics [1]. Segmentation based on a combination of customers’ geographic, demographic, and behavioral attributes is considered a better approach compared to the use of a single category of attributes [1].
12
machine learning techniques. Classification is the problem of identifying to which category does an object belong. This assigning of the object to a specific category is based on similarity between the objects in that category, like clustering. Classification is an example of pattern recognition and is used in a variety of applications like finding which emails should be classified ‘spam’ or as ‘non-spam’. Classification is one of the most widely used techniques as it helps to identify customers who are likely to be fascinated by a new product or service. Some of the common customer classification techniques include Naive Bayes Classification, Decision Tree, Artificial Neural Network (ANN), J 48 graft, LAD Tree, Radial Basis Functional Network, Multilayer Perception Neural Network, Ross Quinlan decision tree model (C5.0), C 4.5 Decision tree Algorithm [5] [13]. Out of the several standard techniques, selecting the best classification technique is a major task in data mining. As one size does not suit for all, likely one technique does not produce better yield for all types of data set [5].
1.1 Problem Identification and Motivation
Existing research suggests that companies either do not reveal how to target customers based on their transactional behavior or there isn’t enough information available how this can be done. With the help of well-known machine learning techniques like classification and clustering, it is possible to group customers as per their preferences. This helps in enabling different communication means with customers informing them about what is the best for them and thereby maintaining better relationships. Customers will in turn feel more valued and this will imminently increase the company turnover and possibly also the customer base. After all, CRM is mainly about intensifying and solidifying the relationship between the company and its customers, ideally in a one-to-one relationship. However, with a large customer base, it becomes almost impossible to keep such personalized relationships. This is where customer classification can help by grouping similar customers together and then designing ways of reaching out to them specific to their characteristics. It is vital that the number of these groups should be manageable for the company so that special attention can be given to each group and different strategies can be made to get the best out of each group. Overall, this will be a win-win situation for both parties involved, the customers and the company.
1.2 Research context
13
group customers using classification and clustering techniques. The method is designed to assist companies with the absence of a CRM system or similar advanced customer analysis tools. Moreover, it is also possible that the findings of this research may be add value to those offered by currently existing CRM systems. The purpose of this research is not to replace any existing system, but to work as an aid to managers and analysts in identifying their most valuable customers. The proposed method is meant to be generalizable to companies which store transactional data of customers, mostly from the HORECA industry. However, certain parts of this research would remain company specific such as the available tools and techniques depending upon their availability, expertise and the need of using them.
In order to ensure that the proposed method can be effective, a case study is conducted [14]. The case study was conducted at La Place, a popular Dutch restaurant chain. Details of can be found in Chapter 4. The adoption of the method proposed for La Place remains inspired from the generalizable method proposed in Chapter 3. However, certain aspects like the components of data flow architecture and chosen techniques for future predictions explained in Chapter 3 are robust and will tend to be more company specific.
1.3 Research Objective
Many small to medium-sized companies find it difficult to understand where, why and how much they should invest for their marketing activities [9]. The overall objective of conducting this research was trying to solve this business problem. In order to do so, a case study was conducted at La Place. The current way of designing promotions and deals at La Place is to advocate the variability of the menu by highlighting different products mainly focusing on the seasonality and time of the year. The promotions are sold at a discount, for example a coffee and apple pie deal for Euro 3.00 instead of the normal price of Euro 5.50, ideally suited for breakfast. The deals are targeted at the entire customer base and not to specific groups. This can cause customers to visit only to take benefits of the ongoing promotions and never return. Customers who avail promotions one-time and never visit again do not really benefit the overall revenues. Ideally, it would be nice to tailor these promotional offers to specific customers, who have a higher probability of returning.
14
reach out with promotions and deals. By addressing the business problem of La Place, it can be safely assumed that the proposed method can indeed be useful to similar companies.
1.4 Research Question
Based on the research objective stated in Chapter 3, the research questions are formulated. In order to answer the research questions, existing literature is used, and a method is proposed to achieve the research objective.
The main research question formulated from the research objective is as follows:
How can classification and clustering techniques be used in effective target group-based marketing schemes?
The goal of the main research question is to understand how data mining techniques like classification and clustering can be used to find similar groups of customers. In order to answer the main research question, firstly it is important to have a good understanding of the different customer classification and clustering techniques which are widely and effectively used by companies. Then , it is important to understand what the additional value is of doing such a customer classification and clustering scheme. Additionally, such a scheme can be used to possibly predict future visitors. Therefore, some research sub questions are defined in order to contribute towards answering the main research question and the research objective. The first research sub-question is formulated as follows:
SQ1: Which are the most widely used customer classification and clustering techniques?
The goal of SQ1 is to know about existing classification and clustering techniques which are popularly used by companies to group customers. This sub-question is answered primarily in Chapter 2 through a systematic literature review. This forms a basis for answering the second research sub-question, which is as follows:
SQ2: How can classification and clustering techniques be combined to group customers?
15
SQ3: What is the business value of incorporating results of these techniques in marketing strategies?
The goal of SQ3 is to understand if it is indeed useful and worth investing time and effort in implementing the proposed scheme. This sub-question is answered with the help of existing literature and findings from a case study. It is attempted to find if some research papers reveal how some companies benefited from such schemes in the past. Based on company’s historical data, it is possible to find which specific groups of customers need to be focused upon in order to reduce marketing/promotion costs and increase company’s profits. Chapters 5 and 7 are used to summarize answers for this research sub-question. Finally, it can be useful for companies if they can predict their future visitors based on historical data. The fourth research sub-question is formulated as follows:
SQ4: How can we predict future visitors based on the results of these techniques?
The goal of SQ4 is to explain how the results of such a scheme can be used to predict future visitors based on historical data. This sub-question is answered with the help of implementing random forest classifier on the already identified groups of customers from SQ2 and can be found in Chapter 5.
1.5 Research Methodology
16
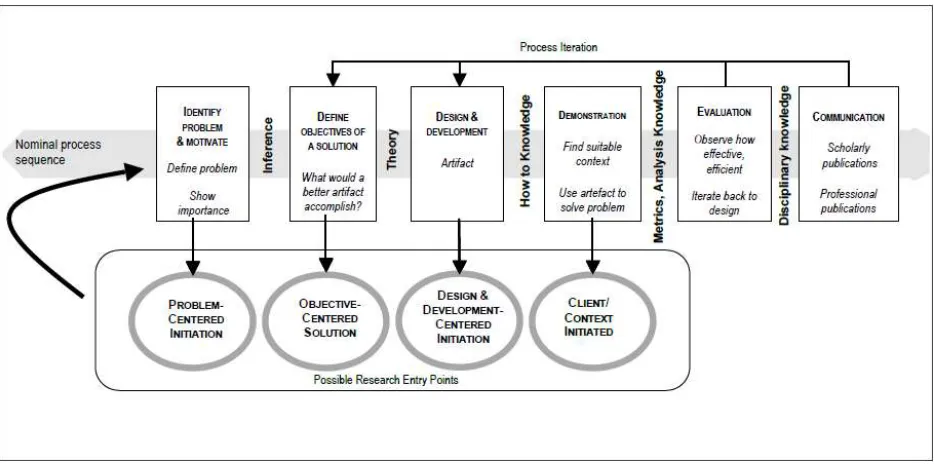
Figure 2 Design Science Research Methodology (DSRM) Process Model
The same steps from the DSRM are followed for conducting this research, as shown in Figure 2.
The first step includes the “Identification of the problem and motivation”. In this step, the research problem is defined, and its importance is shown with the problem at its center. It leads to ‘Problem-centered initiation’ as a possible research entry point. This is mainly covered in Chapter 1 of this thesis and is primarily used in answering SQ1 and SQ3.
The second step is “Defining the objectives of a solution”. This step uses inferences to determine what would a better artifact accomplish by solving the earlier stated problem. The objective(s) of the solution is the center of attraction and this step leads to ‘Objective-centered solution’ as a possible research entry point. This is mainly covered in Chapters 1 and 2 of this thesis and is also used to answer SQ1 and SQ3.
The third step is the “Design and development” of the artifact. This is where the artifact is designed and developed using theory and knowledge about the problem being addressed. It is explained in Chapter 3 of this thesis and is mainly used in answering SQ2. This leads to ‘Design and development centered initiation’ as a possible research entry point.
17
The fifth step involves the “Evaluation” of the artifact. The artifact is observed for its efficiency and effectiveness. If required, iterations to the third step are proposed. This is covered in Chapter 6 of this thesis.
The final step is “Communication” about the usefulness of this study and its contributions. This can be done with the help of scholarly publications and showing contributions to science and technology. This is briefly explained in Chapter 7 of this thesis.
1.6 Structure of the report
18
Chapter 2. LITERATURE REVIEW
The main purpose of conducting a literature review was to find which classification and clustering techniques were widely used in practice by companies and how are they combined. The findings of the literature review are mainly used in answering SQ1 and SQ2. In order to conduct the literature review, a systematic literature search was carried out using the guidelines based on the Grounded theory [16]. This also formed the basis for conducting the ‘Research Topics’ which preluded conducting this research to get an idea about the theory available in literature. For conducting the literature review, five iterative steps were defined namely,
a. Define criteria for inclusion and exclusion and determine search terms, sources and field of research.
b. Search for literature.
c. Select and refine the sample of selection. d. Analyze the selection of literature. e. Present and structure the content. The most important steps are described below:
A. INCLUSION AND EXCLUSION CRITERIA
All research and studies were included that:
i. presented theoretical and practical aspects of implementation of classification and/or clustering techniques in organizations, in order to understand the history and background of these techniques and the way they are implemented.
ii. were published after the year 2000, as data mining mainly blossomed in the past 2 decades.
iii. were case studies of the application(s) of these techniques in both the retail and wholesale markets.
iv. were published in well-known and reliable journals/publications. H-index1 was used a
quality aspect for ranking purpose and only those with H-index higher than 10 were included.
v. were only in English text.
vi. were limited to fields of Computer Science, Business and decision making and Decision Sciences. Other irrelevant fields like Social sciences, Neurosciences or
19
Mathematics were not considered important because the emphasis was more on the application in retail and wholesale markets.
All research and studies were excluded that:
i. were not freely accessible and needed a paid download or access request from the author(s).
ii. applied these techniques to non-customer data.
iii. did not have enough detail about the implementation of the technique and probably provided just an abstract or high-level overview.
iv. were deemed irrelevant upon reading the titles and abstracts. v. were found to be duplicates.
B. SEARCH
In this step, the focus was mainly on the search queries and the data sources to be queried. Reliable and trusted web search engines like Scopus2, Science Direct3 and Google Scholar 4 were
used. In some cases, when it was not possible to download articles from these sources, other sources like the LISA (University of Twente Library)5 were used.
The search strategy applied consisted of keywords which would enable retrieval of relevant results and were mapped towards answering the research questions listed earlier. A pre-exploratory “general” literature search was conducted to construct the list of concepts and keywords and to understand the topics better before building a search query. This was an iterative approach but helped in building towards a concrete list of concepts and keywords we were looking for. Using this as an input, one of the main advanced queries used in Scopus was as follows:
( ( "Customer" AND "classification" ) OR ( "Customer" AND "clustering" ) AND ( PUBYEAR > 2000 ) AND ( LANGUAGE ( english ) ) ) AND ( TO ( SUBJAREA , "COMP" ) OR TO ( SUBJAREA , "BUSI" ) OR TO ( SUBJAREA , "DECI" ) ) AND (
LIMIT-TO ( ACCESSTYPE(OA) ) )
The same query was used for answering both the research questions as the focus was on finding more (bigger set) results first, and then refining them carefully to ensure not missing out on important content. Not all subject areas were used, and the focus was mainly on subject areas like business, decision making and computer science, where we expect most extensive and relevant use of customer classification techniques. In addition to the results obtained from this
2https://www.scopus.com/home.uri 3https://www.sciencedirect.com/ 4https://scholar.google.nl/
20
query, additional references were obtained from other sources like Google Scholar and Science Direct which could not be accessed freely from Scopus.
C. SELECTION OF THE SAMPLE AND ANALYSIS OF THE SELECTION
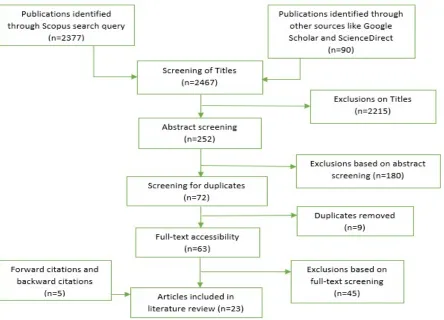
In this step, the results of the above search query are reviewed and filter the articles relevant to our research. This was the most time-consuming task, considering that the search query (even after being very specific) resulted in about 2377 results. This long list was exported, and the titles of all articles were reviewed to check if they remained relevant to what we were exactly looking for. Additionally, articles from other sources like Google Scholar and Science Direct were included resulting in a total of 2467 results. The titles of all these articles were screened to filter the articles which would be useful. This was an important step as a majority of 2215 (about 90%) articles were discarded. The reason for discarding these articles was because based on the titles, they did not really deal with ‘customer’ classification/clustering and did not have enough implementation details. At times, they appeared to be more theoretical or literature reviews and were from different subject areas and industries. This left a smaller set of 252 articles for abstract screening. Based on careful reading of abstracts, about 180 articles were excluded and out of the remaining 72, nine duplicates were removed. Duplicate removal is done at this stage as recommended by the Grounded Theory. After duplicate removal, 63 articles were reviewed completely based on their full-text, out of which 45 articles did not provide enough information or were incomplete.
21
Figure 3 Flowchart of the Grounded Theory Results
2.1 Classification Techniques
22
10 000 customers over 62 weeks and used the F-measure and R2(Recall) measure scores and explained the results with the help of test and training data.
One of the most renowned models for customer value analysis is the RFM (Recency, Frequency and Monetary) model and has been used by many researchers to perform customer segmentation [18] [19] [20]. The RFM model analyzes the behavior of the customers and therefore it is considered as a behavior-based model [21]. RFM model has a limitation as it is not able to divide customers into segments based on the length of their relationship with the company [22]. An approach combining the fuzzy c-means clustering and genetic algorithms to cluster the customers of steel industry is described [7]. This approach used the LRFM model which is an extension of the RFM model, L standing for Lifetime or Length of a customer’s relationship with the company. This combination of algorithms was used because the performance of fuzzy c-means algorithm is strongly affected by the selection of the initial centroid clusters and the performance of the combined algorithms had a lower mean squared error (MSE) compared to fuzzy means clustering. With the help of GA -Fuzzy clustering software which combines fuzzy c-means clustering and genetic algorithm, a dataset of 120 customers was distinctly clustered.
The LRFM model is combined with the k-means++ algorithm to identify clusters in a dataset of customers from a well-known, multi-national, Fast-Moving Consumer Goods (FMCG) company in Egypt [1]. The number of clusters k is found by integrating a bootstrapping phase in addition to employing both the Calinski-Harabasz index and Rand cluster validity index. For validation purposes, the Welch ANOVA testis deployed to ensure distinguishable characteristics among the clusters.
A two-stage clustering approach was proposed to cluster 597 specialty food retail customers into four clusters namely “standalone rationals”, “foodies”, “cherry pickers” and “indulgencers” [23]. This approach used the Ward’s method, followed by the k-means clustering algorithm. Results were validated using the MANOVA and ANOVA analysis and there was considerable inter-cluster difference among members, indicating good results.
23
A customer segmentation framework based on data mining was proposed and a new customer segmentation method was constructed based on survival character [3]. The framework presents the whole process of segmentation, which includes data acquiring, issue mapping, segmentation model establishing, data mining arithmetic selecting and function analysis. This framework used k-means clustering by which customers having similar survival characters (churn trend) are clustered together. This is followed by predicting each cluster’s survival/hazard function using survival analyses, then the validity of clustering is tested, and customer churn trend is identified. Results are validated against a dataset of mobile customers from a Chinese telecom company.
It is not only important to segment customers but also to create marketing strategies specific to those customer segments [9]. This research proposed a new Life Time Value (LTV) model and customer segmentation considering customer defection and cross-selling opportunity. The model was applied to 2000 customers from a telecommunication company, divided them into clusters based on their LTV and then proposed marketing strategies based on the observations of each cluster.
Customer value has become an important parameter in customer segmentation [24]. It is termed as Customer Lifetime value (CLV) and often acts as a differentiator between different customer segments, especially in CRM and decision-making for marketing. A framework to predict CLV was proposed based on adapted weighted RFM analysis [24]. K-means algorithm was used for clustering and number of clusters was decided based on Dunn index. ARIMA (Auto Regressive Integrated Moving Average) time series model was used on the identified clusters of customers to estimate their future CLV. Successful experimental results have been shown from the retail banking sector from this research.
Apart from all customer classification and segmentation techniques discussed, which use unsupervised and supervised techniques, the role of capturing social media data, lifestyle and other characteristics is very important and an emerging trend [12]. A complete customer clustering scheme would be a combination of transaction behavior and demographic behavior [12]. Social media complements, rather than overlaps, existing transactional data in databases. Additionally, it can help customers reach even a larger base of customer through common communities, networks, etc.
2.2 Classification Techniques
24
identify customers who would most likely respond to the prospective offerings of the company based on their past purchasing trends was built by [5]. The author used a combination of different classification techniques like Naïve Bayes, KNN (K nearest neighbor) and SVM (Support vector machines), and then compared the performance of these techniques. It was found that the Naive Bayesian Classification achieves the highest accuracy and specificity in this specific context. However, the worst classification was performed by Support Vector Machine technique as SVM technique achieves lowest sensitivity, accuracy and specificity. Additionally, SVM achieves the highest error rate with many false positive and false negative cases when compared to their peers.
The application of Information Theory in selecting customer features was analyzed [25]. Feature selection is an important data mining technique which helps in selecting only the relevant customer attributes for customer classification and discards the irrelevant ones. This work presents a variable selection method based on entropy and mutual information. Information Gain or Max Relevance is the concept of selecting variables that provide most information. The Information Theory concept is applied to a dataset about a bank telemarketing campaign. Based on Entropy and Information Gain calculations, the most relevant variables for feature selection are selected as a maximum product of Chi-square test and Reliability percentage. To evaluate the model, LIFT metrics was used, which reflected that 80% of the positive responses can be achieved by 50% of the sample scored with this method.
Data accuracy is an important dimension of data quality and plays an important role in the results of customer classification. Therefore, it is important to analyze the impact of data accuracy on different customer classification techniques [26]. This work analyzed this impact using a dataset of two empirical direct marketing data sets provided by the Direct Marketing Educational Foundation (DMEF)6 and found that decision trees perform better than RFM analysis,
CHAID and logistic regression under optimal data accuracy.
RFM, CHAID and logistic regression are popular customer classification techniques. A comparison between them was done [27]. In order to compare these techniques, they were applied on two different datasets. It was found that the RFM could be more successful overall when the response rate to marketing e-mails or campaigns is high. CHAID performed better than RFM when the response rate was low and when the target customer base to be reached out via emails and campaigns was small. Overall, CHAID and logistic regression performed better than RFM.
25
Customer churning is a major issue for most companies to deal with [28]. Customer churn is when an existing customer, user, player, subscriber or any kind of return client stops doing business or ends the relationship with a company. Churn prediction is a supervised problem and techniques like classification can help solve this problem with techniques and methods like logistic regression, Naive Bayes, decision trees, artificial neural networks and SVMs to predicts churning customers from the loyal ones. This issue is addressed by using multiple classifiers ensemble (MCE), which has become a powerful tool for improving classification performance in numerous fields [28]. MCE combines the results of base classifiers in reaching a final decision, however the challenge is how to select an optimal subset of base classifiers. This paper considers MCE which has a built-in model-selection function for predicting churning customers using group method of data handling (MCES-GMDH). The MCES-GMDH model’s training contains two phases: base classifiers training and classifiers ensemble selection. The higher the classification accuracy and the diversity among results, the better is the ensemble model’s performance. To validate results, they applied the MCES-GMDH to two different datasets and discussed about some other classifier ensemble methods bagging and boosting, GAMensPlus, and GAMensError! Bookmark not defined.. Eventually, it was concluded that for these datasets, the MCES-GMDH performs better than any of the other classifier ensemble methods. It was also shown that the MCES-GMDH model proposed here can better deal with the classification issue with imbalanced distribution.
26
Chapter 3. DESIGN
This chapter describes the design of the artifact. The artifact is a generalizable method which can be adopted by companies storing transactional data of customers. The main focus of this chapter is about the design choices in terms of the selected model, algorithm and techniques. Based on the literature review from Chapter 2, the LRFM model, the K-means algorithm and the Random forest classifier were selected. Details about these can be found in the next sections of this chapter.
3.1 Models, algorithms and techniques
The findings from the Literature Review indicated that the RFM model is one of the mostly popular and widely used methods for customer classification [30]. However, RFM has the limitation that it does not consider the Length of a customer’s relationship with the company. Therefore, the LRFM model was proposed as an improvement to the RFM model [21]. Using this method, it is possible to classify, or label customers based on their length (L), recency R), frequency (F) and monetary (M) values. The K-means clustering algorithm is used for clustering. A detailed description of the LRFM model and K-means clustering algorithm is provided below and then we discuss how they are used in the design of the prototype.
3.1.1 The LRFM Model
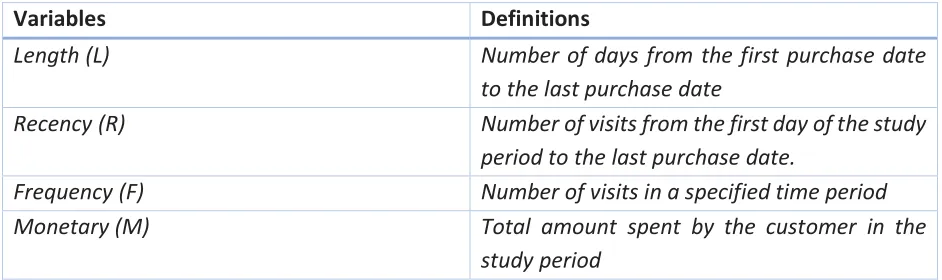
The traditional approach to use the LRFM model is to sort the customer data and then divide the data into five equal segments for each dimension of LRFM. The top 20% segment is assigned as a value of 5, the next 20% segment is assigned as a value of 4, and so on. Thus, each customer based on LRFM model can be represented by one of 625 (5*5*5*5) LRFM cells, namely, 5555, 5554, 5553, . . . , 1111. The definitions are as follows: length (L) is the time length between the first purchase date until the last purchase date, recency(R) is the time length since the most recent purchase; frequency (F) computes the number of purchases during the same period; and monetary (M) refers to the total amount of money spent on all purchases given the same period. The definitions are summarized in Table 1. Based on the values of these dimensions for each customer, they can be grouped into different groups as proposed in [31]:
27
2. frequent customers with always a high frequency of visiting (L↑R↑F↑M↓, L↓R↑F↑ M↓, L↑R↓F↑M↓, and L↓R↓F↑M↓),
3. spender customers with always a high monetary value and low frequency (L↑R↑F↓M ↑, L↓R↑F↓M↑, L↑R↓F↓M↑, and L↓R↓F↓M↑), and
[image:28.612.71.542.219.359.2]4. uncertain customers with always low frequency of visit and monetary value (L↑R↑F↓ M↓, L↓R↑F↓M↓, L↑R↓F↓M↓, and L↓R↓F↓M↓).
Table 1 Definitions of LRFM model
3.1.2 The K-means clustering algorithm
K-means is one of the simplest unsupervised learning algorithms that solve the well-known clustering problem. The procedure follows a simple and easy way to classify a given data set through a certain number of clusters fixed apriori (known beforehand).
K-means requires an initial specification of cluster centers. Starting with one cluster, the method chooses a variable whose mean is used as a threshold for splitting the data in two. The centroids of these two parts are then used to initialize k-means to optimize the membership of the two clusters. Next, one of the two clusters are chosen for splitting and a variable within that cluster is chosen whose mean is used as a threshold for splitting that cluster in two. K-means is then used to partition the data into three clusters, initialized with the centroids of the two parts of the split cluster and the centroid of the remaining cluster. This process is repeated until a set number of clusters is reached. Finally, this algorithm aims at minimizing an objective function know as squared error function given by:
Variables Definitions
Length (L) Number of days from the first purchase date
to the last purchase date
Recency (R) Number of visits from the first day of the study
period to the last purchase date.
Frequency (F) Number of visits in a specified time period
Monetary (M) Total amount spent by the customer in the
28
= −
where,
‘||xi – vj||’ is the Euclidean distance between xi and vj.
‘ci’ is the number of data points in ith cluster.
‘c’ is the number of cluster centers.
3.1.3 Random Forest Classifier
Random Forests is a versatile machine learning method capable of performing both regression and classification tasks. It also undertakes dimensional reduction methods, treats missing values, outlier values and other essential steps of data exploration, and does a fairly good job.
Random Forests provides an improvement over bagged trees (decision trees)) by a small change that decorrelates the trees. As in bagging, you build a number of decision trees on bootstrapped training samples. But when building these decision trees, each time a split in a tree is considered, a random sample of m predictors is chosen as split candidates from the full set of p predictors. The split is allowed to use only one of those m predictors. This is the main difference between random forests and bagging; because as in bagging, the choice of predictor m=p.
In order to grow a random forest, you should:
First assume that the number of cases in the training set is K. Then, take a random sample of these K cases, and then use this sample as the training set for growing the tree.
If there are p input variables, specify a number m<p such that at each node, you can select m random variables out of the p. The best split on these m is used to split the node.
Each tree is subsequently grown to the largest extent possible and no pruning is needed.
Finally, aggregate the predictions of the target trees to predict new data.
29
However, one disadvantage of using Random Forests is that you might easily overfit noisy datasets, especially in the case of doing regression.
3.2 Design of the proposed method
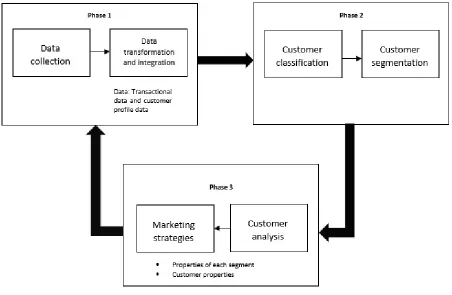
In this study, a method is designed to carry out the classification and clustering of customers, right from initiation to identifying relevant groups for marketing strategies. The method can be seen in Figure 4. There are mainly three phases:
Phase 1 deals mainly with the data collection, integration, cleaning and transformation activities. This can be thought of as a preparatory phase. This phase also includes integration with correct data sources, removing corrupt or incorrect data, handling missing data and calculation of new attributes relevant to the classification scheme specific to the context.
In phase 2, the actual customer classification and segmentation takes place and their results are combined. One or more classification/clustering techniques are chosen and then applied on the customers from phase 1. The output of phase 2 is groups of customers with common characteristics.
30
[image:31.612.80.532.92.387.2]The three phases within the method are connected in a cyclic fashion and one-directional.
Figure 4 Proposed method
3.3 Design choices, assumptions and constraints
This section describes the design choices, assumptions and constraints. These are based on multiple factors like the utility of the method being developed, fore sighting upcoming issues, data quality issues and so on.
Following design choices, assumptions and constraints were considered:
The focus was on a classification scheme based on how recently customers have visited. So, it is more concentrated on Recency (R) rather than Frequency (F)
Only transactional data of customers with membership/loyalty cards are considered. This does not guarantee all transactions of membership/loyalty card holders were recorded as some customers tend not to use their cards on every visit due to different reasons.
31
Transactions with negative transactional values such as revenue, number of products should be cleaned as they are incorrect entries and can lead to misleading results.
All computations and calculations should be done strictly only within the selected BI tool.
The quality of the remaining data should be trusted.
Transactions only within normal working hours should be considered for consistency and standardization purposes.
3.4 Tools
32
33
Chapter 4. CASE STUDY
This chapter deals with the demonstration of the proposed method (artifact) in a real-world scenario with the help of a case study at a company.
4.1 About the Company
This study was conducted at La Place, a popular Dutch restaurant chain. La Place is currently owned by Jumbo, a popular supermarket chain in the Netherlands. Until 2015, La Place was owned by the Dutch store giant V&D (Vroom & Dreesmann), which later went bankrupt and had to stop operations. As of 2015, V&D operated 67 branches throughout the Netherlands. La Place, was its former subsidiary restaurant chain which had both in-house and standalone restaurants throughout the country. The department stores sold clothing and shoes, jewelry, cosmetics, books, home-entertainment products, electric goods, stationery, cards and posters, furniture and home wares. Most branches also had a La Place in-house restaurant, a travel agent and an ATM. Larger branches also had a bakery. The variety of services and products they offered attracted a huge customer base. However, after bankruptcy, a large portion of this customer base was lost due to the shutting down of its stores and this obviously, had major impact on the customer base of La Place. So, it has become increasingly important for La Place to better understand its customers and maintain stronger relationships with them.
34
with La Place need to visit more often and need to be retained. This is where customer relationship management can help.
As stated earlier in , the context of the problem does not remain confined to a specific company like La Place. Primarily, this research proposes a method which is generalizable and can be adopted by companies storing transactional data in the HORECA (Hotel/restaurant/café) industry. Then this method is demonstrated for a company like La Place, but the overall goal is to make it generalizable to other companies without major changes. Other companies from the HORECA industry who store transactional information of identifiable customers would also benefit from understanding the behavior of its customers and proactively responding to ensure not losing out on valuable customers in a competitive world. It is worthwhile mentioning that not many HORECA companies traditionally store transactional data of customers and La Place is one of the few doing so.
4.2 The model
35
Attributes Definitions Classes/Labels
Recency Number of days since the first or the last transaction depending upon the label (13 weeks is selected as a reference period
mainly because of a running quarter analysis)
New: customers who made their first transaction in the last 13 weeks and had no previous transactional history
Frequent: customers who made at least one
transaction in the last 13 weeks and at least one more transaction within the past 365 days.
Monitor: customers who did not make any transaction in the last 13 weeks but had visited at least once in the last 365 days.
Inactive: customers who haven’t visited in the last 365 days but had visited in the year before (between 365 days-730 days)..
Lost: customers who did not make any transactions for over 2 years (730 days).
Redormed1: customer who had last visited at least once one year ago (between 365-730 days) and turned up in the last 13 weeks.
Redormed2: customers who had last visited beyond 2 years ago (730 days) and turned up in the last 13 weeks.
36
Middle: customers who made their first transaction in the last 2 years, excluding the ‘New’ customers
Old: customers who made their first transaction prior to 2 years (more than 730 days ago).
Monetary The aggregated average ticket value of each customer
No Labels
Age The actual age of the customers (in years). (The labels are motivated by the
marketing team)
Generation Z: customers aged between 9 to 19 years.
Millenials: customers aged between 20 to 39 years.
Generation X: customer aged between 40 to 53 years.
Baby Boomers: customers aged between 54 to 73 years.
Silent Generation: customers aged between 74 to 90 years.
Unknown Age: remaining customers for whom the age was not known or missing. Daypart The part of the day when the transaction
was recorded
Breakfast is when the transaction was recorded between 0800-1200 hours
Lunch is when the
transaction was recorded between 1200-1500 hours
Midday is when the transaction was recorded between 1500-1700 hours
[image:37.612.73.543.65.665.2]37
‘Recency’ is the most important attribute because in a competitive business, the frequent customers are the ones who contribute the most to the company’s revenues. So, every company would like to know who these customers and try their best to retain them. The most interesting part of the ‘Recency’ based labels are that customers will move within these groups every 13 weeks. A ‘New’ customer can become a ‘Frequent’ customer if they keep visiting regularly. On the other hand, ‘Frequent’ customers can turn into ‘Monitor’ if they stop visiting. Similarly, ‘Monitor’ customers can turn into ‘Inactive’ and ‘Inactive’ into ‘Lost’ or ‘Redormed1’. Lost customers can become ‘Redormed2’. In order to increase company revenue, all attempts should be made to keep ‘Frequent’ customers loyal, turn ‘New’ and ‘Monitor’ into ‘Frequent’, ‘Inactive’ into ‘Redormed1’ and ‘Lost’ into ‘Redormed2’.
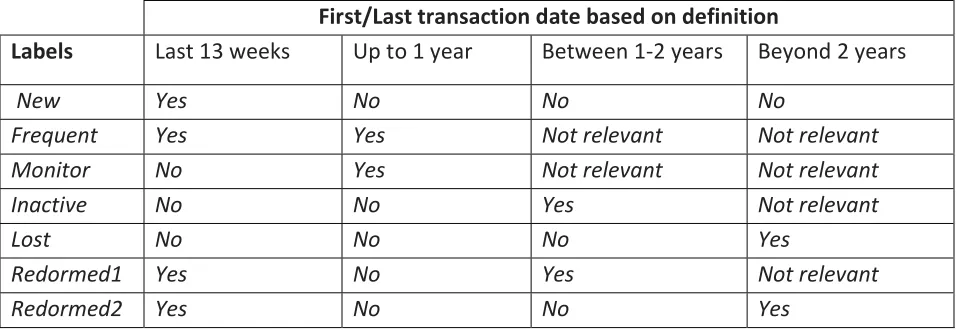
A ‘Recency’ matrix is shown in Table 3 for better understanding of this attribute.
First/Last transaction date based on definition
Labels Last 13 weeks Up to 1 year Between 1-2 years Beyond 2 years
New Yes No No No
Frequent Yes Yes Not relevant Not relevant
Monitor No Yes Not relevant Not relevant
Inactive No No Yes Not relevant
Lost No No No Yes
Redormed1 Yes No Yes Not relevant
[image:38.612.72.555.291.456.2]Redormed2 Yes No No Yes
Table 3 Recency matrix based on Transaction history
4.3 Tools
As shown in Figure 5, a source system is needed which stores the customer and transactional data. At La Place, the source system was a Microsoft SQL server7. The Business Intelligence tools
available were Qlik View8, Tableau Prep and Tableau Desktop. The combination of Tableau Prep
and Tableau desktop was used mainly because of their capability to connect independently to Microsoft SQL Server and their ability to communicate between each other. QlikView was discarded as it was not able to perform most of the functions offered by Tableau. Apart from these, no other BI tools were available within the organization and there were minimal chances
38
of acquiring a new one, something like the well-known Microsoft Power BI9. This was mainly due
to organizational policies and an upcoming business transition which made the future uncertain. Tableau Prep is a powerful data shaping, combining and cleansing tool. It has the capability of combining with different data sources like SQL databases, Oracle databases, Enterprise resource planning (ERP) systems like SAP, Excel files and even on-premise servers. To combine data from different sources, Tableau Prep has powerful in-built functions like Join, Pivot, Union and normal cleaning/filtering steps. It is possible to design a relatively complex data flow, right from reading the input data by connecting to a data source, to giving a structured data output, with intermediate complex transformation steps. It is easy to understand even complex data flows because of the transparency, ease of use, immediate results and smart calculations. Other similar tools in the market are Pentaho, Rapid Miner, KNIME and so on (more information in Appendix).
Tableau Desktop is one of the most powerful Business Intelligence (BI) tools currently available in the market. Like Tableau Prep, it can connect to many data sources. It is mainly used for visualization purposes with the help of designing simple charts, views, dashboards and stories. It is also capable of performing statistical operations like trend analysis, regression and clustering. Tableau Desktop is also capable of integrating with external connections like Python and R libraries for performing advanced statistical analysis.
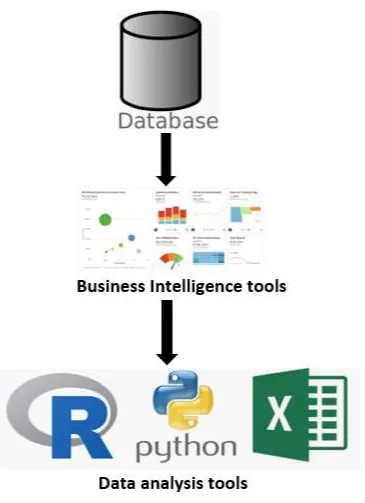
The data flow architecture suitable for La Place within the available technology landscape can be seen in Figure 5.
A data flow is built in Tableau Prep and exported as a .hyper file or a .xlsx file. The structure of this data flow can be seen in Appendix B. This file is imported into Tableau desktop to visualize the results. Finally, Tableau desktop is connected with an external service for R/Python and Microsoft Excel to perform some statistical operations like clustering and implementing the random forest classifier.
39
Figure 6 Data flow architecture for La Place
4.4 The Tableau version of the K-means clustering algorithm
40
Tableau uses Lloyd’s algorithm with squared Euclidean distances to compute the k-means clustering for each k. Combined with the splitting procedure to determine the initial centers for each k > 1, the resulting clustering is deterministic, with the result dependent only on the number of clusters.
The algorithm starts by picking initial cluster centers:
It then partitions the marks by assigning each to its nearest center:
41
It then reviews the assignment of marks to clusters and reassigns any marks that are now closer to a different center than before. The clusters are redefined, and marks are reassigned iteratively until no more changes are occurring.
Criteria used to determine the optimal number of clusters
Tableau uses the Calinski-Harabasz criterion to assess cluster quality. The Calinski-Harabasz criterion is defined as:
where SSB is the overall between-cluster variance, SSW the overall within-cluster variance, k the
number of clusters, and N the number of observations.
The greater the value of this ratio, the more cohesive the clusters (low within-cluster variance) and the more distinct/separate the individual clusters (high between-cluster variance). Since the Calinski-Harabasz index is not defined for k=1, it cannot be used to detect one-cluster cases.
42
4.5 The Tableau Prep flow
The main part of the proposed method would be the connection between the BI tool and the data source. This is where most of the calculations, transformations and computations would take place. Since Tableau is the main BI tool selected for this research, the heart of our classification scheme is the flow created in Tableau Prep. This flow can connect to the SQL server anytime and read transactional data of customers up to the previous day.
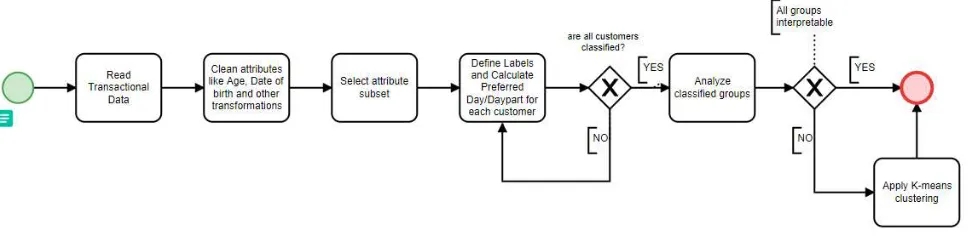
The idea behind developing the flow was that it should be able to connect to the Live SQL server and extract transactional data for each customer. The process diagram of the Tableau Prep flow can be seen in Figure 7. In this figure, the boxes indicate activities and the arrows show the sequence in which the activities are executed. The complete flow can be seen in APPENDIX B. Below is a description of the steps in the flow:
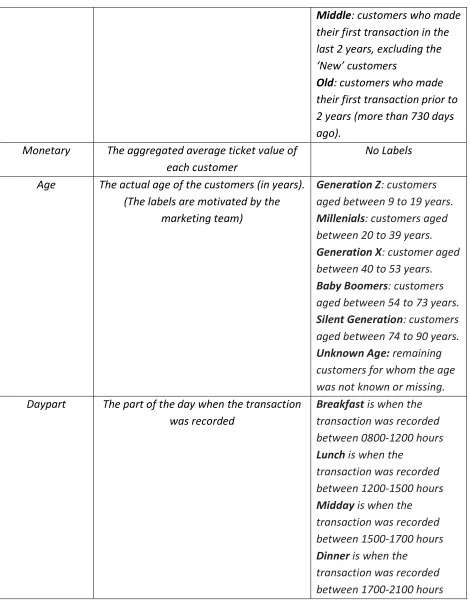
1. Read ‘Customer’ and ‘Transaction’ tables. The Customer table had data about 1.2 million customers. This included information about their age, year of birth gender, city of residence, Customer Card number, registration date and so on. It was seen that data for all data fields was not available for all customers. For example, the age and year of birth was missing for about 470k customers and for some others, there were incorrect entries like age greater than 100 years or less than 5 years. Therefore, data in this table had to be cleaned and the cleaning operations mainly involved removing the incorrect birth years of customer, along with most of the other unnecessary fields which were not required in the design process. Customers only with birth years between 1930-2010 have been considered for further analysis and all other years of birth have been treated as NULL. Age of the customers has also been recalculated based on the correct birth year and only customers aged between 9-89 years have been considered. Eventually, we ended up with around 700k customers for whom we had the correct age data. The reason there was so much emphasis on age was because the Marketing team strongly believed in a classification based on age/age groups of customers. Customers were labelled into different age groups based on the definitions in Table 2.
43
about them in the ‘Customers’ table. So, these 820k customers formed our customer base because this whole research aimed to classify only those customers for whom there was some transactional history.
2. The ‘Transactions’ table had very limited information about the customers who made those transactions. Therefore, the ‘Customers’ and ‘Transactions’ tables were joined to get all information about those 820k customers. So, this gave complete information about each transaction and the customer who made it.
3. The ‘Transactions’ table into two parts. This is mainly for the ‘Recency’ calculations. First part has those transactions which were recorded within the last 13 weeks and the second part had all transactions older than 13 weeks. We found around 400k transactions by approximately 120k customers in the last 13 weeks and around 8 million transactions by around 800k customers. It must be specified here that these transaction numbers are aggregated by customer number.
4. The Lifetime, Recency and Monetary values were calculated for each customer in this step. These are based on the definitions in Table 2.
5. The next step was finding the ‘Preferred Day’ of visiting La Place for these 820k customers. A day of the week is preferred by a customer if the number of transactions made on that specific weekday is a clear majority (more than 50%) compared to the total transactions made by the customer. For example, Friday is a preferred day for a customer with a total of 10 transactions if the customer has made minimum 6 transactions on Friday. In order to make this split per weekday, total transactions of each customer were divided based on the weekday on which they were recorded. Eventually, 7 splits were recorded for each weekday and there were obviously overlapping customers with transactions on different weekdays. With these splits, it was possible not only to find how many transactions were made by each customer on each day of the week, but also a combination of their visits on different weekdays. These splits were brought together to find the ‘Preferred weekday’ for each customer.
44
7. Results of steps 7 and 8 were combined to get the preferred weekday and daypart for each of the 820k customers.
[image:45.612.81.567.150.268.2]8. Steps 1, 4 and 7 are combined to get all the defined labels and attributes for all of the 820k customers, and the output is saved as a .hyper extract file.
Figure 7 Process diagram of Tableau Prep Flow
Chapter 5. RESULTS
An overview of the customer base can be seen in Figure 8. The overview provides information about the different attributes like the labels defined based on Recency, Age Groups, Lifetime and Monetary values. The design of the overview was a free choice and was designed keeping in mind that it should provide information about Lifetime (L), Recency (R) and Age Group labels in addition to overall information about the number of customers , their age and how much they spend on an average. This overview would help the business in getting a good insight into the numbers and can be further drilled down if required.
Based on ‘Recency’, the ‘Lost’ group of customers is the largest and the ‘Redormed’ groups are the smallest. This is majorly because of the business takeover that happened in early 2016 which caused the closing down of most of the stores across the Netherlands. Also, a lot of other stores operated by the V&D group were shut down. This could be a major reason for a considerably large proportion of users being lost, at almost 59%. Around 14% of the customers are classified in the ‘Monitor’ group, 13% as ‘Inactive’ group and 12% as ‘Frequent’ visitors. The addition of new customers during last 13 weeks was about 1.5% of the total customer base and almost the same proportion of customers were ‘Redormed’.
45
majority, justifying the average age of the whole customer base to be on the higher side, at around 49 years.
The ‘Monetary’ value was computed based on the average spending of each customer on a transaction at La Place. These are aggregated values. So, if a customer has made 10 transactions in total spending 100 Euros, the average ticket value for the customer would be 100/10=10 Euros. The Average ticket value of the entire customer base turns out to be Euros 9.47.
[image:46.612.73.541.235.483.2]Based on ‘Lifetime’, the biggest group is formed by the ‘OLD’ group, which is in sync with the ‘Lost’ group based on ‘Recency’.
Figure 8 Customer Classification Overview
46
Figure 9 Revenue split based on Recency
![Figure 1 Classification framework for data mining techniques in CRM (cited from [2])](https://thumb-us.123doks.com/thumbv2/123dok_us/9608693.463831/11.612.96.552.73.509/figure-classification-framework-data-mining-techniques-crm-cited.webp)