Abstract— Feature preserved enhancement is of great interest in medical ultrasound images. Speckle is a main factor which affects the quality, contrast resolution and most important texture information present in ultrasound images and can make the post-processing difficult. This paper presents a new computationally efficient enhancement approach which is based on the rational-dilation wavelet transform (RADWT) and non-linear bilateral filter. RADWT, a new family of the discrete wavelet transform for which frequency resolution can be varied, is employed to provide effective representation of the noisy coefficient. Bilateral filter and different thresholding schemes are applied to the noisy RADWT coefficient to improve the denoising efficiency and preserve the edge features effectively with this consideration that blurring associated with speckle reduction should be less and fine details are enhanced properly for the visual enhancement of ultrasound images. The proposed approach helps also to improve the visual quality of the ultrasound images. Experimental results demonstrate the ability of proposed method for noise suppression, feature and edge preservation in terms of different performance measures.
Index Terms—Ultrasound, Rational-dilation wavelet transform,Non-linear Bilateral Filter, Thresholding, Speckle.
I. INTRODUCTION
VER the years, the research in the medical imaging has produced many different imaging modalities for the clinical purpose. Among the medical images from different imaging modalities, ultrasound B-scan images are widely used. This widespread choice is due to its cost effectiveness, portability, acceptability and safety [1]. However, the images obtained from ultrasound imaging are of relatively poor quality. The analysis of these images is very complex due to their data composition. Medical ultrasound images which are obtained from coherent energy, suffer from interference of backscattered echoes from the randomly distributed scatters, called speckle [2].
Speckle is considered as a multiplicative noise which has undesirable interference effect on the images. Due to presence of these noises, diagnosis becomes a time consuming job besides being susceptible to the errors depending upon the clinicians/radiologist experience and expertise. Apart from this high level image processing tasks like segmentation, feature extraction, classification etc. may
Deep Gupta is with Department of Electrical Engineering, Indian Institute of Technology Roorkee, Roorkee-247667, India (e-mail: [email protected], [email protected]).
R.S. Anand and Barjeev Tyagi are also with Department of Electrical Engineering, Indian Institute of Technology Roorkee, Roorkee-247667, India).
become very difficult. Therefore, detecting and enhancing the boundaries between different cavities, organ etc., is of great need in ultrasound imaging. To improve the quality of the images, the most important issue is the reduction of these speckles. Sometimes speckle reduction process may suppress the important details/features of the ultrasound images, so speckle reduction algorithms should be designed in such a manner that it smoothens the images without significant loss of information.
Ultrasound speckle reduction methods can be classified in two categories viz. image averaging and image filtering [3]. Image averaging is usually achieved by averaging a series of uncorrelated ultrasound images in the spatial or frequency domain. These uncorrelated images may be sampled at different times, from different views or with different frequency for same target [4]. It is apparent that such methods suffer from the loss of spatial resolution. Filtering methods are a practical alternative for most clinical applications. It can be further classified as single scale spatial filtering such as linear, non-linear adaptive methods etc., multiscale spatial filtering such as diffusion based methods and others multiscale methods in different transform domain.
Linear spatial filter introduce severe blurring and loss of diagnostically important features and useful information [5]. Many non-linear filters have been also introduced such as median and weighted median filters (AWMF) which are based on pixel replication to eliminate the requirement in traditional median filtering [6] that speckle must be smaller than half of the size of the filter window. It retains the edges but it suffers from loss of resolution by suppressing the fine details present in the images.
In the second category, various popular filter used in spatial domain are Wiener filter [7], proximity based filters [8] and order statistic filter [9]. Wiener filter works well when the noise is of constant power additive noise while proximity filters help in removing the noise at the cost of blurring the edges. Mostly cited adaptive filters incorporate the Kuan [10], Lee [11], Frost filter [12] and Gamma Map filters. These filters are obviously superior measured up to low pass filter, however there is a tradeoff between smoothing efficiency and preservation of discontinuities due to sensitiveness between size and shape of the filter window. As regards Y. Yu [13] presented anisotropic diffusion filter [14]. This filter was based on the non-linear partial derivative equations. Later on the modified forms of anisotropic diffusion based filter have been presented [15]
[16].
Enhancement of Medical Ultrasound Images
using Non-Linear Filtering Based on
Rational-Dilation Wavelet Transform
Deep Gupta, R.S. Anand, Barjeev Tyagi
Lately comprehensive efforts have been made to reduce the speckle noise and overcome the drawback of spatial domain filtering, using the wavelet transform. In [17] [18] wavelet thresholding has been proposed as a true signal estimation technique that exploits the capabilities of wavelet transform for signal denoising. In [19] soft thresholding denoising method is presented in which the main critical task of the thresholding scheme is the selection of the threshold value. Various threshold selection techniques have been proposed as VisuShrink, SureShrink and BayesShrink [18] [20] [21]. In [22] [23] the statistical method such as Bayesian approach has been applied in denoising of images and later on, the researchers extended this approach using different noise models for the different noisy wavelet coefficients [20] [24] [25]. The main strength of wavelet shrinkage method is the capability to treat the different frequency components of an image separately but in this, the problem experienced is generally smoothening of edges. In [26] [27] wavelet based total variation filtering method is also presented in which noisy image undergoes several iterations for suppressing the Gaussian noise. This method works well but more number of iteration leads to blurring effect. The bilateral filter was proposed in [28] as an alternative to wavelet thresholding. It is a non-linear filter and used in spatial domain for edge preserved denoising. In [29] [30] a wavelet transform based bilateral filtering approach has been presented. It provides better denoising and also effectively preserves the edges. This method exploits the potential features of both wavelet thresholding and bilateral filter at the same time. However, wavelet transform based method may introduce many visual artifacts in the denoised images due to fixed wavelet basis and fixed resolution.
Currently research is concentrated in the wavelet domain because of its primary properties like sparsity and decomposition of wavelet coefficients. The sparsity property of the wavelet transform, combined with the capacity for analyzing time frequency information simultaneously within different frequency subbands or temporal resolution, makes the wavelet domain ideal for the problem. Wavelet transform is an effective processing tool for smoothing the signals. However, it has a poor frequency resolution or low Q-factor which limit the effectiveness of this wavelet transform. In 2009, Selesnick introduced a new family of the wavelet transform, known as rational-dilation wavelet transform, for which the frequency resolution can be varied [31]. This wavelet transform is more flexible and modestly overcomplete, based on rational-dilation. This paper combines the rational-dilation wavelet transform with bilateral filter and thresholding scheme to enhance the ultrasound images.
II. THEORETICAL BACKGROUND
A. Rational-Dilation Wavelet Transform (RADWT)
RADWT is a discrete wavelet transform with the wavelet variables of time and frequency subband as a position and scale along with the rational-dilation factor. Different wavelet transform are used in the different image processing application such as debluring, sharpening, denoising etc. Wavelet transform are based on the analysis of the signal at different resolution levels. Those applications which require
p
G q
s
q H* p
G*
x
xˆ H
s
Fig.1. Analysis and synthesis filters for the implementation of RADWT
the transforms are invertible; the resolution is doubled from one resolution level to other level. In this transform dilation factor is two and the wavelet transform is dyadic. The RADWT is based on the rational-dilation factor of between one and two, where the resolution is increased more from one resolution level to another resolution level. It provides more flexibility for varying frequency resolution because the dyadic wavelet transform limits its effectiveness due to low Q-factor i.e. poor frequency resolution in case of oscillatory signal [32] but the RADWT provide a wide range of the constant Q factor depending upon the dilation factors. The RADWT is implemented using a perfect reconstruction by using two iterated two channel filter bank with rational-dilation factor (p and q) and high pass sampling factor (s). The RADWT is characterized by its Q factor and its redundancy i.e. oversampling rate [31]. The RADWT is implemented using the iterated filter bank with dilation parameters A q p andBs, which is shown in Fig. 1.
In Fig. 1, H is a low pass filter and G is a high pass filter in the analysis filter bank which are used for the implementation of the RADWT. RADWT is a self-inverting (or form a tight frame) if the analysis and synthesis filter bank shown in Fig. 1 have a perfect reconstruction property. If the analysis and synthesis filters are so designed that the output signal is equal to the input signal then the filters are said to satisfy the perfect reconstruction condition. The necessary and sufficient conditions on the filter H and G to insure the perfect reconstruction are explained as follows [31]:
( ) 0 ,
H for q (1)
( ) 0 0, 1 1
G for s (2)
2
1 1 2
1 0,
H G for
pq p s
(3) For the perfect reconstruction of the wavelet transform, the length of the signal should be multiple of q and s. The signal length should be multiple of the least common multiple of q and s. Inverse rational-dilation wavelet transform (IRADWT) is computed by the transpose of the forward RADWT. For rational-dilation wavelet transform, the wavelet is defined in frequency domain as in [31].
2
ˆ lim
j j
p p
G j
q q
j
(4) So by choosing the parameter p, q, and s, RADWT can
achieve high Q factor with good time frequency localization. Four stage forward and inverse rational-dilation wavelet transform are illustrated in Fig. 2.
B. Bilateral Filter (BLF)
x p G q s H p G q s H p G q s H d1 d2 d3 RADWT1 RADWT2 RADWT3 (a) p G q s H d4 c4 RADWT4 q G* p H* q G* p H* d2 d1 x ˆ s s (b) q G* p H*
d3 s
q
G* p H* c4
d4 s
IRADWT1
IRADWT2
IRADWT3
[image:3.595.56.285.51.222.2]IRADWT4
Fig. 2. Four stage RADWT decomposition (a) Analysis filter bank (b) Synthesis filter bank
the neighborhood and the intensity distance around the neighborhood of a pixel. It is achieved by the combination of two Gaussian filters; first one is domain filter while the second is the range filter [30]. So at a pixel location i, the response of the BLF can be computed as
1
ˆ( ) ( ) ( , ) ( , ) ( )
x i j N i Df i j Rf i j x j C
(5)
Where
i
andj
are the coordinate vectors,Df( , )i j and ( , )Rf i j are domain and range filter components of the bilateral filter, respectively, which are defined as
2 ( , ) exp
2 2
j i D i j
f d and 2 ( ) ( ) ( , ) exp
2 2 x j x i R i j
f r ( )
N i is the spatial neighborhood of x and C is the normalization constant defined as below:
( , ) ( , ) ( )
C j N i Df i j Rf i j (6) where d and r are the domain and range parameters which control the behavior of the weights.
In bilateral filter, the choice of the parameters d and r
is very important. If their values are set too high, the filter will act as a smoothing filter and will blur the edges. If their values are set too low, the noise cannot be removed. Generally, dand rdepend on the standard deviation of the noise. The optimal value of d is relatively insensitive to noise variance while the optimal value of rchanges significantly as the noise standard deviation changes [32]. Theoptimal value of range parameter r is linearly related with the standard deviation of noise.
C. Thresholding Schemes (THR)
In recent years, the thresholding method is considered in many studies for image denoising [19] [23] [29]. The basic idea of the thresholding is that the energy of a signal is concentrated on few coefficients while the energy of noise is spread among all coefficients in RADWT domain. So denoising can be achieved by applying a thresholding function to the coefficients in the transform domain. The thresholding schemes provide the threshold coefficients by comparing the transformed coefficients against a threshold to remove the noise from a signal while preserving the important information of the original signal. The subband containing high frequency coefficients are processed with the different thresholding techniques. Usually two types of the thresholding are used.
1. Soft thresholding
Soft thresholding is used to approximate the noisy coefficient of the signal. The coefficients whose absolute values are lower than the particular threshold () are first set to zero and then scaling the nonzero coefficients i.e. whose values are greater than the threshold (). So the noiseless coefficients are computed using soft thresholding as follows [19],
( , ) ; ( , ) ( ( , )) ( , ) ; ( , )
0; ( , )
d i j d i j THR d i j d i j d i j
d i j
(7)
2. Hard thresholding
Hard thresholding involves setting to zero the coefficient whose absolute values are lower than the threshold () otherwise left out the entire signal values. So the noise free coefficients are estimated as follows,
( , ); ( , ) ( ( , ))
0;
d i j d i j THR d i j
otherwise
(8)
Three methods are presented to compute the threshold value () namely Visushrink, Sureshrink and Bayesshrink [18] [20]. Visushrink is based on applying the universal threshold which is also called Donoho threshold and it is calculated from N 2log( )N .
whereN is the length of the signal and N is estimated standard deviation of noise which is computed using the median of absolute deviation from the first level of the RADWT coefficient (d1). The N is evaluated as
( ( , ) ) 0.6745 median d i j N
(9)
III. PROPOSED METHOD
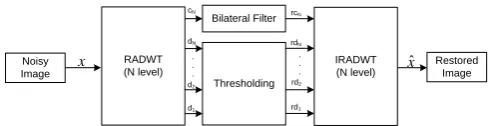
The proposed RADWT based denoising method consists of the three steps as shown in Fig. 3: 1) select the appropriate filter, number of decomposition level, dilation factors (p and q) and high pass sampling factor (s), to compute the RADWT noisy coefficient from the input noisy signal. 2) select and perform the appropriate filtering algorithm on these RADWT noisy coefficients, to get the modified RADWT coefficients, and 3) finally obtain the reconstructed signal by taking inverse RADWT of these manipulated RADWT coefficients.
Let x i j( , ) is the input noisy image signal on which a rational-dilation wavelet transform (WRADWT) is applied. After applying the rational-dilation wavelet transform (RADWT) at different levels, it is decomposed into a set of the RADWT coefficient as a vector of
consisting of N subbands with different spectral resolution such as( , ) ( , )
WRADWTx i j i j (10) where [d d d1 2 3, , ,...,dN N,c ] and N[d d d1 2 3, , ,...,dN] The noise and significant part of the image exist in the different subband of RADWT coefficient.
Restored Image Noisy Image Bilateral Filter Thresholding RADWT (N level) IRADWT (N level) d1 d2 dN
cN rcN
rdN
rd2
rd1
[image:3.595.303.550.715.778.2]x xˆ
High frequency noise mainly exists in the lower stage coefficient (d1). On the other hand, in the last stage coefficient (cN) noise is negligible. Thus, performing the appropriate filtering in each layer suppress the noise effectively without degrading the signal which are varying very slowly.
After this a bilateral filter (BLF) is applied on the RADWT coefficient of the final stage i.e. low frequency component
c
N and rest of all the RADWT coefficients i.e.N
is thresholded by appropriate thresholding technique (THR).( )
rcNBLF cN and rNTHR(N) (11) where rN
rd rd rd1, 2, 3,...,rdN
After applying these two filtering techniques, the modified filtered RADWT coefficients are obtained, which can be expressed as
, 1, 2, 3,..., ,
r rN rcN rd rd rd rdN rcN (12) Finally, the inverse rational-dilation wavelet transform (WRADWT1 ) is applied on the filtered coefficients to reconstruct the approximation of the noisy image signalx i jˆ( , ).
1
ˆ( , ) ( )
x i j W r RADWT
(13)
IV. RESULTS AND DISCUSSIONS
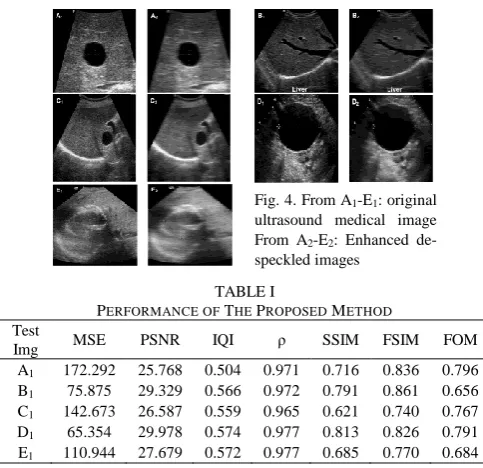
[image:4.595.46.288.557.791.2]To analyze the noise suppression and edge preservation capability of the proposed approach, different performance indices have been used. The MSE and PSNR are the parameters to measure the noise suppression capability; however, it cannot be optimal with respect to perceived quality or reflect the performance of edge preservation capability of the denoising approaches. Hence, other performance measures like ρ,IQI [33], SSIM [34] and FSIM [35] have been used to measure the closeness of the fine details in denoised image with respect to the original image. For the quantitative evaluation of the edge preservation in denoised image, Pratt’s figure of merit (FOM) [5] is most commonly used parameter with Canny operator. The results have been compared on the basis of all these performance indices computed for various images.
Fig. 4. From A1-E1: original ultrasound medical image From A2-E2: Enhanced de-speckled images
TABLE I
PERFORMANCE OF THE PROPOSED METHOD
Test
Img MSE PSNR IQI ρ SSIM FSIM FOM A1 172.292 25.768 0.504 0.971 0.716 0.836 0.796 B1 75.875 29.329 0.566 0.972 0.791 0.861 0.656 C1 142.673 26.587 0.559 0.965 0.621 0.740 0.767 D1 65.354 29.978 0.574 0.977 0.813 0.826 0.791 E1 110.944 27.679 0.572 0.977 0.685 0.770 0.684
A. Experiment 1
To analyze the effectiveness of this proposed approach different speckled ultrasound medical image, shown in Fig. 4 (from A1 to E1), were processed. Test images were acquired from a medical image database available at website http://ra d.usuhs.edu/medpix/parent.php3?mode=image_atlas and htt p://www.ultrasound- cases.info/Category.aspx?cat=73. The analysis has been performed on several ultrasound medical images to evaluate the validity of the proposed method.
The performance of the proposed method depends on the number of decomposition level (J), dilation factor (p and q) and high pass sampling factor (s) of RADWT decomposition,dand rof bilateral filter. The best optimal values of these parameters are determined by performing the successive experiments on the processed ultrasound medical images. The speckled ultrasound images are processed using proposed method with optimal values J=4, p=3, q=4, s=2 for RADWT decomposition, window size=11×11, d=1.8 and r=2n for performing bilateral filter. For visualization, the despeckled images obtained using proposed method, are shown in Fig. 4 (from A2 to E2). Visual study of the processed image by the proposed method shows that speckles are reduced at the cost of appearance of the image textures. Apart from the visualization, the performance has been extensively analyzed and evaluated based on the obtained values of the performance indices as mentioned above. Here five different ultrasound images are used in Table I, to check the effectiveness of the proposed RADWT based method.
B. Experiment 2
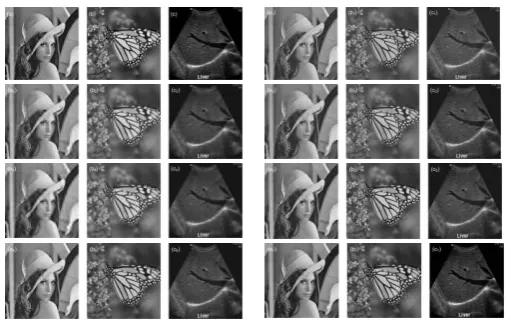
To analyze the robustness of the proposed approach, three standard test images, shown in Fig. 5(a-c), have been used. All these images are initially corrupted by simulated Gaussian random noise of different standard deviation and later denoised by the proposed and other existing methods. Comparative visual performance of the proposed method with other alternative methods is shown in Fig. 5 which shows that the proposed method is not only suitable in suppressing the noise but it also maintains the resolution in the denoised image against the other available methods. The different performance indices of the proposed method against the existing denoising method for three different test images with different noise levels are given in Table II to Table V for the performance comparisons of noise suppression, features and edges preservation. From the quantitative results of the Table II, it can be observed the proposed method yield the highest values of PSNR and the lowest values of MSE, which indicate the more suppression of noise.
Fig. 5. Comparative performance of the proposed method with other alternative methods
1: Noisy image used in experimentation
2: Wavelet transform combine with wiener filter (M-1) 3: Wavelet transform with hard thresholding (M-2) 4: Wavelet transform with soft thresholding (M-3) 5: Wavelet transform with bilateral filter (M-4) 6: Wavelet transform with total variation filter (M-5) 7: Proposed method (M-6)
Table V shows the edge preservation quality of the proposed approach with the higher value of the FOM. From the quantitative results, it is observed that the proposed RADWT based method has not only the highest FOM value but also it has the value closer to unity which means the edges are well preserved using the proposed method in this paper. It also indicates that the improvement in noise suppression is not at the cost of edge loss.
V. CONCLUSION
In this paper, rational-dilation wavelet transform based non-linear filtering approach has been presented with appropriate thresholding scheme on the noisy medical ultrasound images as well as on different standard test images. In this proposed method variation in frequency resolution features of rational-dilation wavelet transform are utilized and image is decomposed into different noisy subbands at different stages. Bilateral filtering of the final stage coefficient suppresses the large amplitude noise components and thresholding provide the rest modified threshold coefficients which improves the denoising efficiency. It can be seen from the results that for almost all the denoised image used here with various noise levels, there is an improvement in MSE, PSNR, IQI, ρ, SSIM, FSIM and FOM as compared to the other considered technique. Further, in the proposed approach there is not only improvement in the noise suppression but also features and edges preservation performance indices get enhanced. The experimental results also show that the proposed method yields significant improvement in visual quality and outperforms many tested methods.
REFERENCES
[1] A. P. Dhawan, Medical image analysis.: John Wiley & Sons Inc., 2003.
[2] C. B. Burckhardt , "Speckle in ultrasound B-mode scans," IEEE Transaction on Sonics and Ultrasonics, vol. SU-25, pp. 1-6, 1978.
[3] J.G. Abbott and F. L. Thurstone, "Acoustic speckle: Theory and experimental analysis," Ultrasonic Imaging, vol. 1, no. 4, pp. 303-324, 1979.
[4] J. U. Quistgaard, "Signal acquisition and processing in medical diagnostic ultrasound," IEEE Signal Processing Magazine, vol. 14, no. 1, pp. 67-74, 1997.
[5] W.K. Pratt, Digital image Processing, John Wiley and Sons, 2006.
[6] T. Loupas, "An adaptive weighted median filter for speckle suppression in medical ultrasonic images ," IEEE Transactions on Circuits and Systems, vol. 36, no. 1, pp. 129-135, 1989.
[7] R.C. Gonzalez and R.E. Woods, Digital image processing.: Prentice-Hall, 2001.
[8] Tao Chen and Hong Ren Wu, "Adaptive impulse detection using center-weighted median filters," IEEE Signal Processing Letters, vol. 8, no. 1, pp. 1-3, 2001.
[9] S. Marshall, "New direct design method for weighted order statistic filters," IEE Proc.-Vision, Image and Signal Processing, vol. 151, no. 1, pp. 1-8, 2004.
[10] D.T. Kuan, A.A. Sawchuk, T.C. Strand, and P. Chavel, "Adaptive noise smoothing filter for images with signal depndent noise," IEEE Transaction on Pattern Analysis and Machine Intelligence, vol. 7, no. 2, pp. 165-177, 1985.
[11] J.S. Lee, "Digital image enhancement and noise filtering by use of local statistics," IEEE Transaction on Pattern Analysis and Machine Intelligence, vol. 2, no. 2, pp. 165-168, 1980.
[12] V. S. Frost, "A model for radar images and its application to adaptive digital filtering of multiplicative noise," IEEE Transactions onPattern Analysis and Machine Intelligence, vol. PAMI-4, no. 2, pp. 157-166, 1982.
[13] Yongjian Yu and S.T. Acton, "Speckle reducing anisotropic diffusion," IEEE Transaction on Image Processing, vol. 11, no. 11, pp. 1260-1270, Nov. 2002.
[14] P. Perona and J. Malik, "Scale space and edge detection using anisotropic diffusion," IEEE Transaction on Pattern Analysis and Machine Intellegence, vol. 12, no. 7, pp. 629-639, July 1990.
[15] D. Mittal, V. Kumar, S.C. Saxena, N. Khandelwal, and N. Karla, "Enhancement of the ultrasound images by modified anisotropic diffusion method," Springer, Medical and Biological Engineering and Computing, vol. 48, no. 12, pp. 1281-1291, 2010.
[16] X. Liu, J. Liu, X. Xu, L. Chun, and Y. Deng, "A robust detail preserving anisotropic diffusion for speckle reduction in ultrasound images," BioMed Central Genomics, vol. 12, pp. 1-10, 2011.
[17] D. L. Donoho and I. M. Johnstone, "Ideal spatial adaptation by wavelet shrinkage," Biometrika, vol. 81, no. 3, pp. 425-455, 1994.
[18] D. L. Donoho and I. M. Johnstone, "Adapting to unknown smoothness via wavelet shrinkage," Journal of the American Statistical Association, vol. 90, no. 432, pp. 1200-1224, 1995.
[19] D.L. Donoho, "De-noising by soft thresholding," IEEE Transaction on Information Theory, vol. 41, no. 3, pp. 613-627, 1995.
[20] Savita Gupta, R.C. Chauhan, and S.C. Saxena, "Wavelet based statistical approach for speckle reduction in medical ultrasound images," Medical & Biological Engineering & Computing, vol. 42, pp. 189-192, 2004.
[21] Imola K. Fodder, C. Kamath, and R. Kamath, "Denoising through wavelet shrinkage: An empirical study ," Journal of Electronic Imaging, pp. 1-16, 2001.
[22] Alin Achim, Anastasios Bezerianos, and Panagiotis Tsakalides, "Novel bayesian multiscale method for speckle removal in medical ultrasound images," IEEE Transactions on Medical Imaging, vol. 20, no. 8, pp. 772-783, 2001.
[23] S. G. Chang, Bin Yu, and M. Vetterli, "Adaptive wavelet thresholding for image denoising and compression," IEEE Transactions on Image Processing, vol. 9, pp. 1532-1546, 2000.
[24] O.V. Michailovich and A. Tannenbaum, "Despeckling of medical ultrasound images," IEEE Transactions on Ultrasonics, Ferroelectrics, and Frequency Control, vol. 53, , pp. 64-78, 2006.
[25] G. G. Bhutada, R. S. Anand, and S. C. Saxena, "Fast adaptive learning algorithm for sub-band adaptive thresholding function in image denoising," International Journal of Computational Intelligence Studies , vol. 1, no. 3, pp. 227-241, 2010.
[image:5.595.41.302.49.210.2]Trends in Engineering and Technology , 2008, pp. 20-25.
[27] B. A. Abrahim and Y. Kadah, "Speckle noise reduction method combining total variation and wavelet shrinkage for clinical ultrasound imaging," Proc. 1st Middle East Conference on Biomedical Engineering (MECBME), 2011, pp. 80-83.
[28] C. Tomasi and R. Manduchi , "Bilateral filtering for gray and color images," Proc. Sixth International Conference on Computer Vision , 1998, pp. 839-846.
[29] C. S. Anand and J. S. Sahambi, "Wavelet domain non-linear filtering for MRI denoising," Magnetic Resonance Imaging, vol. 28, no. 6, pp. 842-861, 2010.
[30] R. Vanithamani and G. Umamaheswari, "Wavelet based despeckling of medical ultrasound images with bilateral filter," Proc.IEEE Region 10 Conference TENCON, 2011, pp. 389-393.
[31] I. Bayram and I. W. Selesnick, "Frequency-domain design of overcomplete rational-dilation wavelet transforms," IEEE Transactions on Signal Processing, vol. 57, no. 8, pp. 2957-2972, 2009.
[32] M. Zhang and B. K. Gunturk, "Multiresolution bilateral filtering for image denoising," IEEE Transaction on Image Processing, vol. 17, no. 12, pp. 2324-2332, 2008.
[33] Zhou Wang and A.C. Bovik, "A universal image quality index," IEEE Signal Processing Letters, vol. 9, no. 3, pp. 81-84, 2002.
[34] Z. Wang, A.C. Bovik, H.R. Sheikh, and E.P. Simoncelli, "Image quality assessment: from error visibility to structural similarity," IEEE Transaction on Image Processong, vol. 13, no. 4, pp. 600-612, April 2004.
[35] Lin Zhang, Lei Zhang, X. Mou, and David Zhang, "FSIM: A feature similarity index for image quality assessment," IEEE Transactions on Image Processing, vol. 20, no. 8, pp. 2378-2386, August 2011.
TABLE II
COMPARATIVE NOISE SUPPRESSION PERFORMANCE AT NOISE LEVEL 10,20AND 30
Image Noise Level
MSE PSNR
M-1 M-2 M-3 M-4 M-5 M-6 M-1 M-2 M-3 M-4 M-5 M-6
a
10 90.5568 75.3098 137.1061 48.6437 35.0236 27.1173 28.5616 29.3623 26.7603 31.2606 32.6873 33.7983 20 154.7229 114.9608 182.7242 104.0916 78.3991 59.3841 26.2353 27.5254 25.5129 27.9567 29.1877 30.3941 30 255.7572 155.6101 220.4036 156.5352 127.5721 94.6711 24.0526 26.2105 24.6987 26.1847 27.0733 28.3686
b
10 169.1255 77.1727 160.2917 73.0475 52.2545 35.115 25.8488 29.2562 26.0817 29.4948 30.9496 32.6759 20 238.1844 153.7965 268.6348 153.9734 116.2726 68.6911 24.3617 26.2614 23.8392 26.2564 27.4761 29.7618 30 345.8139 223.8306 367.6727 235.4674 189.033 119.264 22.7424 24.6317 22.4762 24.4115 25.3655 27.3657
c
10 80.1851 53.3617 86.5882 38.46 27.6478 15.8818 29.0899 30.8586 28.7563 32.2808 33.7143 36.1218 20 137.3674 86.9779 119.4196 84.9357 66.0515 38.5518 26.752 28.7368 27.3601 28.84 29.932 32.2704 30 234.7405 116.8862 146.9461 127.5021 111.0218 72.789 24.425 27.4532 26.4593 27.0757 27.6768 29.5101
TABLE III
COMPARATIVE FEATURE PRESERVATION PERFORMANCE AT NOISE LEVEL 10,20AND 30
Image Noise Level
IQI ρ
M-1 M-2 M-3 M-4 M-5 M-6 M-1 M-2 M-3 M-4 M-5 M-6
a
10 0.5388 0.5588 0.4691 0.6751 0.6997 0.7254 0.9801 0.9835 0.97 0.9894 0.9924 0.9941 20 0.437 0.4996 0.4189 0.5456 0.5669 0.6171 0.9658 0.9747 0.9596 0.9772 0.9828 0.987 30 0.3607 0.4475 0.3836 0.4538 0.4744 0.5556 0.9442 0.9655 0.9509 0.9654 0.9718 0.9792
b
10 0.5374 0.6232 0.5642 0.6799 0.713 0.7204 0.9597 0.9812 0.9634 0.9825 0.9878 0.9916 20 0.4534 0.5637 0.5007 0.5889 0.6049 0.612 0.941 0.9622 0.9367 0.963 0.9722 0.9833 30 0.3867 0.5219 0.4498 0.5132 0.525 0.5502 0.913 0.9447 0.911 0.9429 0.9538 0.9708
c
10 0.3819 0.4852 0.3485 0.581 0.6293 0.6922 0.9691 0.9796 0.967 0.9855 0.9896 0.9941 20 0.313 0.3664 0.2743 0.4263 0.4892 0.609 0.9472 0.9665 0.954 0.9674 0.9747 0.9854 30 0.25 0.3109 0.2391 0.3394 0.3848 0.5239 0.9128 0.9548 0.9429 0.9505 0.957 0.9723
TABLE IV
COMPARATIVE FEATURE PRESERVATION PERFORMANCE AT NOISE LEVEL 10,20AND 30
Image Noise Level
SSIM FSIM
M-1 M-2 M-3 M-4 M-5 M-6 M-1 M-2 M-3 M-4 M-5 M-6
a
10 0.8407 0.8556 0.7926 0.9248 0.942 0.9503 0.9134 0.9207 0.8774 0.9543 0.9689 0.9759 20 0.787 0.8101 0.7484 0.8548 0.8808 0.8812 0.9002 0.8973 0.8515 0.9132 0.939 0.9426 30 0.717 0.7671 0.7131 0.7948 0.8241 0.8463 0.8805 0.8776 0.8317 0.883 0.9146 0.9213
b
10 0.8278 0.9331 0.8888 0.951 0.9596 0.961 0.8751 0.94 0.8983 0.9548 0.9662 0.9789 20 0.7835 0.8851 0.8322 0.9 0.9126 0.9213 0.8627 0.8947 0.8552 0.9095 0.9302 0.9441 30 0.7235 0.8459 0.7836 0.8488 0.8617 0.8812 0.8429 0.8628 0.8243 0.8773 0.8994 0.9014
c
10 0.7373 0.802 0.7131 0.8746 0.9113 0.9324 0.8479 0.8971 0.8087 0.917 0.9475 0.9731 20 0.6725 0.7064 0.6424 0.7535 0.808 0.834 0.8424 0.8423 0.7653 0.8425 0.8976 0.9431 30 0.5962 0.6416 0.5939 0.6734 0.7168 0.7332 0.8334 0.818 0.7468 0.8019 0.8621 0.9071
TABLE V
COMPARATIVE EDGE PRESERVATION PERFORMANCE AT NOISE LEVEL 10,20AND 30
Image Noise Level
FOM
M-1 M-2 M-3 M-4 M-5 M-6
a
10 0.8171 0.8045 0.7303 0.808 0.8544 0.9021 20 0.7035 0.7777 0.6627 0.7374 0.8048 0.817 30 0.5566 0.7275 0.5937 0.7003 0.7726 0.7728
b
10 0.7597 0.8947 0.8121 0.8793 0.9168 0.9313 20 0.704 0.7884 0.757 0.8268 0.872 0.8732 30 0.6682 0.7593 0.7221 0.7763 0.824 0.8331
c