i
The effects of scale and context-dependency on the outcome of
experiments investigating soil carbon dynamics
John Alfred Crawford
Lancaster Environment Centre
Lancaster University
Submitted for the degree of Doctor of Philosophy
ii Declaration
I herewith declare that this thesis is my own work, and that it has not previously
been presented to obtain a degree in any form.
Work presented in Chapter 5 entitled “Experimental scale alters the response of
soil respiration to litter addition” used data from mesocosm and field plots at
Wytham Woods, Oxfordshire, UK, which were established and maintained as part
of a collaborative ERC-funded project titled “ForestPrime” (ERC Grant Agreement
No. 307888) with Luis Lopez-Sangil, Eduardo Medina-Barcenas, Catherine
Baxendale, Charles George, Ali Birkett, Laëtitia Bréchet and Emma Sayer. The
hypothesis-testing, data analysis and interpretation of results presented in
Chapter 5 are all my own work. The aforementioned collaborators have given their
permission for these data to be used and presented in this thesis.
This thesis word length is 27262, and therefore does not exceed the permitted
maximum.
John Alfred Crawford,
iii Acknowledgements
The research leading to these results has received funding from the European
Research Council under the European Union's Seventh Framework Programme
(FP/2007-2013) / ERC Grant Agreement No. 307888. I would also like to thank
the support of Western Ag Innovations for awarding me with an award for PRS
probes and analysis.
Firstly, I would like to thank Emma Sayer for all her guidance and support during
this project. I am incredibly grateful for the fantastic opportunity she gave me in
undertaking this research. Her enthusiasm, passion for research, and taste in
music have made the time during my PhD truly enjoyable. I feel very lucky to have
been her student.
I would also like to thank Eduardo Medina-Barcenas and Luis Lopez-Sangil for
their help, support and friendship throughout my PhD. It has been a pleasure
working with you and I will always remember our time working in the woods,
seeing the seasons change and talking about anything and everything.
I am also indebted to everyone in the plant-soil lab, especially Nick Ostle for his
advice and support whenever I needed it, and our lab manager Annette Ryan
without whom this research would not have been possible.
Finally, I would like to thank my family and friends who have supported me and
iv The effects of scale and context dependency on the outcome of experiments investigating soil carbon dynamics
John Alfred Crawford
Lancaster Environment Centre, Lancaster University
Submitted for the degree of Doctor of Philosophy
September 2017
Summary
Soil carbon dynamics and plant-soil interactions are an integral part of
ecosystem function and understanding the effects of perturbations on these
processes is vital if we are to predict the future of ecosystems under global
environmental change. However, it is often challenging to study complex
processes at the ecosystem-scale, due to high natural variability. Microcosm
experiments offer a way to study soil processes under controlled conditions but
common techniques to reduce environmental heterogeneity in laboratory
microcosms can also alter soil properties, which may affect the outcome of
experiments. This provides a challenge for research to develop a robust
understanding of soil processes and to establish how scale and context may alter
the outcome of experiments. The overarching aim of this thesis was to explore the
effect of context and experimental scale on the outcome of experiments
investigating soil carbon dynamics and plant-soil interactions. I conducted a series
of microcosm experiments exploring the effect of common soil processing
techniques on soil properties and function, as well as a comparative study across
v
dramatically altered soil properties compared to fresh soil. None of the measured
soil properties recovered to fresh soil values during a 60-day microcosm
experiment. Despite consistent overall trends in soil properties, the recovery
trajectories varied among soils from different sites, which presents a challenge for
comparative studies using sieved and air-dried soils. Importantly, sieving and
drying also increased soil respiration, ion exchange rates and the magnitude of the
respiratory response to litter addition treatments. Finally, soil respiration and soil
properties differed substantially across experiments at different scales. Peak soil
carbon release by priming effects in response to litter addition was ten-fold higher
in microcosms compared to in situ mesocosms or field plots, and experimental
scale had a greater effect on soil respiration than litter addition treatments.
Microcosm studies remain a crucial part of ecological research into soil
carbon dynamics and plant-soil interactions. However, my results show that
experimental scale and context-dependency can alter the outcome of experiments.
Future research should aim to find a compromise between a reductionist approach
to test detailed mechanisms and representative experiments that better simulate
vi Table of Contents
Chapter 1. The effects of scale and context dependency on the outcome of
experiments investigating soil carbon dynamics ... 1
1.1 Introduction ... 1
1.2 Scaling and context dependency in studies of plant-soil interactions ... 3
1.3 A prime example ... 6
1.4 The mechanisms and controls of priming effects ... 9
1.5 Thesis objectives... 15
Chapter 2. Methods ... 16
2.1 Introduction ... 16
2.2 Overview of experiments ... 16
2.3 Soil sampling ... 17
2.4 Microcosm design ... 17
2.4.1 a) The influence of microcosm size on CO2 efflux and the rate of water loss from the soil. ... 18
2.4.2 b) The effect of different lids on the rate of water loss and CO2 efflux 19 2.4.3 Incubation conditions ... 22
2.4.4 Microcosms with intact cores ... 22
vii
2.5 Soil respiration measurements ... 23
2.6 Chemical and physical soil properties... 25
2.6.1 Total soil microbial biomass ... 25
2.6.2 KCl-extractable Ammonium and Nitrate ... 26
2.6.3 PRS Probe analysis ... 27
2.6.4 Soil pH ... 27
2.6.5 Gravimetric water holding capacity ... 28
Chapter 3. Soil properties do not recover after sieving and drying ... 29
3.1 Abstract ... 29
3.2 Introduction ... 30
3.3 Materials and method ... 33
3.3.1 Study sites... 33
3.3.2 Soil sampling ... 35
3.3.3 Incubation design ... 35
3.3.4 Soil properties ... 36
3.3.5 Data analyses ... 37
3.4 Results ... 38
3.5 Discussion ... 46
3.6 Conclusions ... 48
viii
4.1 Abstract ... 50
4.2 Introduction ... 51
4.3 Methods ... 54
4.3.1 Study site and experimental design ... 54
4.3.2 Data analysis ... 58
4.4 Results ... 60
4.5 Discussion ... 68
4.6 Conclusions ... 72
Chapter 5. Experimental scale alters the response of soil respiration to litter addition ... 73
5.1 Abstract ... 73
5.2 Introduction ... 74
5.3 Methods ... 77
5.3.1 Study site and experimental design ... 77
5.3.2 Litter treatments ... 79
5.3.3 Soil CO2 efflux measurements ... 80
5.3.4 Soil properties ... 81
5.3.5 Data analysis ... 82
5.4 Results ... 86
5.5 Discussion ... 94
ix
Chapter 6. General Discussion ...100
Bibliography ...105
x List of Figures
Figure 2.1. The results from the preliminary study comparing water loss and soil
CO2 efflux in different sized soil microcosms………..………..…………21
Figure 2.2. Microcosm designs………...……….23
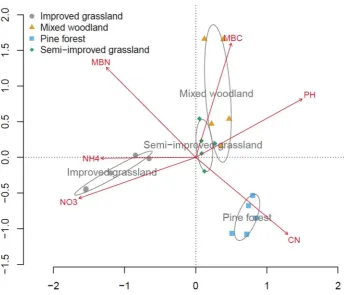
Figure 3.1. Redundancy analysis (RDA) showing the separation of four study sites based on initial soil properties………..………40
Figure 3.2. Comparing fresh soil properties with soil properties after sieving and air-drying………...43
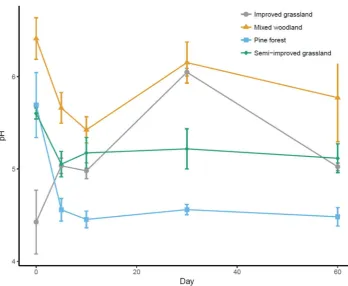
Figure 3.3. Comparing fresh Soil pH with soil pH after sieving and air-drying………...…44
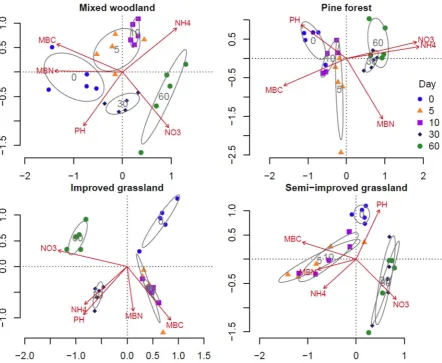
Figure 3.4. Redundancy analysis (RDA) showing the separation of sampling time point grouped by soil properties across each of the four study
sites……….……..45
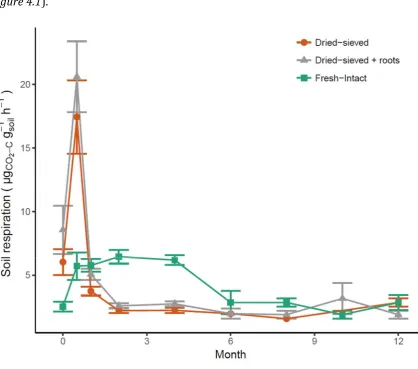
Figure 4.1. The evolution of soil respiration from microcosms with soils that have been dried and sieved (Dsieved; orange circles), dried and sieved with roots included
(Dsieved+roots; grey triangles), or with fresh intact soil cores (Fintact; green squares)
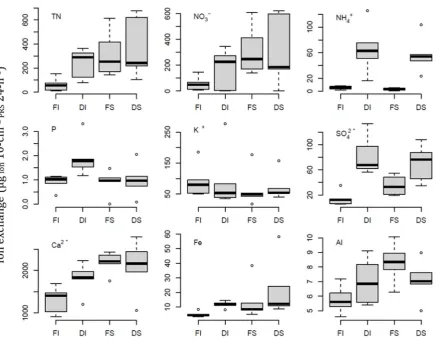
xi Figure 4.2. The effect of soil pre-treatments (sieving and drying) on ion exchange
rates measured during a 24-h burial period using PRS™
probes………....……..62
Figure 4.3. Ordination plot (redundancy analysis) showing the separation of microcosms containing soils subjected to sieving and drying treatments based on
soil ion exchange………...………64
Figure 4.4. Basal soil respiration in dried-intact (DI; orange line with squares), dried-sieved (DS; pink lines with triangles), fresh-intact (FI; green lines with
squares) and fresh-sieved (FS; blue lines with circles) microcosms during a 30-day
incubation………..65
Figure 4.5. Soil respiration in microcosms containing fresh-intact (FI) soil cores, dried-intact soil cores (DI), fresh-sieved soils (FS) and dried-sieved soils
(DS)………....66
Figure 4.6. Changes in soil respiration in dried-intact (DI), dried-sieved (DS), fresh-intact (FI) and fresh-sieved (FS) microcosms during a 30-day incubation in
response to double litter (2L) and single litter additions (1L), expressed as log
response ratio relative to control treatments without litter inputs
(0L)………67
xii
subjected to litter removal (0L) and litter addition (2L)
treatments………...……..89
Figure 5.2. Soil respiration (CO2 efflux) in microcosms with dried sieved soil
(Dsieved), fresh sieved soil (Fsieved) or fresh intact soil (Fintact) compared to in situ
mesocosms and field plots subjected to three levels of litter addition………..….91
Figure 5.3. The response of soil respiration (CO2 efflux) to double litter (2L) and
zero litter (0L) inputs in microcosms with dried sieved soil (Dsieved), fresh sieved
soil (Fsieved) or fresh intact soil (Fintact) compared to in situ mesocosms and field
plots………..……….92
Figure 5.4. Peak soil C release with priming effects in microcosms with dried sieved soil (Dsieved), fresh sieved soil (Fsieved) or fresh intact soil (Fintact) compared
to in situ mesocosms and field plots……….………..94
Figure 5.5. The total amount of C released per day by priming effects (PETOT) in
microcosms with dried sieved soil (Dsieved), fresh sieved soil (Fsieved) or fresh intact
soil (Fintact) compared to in situ mesocosms and field plots………95
Figure Appendix 1.1. The total amount of C released per day by priming effects (PETOT) in microcosms with dried sieved soil (Dsieved), fresh sieved soil (Fsieved) or
fresh intact soil (Fintact) compared to in situ mesocosms and field plots. In addition
xiii
12 months of field data to ensure that the optimum time period of field data was
xiv List of Tables
Table 1.1. Summary details of published studies of priming effects that highlights the wide range of experimental scales, durations and substrate additions that are
used to explore priming effects………8
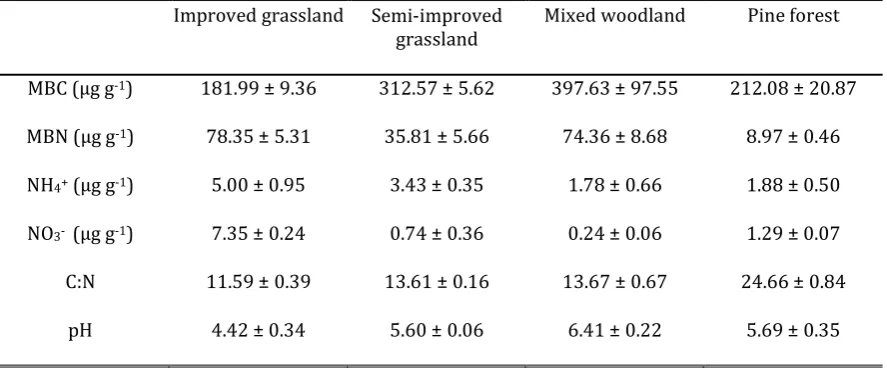
Table 3.1. Fresh soil properties at T0 for each of the four study sites……...…………39
Table 5.1. Soil properties (0-10 cm depth) in experiments at different scales (laboratory microcosms, in situ mesocosms and large-scale field plots) subjected
1
Chapter 1. The effects of scale and context dependency on the
outcome of experiments investigating soil carbon dynamics
1.1 Introduction
Scale has long been an issue within ecological research (Arrhenius, 1921;
Gleason, 1922; Levin, 1992; Wiens, 1989) because ecological processes have
characteristic spatial and temporal scales (Levin, 1992; Urban, 2005). Large
spatial scales generally incorporate a greater amount of abiotic and biotic
heterogeneity than small scales (Underwood, Hambäck, & Inouye, 2005). This
leads to challenges when interpreting ecological research across different scales
and incorporating data in models to predict the impacts of environmental change.
Scaling relationships have been explored across a range of different ecosystems
and usually focus on the spatial patterns of communities, diversity and species
distributions (Cushman & Landguth, 2010; Underwood et al., 2005). Importantly,
scaling relationships are often explored using observational data, whereas the
effects of experimental scale on the outcome of manipulative studies remain
unclear.
Experiments and observational studies often focus on either the fine detail
at small scales or on much broader ecosystem processes at large scales, where the
scale of a study is defined by its ‘extent’ and ‘grain’. The ‘extent’ refers to the overall
area or time a study encompasses, whereas the ‘grain’ refers to the smallest
individual units measured within the experiment (Englund & Cooper, 2003;
Wiens, 1989). The ‘extent’ and ‘grain’ of any ecological study constrains the
2
extrapolation beyond the experimental design (‘extent’). When extrapolating data
beyond the ‘extent’ of a study, either temporally or spatially, threshold effects and
other non-linear phenomena can cause changes in processes (Agren, McMurtrie,
Parton, Pastor, & Shugart, 1991; Cushman, Littell, & McGarigal, 2010).
Consequently, predictions relying on one level of scale to represent a process at
another, larger, scale are unlikely to be reliable (Agren et al., 1991; Levin, 1992).
In order to extrapolate results from small scales, scaling relationships need to be
clearly identified (Wiens, 1989) to determine when and how the experimental
scale will affect results (Strengbom, Englund, & Ericson, 2006). To achieve this,
experiments should be designed to explore ecological processes across a range of
scales; assessing the relevance of data derived from smaller scales by comparing
it to the results of larger scales (Hewitt, Thrush, Dayton, & Bonsdorff, 2007). These
types of experiments covering multiple ecological scales are rare as they are often
costly and logistically challenging. Nonetheless, data extrapolated from small
scales is often used to aid modelling efforts in order to understand the implication
of large-scale perturbations such as climate and land-use changes.
Ecological systems can demonstrate plasticity in their response to
perturbations, which can result in "alternative stable states" (Suding, Gross, &
Houseman, 2004). The theory of alternative stable states describes the ability of
ecosystems to exist in several different states of equilibrium with phase shifts
being controlled by resistance and resilience (Beisner, Haydon et al. 2003).
Resistance is the ability of an ecosystem to tolerate disturbance pressures and
maintain function and community structure, whereas resilience is the capacity of
an ecosystem to recover after disturbance has caused losses of function or
3
produce the context dependency we observe in ecological studies as ecosystems
have the potential to adopt multiple different points of equilibrium (May 1977).
This theory can be applied to all ecological scales; from global biome regime shifts
to microcosm experiments in the laboratory.
1.2 Scaling and context dependency in studies of plant-soil interactions
Considerations of scaling and context-dependency could be particularly
important for studies of plant-soil interactions because their underlying
mechanisms take place on a molecular level between individual microorganisms
competing for resources (Kardol, Veen, Teste, & Perring, 2015) and yet changes to
plant-soil interactions could have global consequences (Van Der Putten et al.,
2009). Plant-soil interactions are integral to many ecosystem processes (Van Der
Putten et al., 2009) and include complex feedbacks and controlling mechanisms
between above- and belowground components, as well as wider abiotic controls
(Wardle, 2004). These interactions are often highly context specific, which makes
determining their mechanisms and their relevance within wider ecosystem
functioning challenging. However, the inclusion of data describing plant-soil
interactions is a vital component of ecological modelling if we are to understand
the implication of environmental change on ecosystem function (Ostle et al., 2009).
Experiments exploring plant-soil interactions are commonly designed
around three main scales; Field plots, mesocosms and microcosms. Field plots
represent the largest scale commonly used to investigate plant-soil interactions
(Crow et al., 2009; Sayer, Heard, Grant, Marthews, & Tanner, 2011; Sulzman, Brant,
Bowden, & Lajtha, 2005). They provide in situ conditions with which to test
4
and the real-world importance of ecological processes. However, the natural
heterogeneity of ecosystems and the effects of abiotic controls, such as seasonal
cycles and weather, often limit the ability of field experiments to determine
detailed mechanisms. To control for some of this variability, soil mesocosms are
often used to improve experimental control and focus in on specific mechanisms
of a plant-soil interaction (Fu & Cheng, 2002; Roque-Rivera, Talhelm, Johnson,
Chiang, & Pregitzer, 2011). Hence, soil mesocosms provide a good compromise
between controlling heterogeneity and maintaining semi-natural conditions when
established in situ. Finally, microcosms represent the smallest scale that is
commonly used to study soil processes, and they provide the most controlled and
reductionist system in which to test hypotheses and determine mechanisms
(Blagodatskaya, Blagodatsky, Anderson, & Kuzyakov, 2007; Fontaine et al., 2007;
Hamer & Marschner, 2005a). Microcosms are usually used to investigate soil
microbial and chemical processes that drive plant-soil interactions at larger scales.
When all scales are used together, each one can provide valuable data across
different domains of scale for determining the mechanisms, controls and
real-world relevance of plant-soil interactions.
Due to the complexity and heterogeneity of plant-soil interactions in the
field, much of the work exploring the mechanisms and controls of these
interactions has been carried out in lab microcosms (Fontaine et al., 2011; Mary,
Fresneau, Morel, & Mariotti, 1993; Waldrop & Firestone, 2004). However, great
consideration must be given to understanding the limitations of these small,
artificial and disturbed systems. For studies of plant-soil interactions, soil
properties and characteristics in microcosms can differ substantially from field
5
experiments can alter the availability and physical protection of soil organic
matter, as well as the structure and activity of the microbial community. Indeed,
the common procedures of sieving, drying and rewetting soils for laboratory
incubations have large impacts on microbial community structure as well as on
the rates of soil respiration and nutrient availability (Petersen & Klug, 1994; Ross,
Speir, Tate, & Orchard, 1985; Thomson, Ostle, McNamara, Whiteley, & Griffiths,
2010). The disturbance caused by soil sampling, storage and processing, alongside
the drastic changes in soil structure, aeration and surface area imposed by many
microcosm experiments, may drive our ‘model’ soil system away from field-like
conditions towards thresholds of alternative stable states (Beisner, Haydon, &
Cuddington, 2003; Schröder, Persson, & De Roos, 2005). Observed mechanisms
and processes in microcosms may therefore be dominated by artefacts of sample
processing and artificial environmental conditions, which would dramatically
limit their use in describing real-world processes.
Temporal scale presents similar challenges to the issues of spatial scale
particularly in plant-soil interactions, which are some of the most heterogeneous
processes within ecosystems (S. K. Schmidt et al., 2007). Soil samples that are
collected only a few months apart, or before and after weather events, can
demonstrate different properties and microbial communities (Bardgett, Bowman,
Kaufmann, & Schmidt, 2005; Bardgett, Lovell, Hobbs, & Jarvis, 1999; Rochette,
Desjardins, & Pattey, 1991; S. K. Schmidt et al., 2007). Much of this variation occurs
due to seasonal changes in climate and differences in plant inputs from litter and
root exudation, resulting in greater context-dependency of experiments involving
6
The context of an experiment is a broad term that can encompass many
aspects of biotic and abiotic conditions. For example, temperature can vary
dramatically between sites or over time and may have a large impact on the
outcome of biological processes. Therefore, temperature may provide important
context when trying to understand a biological process. In addition to naturally
occurring properties and conditions, the context of an experiment can also include
experimental design and setup as well as how samples are treated prior to an
experiment e.g. sampling, storage and processing methods. These factors may
influence the outcome of an experiment and alter biological processes and should
therefore be considered as experimental context. Throughout this thesis, I use this
definition of experimental context to I explore the effects of soil processing in
microcosms.
1.3 A prime example
Some of the issues of scale and context-dependency are illustrated by studies
of the ‘priming effect’, which occurs when inputs of labile organic carbon stimulate
microbial mineralisation of carbon stored in the soil (Bingeman, Varner, & Martin,
1953; Kuzyakov, 2010). Despite its potential impact on soil carbon dynamics
under climate change, the mechanisms governing this interaction are still unclear,
partly because of the lack of comparative studies across different experimental
scales and soil- or ecosystem types (Kuzyakov, Friedel, & Stahr, 2000). First
described in 1926 during studies on the agricultural application of green manure
from legumes (Löhnis, 1925) priming effects remained largely unexplored until
the middle of the 20th century when the use of substrate additions with labelled
7
matter (FOM; Broadbent and Bartholomew, 1949; Bingeman, Varner and Martin,
1953; Jenkinson, 1971; Broadbent and Nakashima, 1974). The potential
importance of priming effects in ecosystem carbon dynamics is clear: increased
carbon inputs to the soil may not necessarily result in greater carbon storage.
Priming effects may represent a particularly important process in regulating
the future carbon balance of forest ecosystems. Forest soils contain the largest
terrestrial pool of carbon (Batjes, 1996), which is regulated through complex
interactions between plants and soil microbial communities. Although much of the
soil carbon pool is stable, environmental change may alter plant-soil interactions
and impact upon the stability of soil carbon, leading to
carbon-cycle-climate-feedbacks (Heimann & Reichstein, 2008). It is widely accepted that climate change
and the effects of elevated atmospheric CO2 will increase net primary productivity
(NPP) resulting in greater plant inputs into the soil (Nemani et al., 2003) but it
remains unclear as to the effect this will have on the stability of soil carbon due to
alterations of plant-soil interactions such as the priming effect (M. W. I. Schmidt et
al., 2011).
Despite the large body of work on priming effects, the underlying
mechanisms and controls remain unclear. This may be because studies exploring
priming effects use a wide range of experimental scales, durations and substrate
additions, making it hard for consistent patterns to be identified (Table 1.1). A
number of studies have variously demonstrated positive (Crow et al., 2009;
Kuzyakov, Ehrensberger, & Stahr, 2001; Sayer et al., 2011; Wu, Brookes, &
Jenkinson, 1993; Zimmerman, Gao, & Ahn, 2011), negative (Cheng, 1996; Jingguo
& Bakken, 1997; Zimmerman et al., 2011) or no priming (Crow et al., 2009; Wu et
8
occurrence and magnitude of priming effects depend on a number of factors such
as experimental scale, the presence of roots, and substrate inputs. The
inconsistency of results in studies of priming effects perhaps also reflects the
complexity of the processes involved and the inherent heterogeneity of soil.
Indeed, it is likely that priming effects and their mechanisms are highly
context-dependent and change with experimental scale and conditions, both in the field
[image:22.595.110.538.439.750.2]and laboratory.
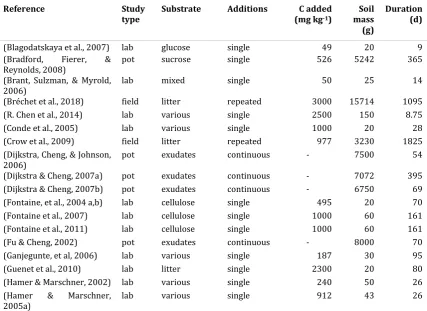
Table 1.1. Summary details of published studies of priming effects that highlights the wide
range of experimental scales, durations and substrate additions that are used to explore priming
effects, where ‘substrate’ is the carbon source added to the soil and ‘additions’ indicates whether
priming was measured in response to a single substrate amendment, repeated additions, or
continuous substrate inputs; for field, lab- and pot studies; all variables were converted to common
units for comparison.
Reference Study
type Substrate Additions (mg kgC added -1)
Soil mass (g)
Duration (d)
(Blagodatskaya et al., 2007) lab glucose single 49 20 9
(Bradford, Fierer, &
Reynolds, 2008) pot sucrose single 526 5242 365
(Brant, Sulzman, & Myrold,
2006) lab mixed single 50 25 14
(Bréchet et al., 2018) field litter repeated 3000 15714 1095
(R. Chen et al., 2014) lab various single 2500 150 8.75
(Conde et al., 2005) lab various single 1000 20 28
(Crow et al., 2009) field litter repeated 977 3230 1825
(Dijkstra, Cheng, & Johnson,
2006) pot exudates continuous - 7500 54
(Dijkstra & Cheng, 2007a) pot exudates continuous - 7072 395 (Dijkstra & Cheng, 2007b) pot exudates continuous - 6750 69 (Fontaine, et al., 2004 a,b) lab cellulose single 495 20 70
(Fontaine et al., 2007) lab cellulose single 1000 60 161
(Fontaine et al., 2011) lab cellulose single 1000 60 161
(Fu & Cheng, 2002) pot exudates continuous - 8000 70
(Ganjegunte, et al, 2006) lab various single 187 30 95
(Guenet et al., 2010) lab litter single 2300 20 80
(Hamer & Marschner, 2002) lab various single 240 50 26
(Hamer & Marschner,
9
(Hamer & Marschner,
2005b) lab various repeated 1455 39 57
(Kuzyakov & Bol, 2006) lab sucrose single 78 257 11
(Marx et al., 2010) lab exudates repeated 1164 7 77
(Mary et al., 1993) lab root products single 276 100 186
(Mondini, et al., 2006) lab various repeated 20 50 4
(Nottingham et al., 2009) pot various single 6000 500 32
(Ohm et al., 2007) lab various repeated 1463 30 56
(Perelo & Munch, 2005) lab various single 500 398 98
(Prévost-Bouré et al., 2010) field litter single 972 5657 365
(Rasmussen et al., 2008) lab litter single 10000 30 90
(Razanamalala et al., 2018) lab various single 1000-4000 20 42
(Reinsch et al., 2013) lab glucose continuous 200 70 14
(Roque-Rivera et al., 2011) pot exudates continuous - 3490 120
(Salomé et al, 2010) lab fructose single 167 80 51
(Sayer et al, 2007) field litter repeated 1500 15714 1460
(Sayer et al., 2011) field litter repeated 2999 15714 2190
(Subke et al., 2004) field litter single 1732 3929 180
(Sulzman et al., 2005) field litter repeated 979 3222 1095
(Vanlauwe et al., 1994) lab litter single 68 50 40
(Waldrop & Firestone,
2004) lab litter single 6200 1000 65
1.4 The mechanisms and controls of priming effects
A large number of experiments have attempted to identify specific
mechanisms underlying soil C priming (Table 1.1), most of which have been
laboratory experiments which test one of three hypotheses based on substrate
limitation, nitrogen acquisition or microbial competition. However, the
inconsistency of the results across studies exemplifies the complexity of priming
effects and the importance of experimental-context, including differences in soil
properties and substrate additions.
The first proposed mechanism for priming effects is substrate limitation,
whereby inputs of fresh organic matter (FOM) alleviate the resource limitation of
microbial activity, which in turn facilitates the mineralisation of SOC (De Nobili,
Contin, Mondini, & Brookes, 2001; Kuzyakov et al., 2000). Soil microbial
10
the soil biota relying on fresh organic inputs as opposed to SOM for resource
acquisition (De Nobili et al., 2001; Fontaine, Mariotti, & Abbadie, 2003). Hence,
fresh organic inputs may provide the required energy for either SOC-specific
extracellular enzyme production or the increased production of C-degrading
enzymes that result in the co-metabolism of SOC (Bingeman et al., 1953;
Broadbent & Bartholomew, 1949; Kuzyakov et al., 2000).
However, evidence of the substrate limitation hypothesis varies markedly
among experiments adding simple compounds such as glucose and those adding
more complex polymerised FOM inputs such as cellulose. Amendments of complex
and more recalcitrant components of FOM often result in a greater response of SOC
mineralisation than additions of easily utilisable substrate such as glucose and
fructose (Hanif, Yasmeen, & Rajoka, 2004; Wu et al., 1993). This is slightly
counter-intuitive as one might expect the most accessible sources of energy to increase
microbial activity and thus provide the most energy for the mineralisation of more
recalcitrant C pools. Simple catabolites such as glucose can also inhibit cellulase
production by repressing enzyme synthesis (Hanif et al., 2004), and can even
destroy the microbial biomass (Wu et al., 1993), causing apparent priming due to
the increase efflux of CO2 derived from microbial mortality. The difference in
priming effects based on substrate type are also reflected by differences in the
types of substrates that tend to be applied in experiments at different scales. For
example, laboratory experiments tend to add a large single input of C substrate
such as glucose (Nottingham et al., 2009) or more complex FOM such as cellulose
in solution (Fontaine et al., 2007). Whereas field experiments are much more like
11
This may bias the results of experiments at different scale based on the substrates
used and lead to inconsistent results between experiments.
A further step in understanding the mechanisms of the priming effect is the
role of nitrogen limitation in regulating and controlling the dynamics of
decomposition. Decomposition is tightly constrained by C:N ratios and upon an
input of C-rich FOM, nitrogen may limit microbial activity, the production of
extracellular enzymes and microbial biomass (Hu, Chapin, Firestone, Field, &
Chiariello, 2001; Polglase, Attiwill, & Adams, 1992; Schimel & Weintraub, 2003).
This input of available energy therefore stimulates the decomposition of SOM to
acquire nitrogen that was previously energetically too costly to access from SOM
(Blagodatskaya & Kuzyakov, 2008; Craine, Morrow, & Fierer, 2007). Indeed,
experimental application of available nitrogen in concert with an input of a carbon
substrate can decrease the observed priming effect (Blagodatskaya et al., 2007;
Blagodatskaya & Kuzyakov, 2008; Cardon, 1995; Martin-Olmedo, Rees, & Grace,
2002) probably due to the preferential utilisation of FOM over SOM if there are no
nutrient limitations (Blagodatskaya & Kuzyakov, 2008). As soils vary in nitrogen
content, the importance of this mechanisms may differ between soils with high N
and those that are N limited. Experimental processes such as sieving and drying
soil prior to microcosm incubations can also result in a flush of available N (Fierer
& Schimel, 2002; Franzluebbers, 1999) which may affect the outcome of C addition
by altering the C:N. Therefore, existing soil properties and alterations to available
N through experimental setup provides important context when interpreting
experimental results.
Elevated nitrogen deposition also results in the inhibition of certain
12
extracellular enzymes for C and N acquisition and are associated with lignin
degradation and humification (Allison, Weintraub, Gartner, & Waldrop, 2011;
Carreiro, Sinsabaugh, Repert, & Parkhurst, 2000; Fog, 1988). Indeed, the inhibitory
effect of nitrogen deposition affects decomposition of recalcitrant organic matter
with a high C:N ratio, whereas increased nitrogen availability can increase the
decomposition of labile organic matter which has a low C:N ratio (Carreiro et al.,
2000; Fog, 1988). This has many implications for the priming of SOC as it
demonstrates mechanisms by which targeted microbial mining of SOM is
stimulated by FOM addition but only when nitrogen is limiting. This implies that
the components of the microbial community that are able to mine for nitrogen and
produce the required extracellular enzymes to decompose recalcitrant SOM are
responsible for mediating the mineralisation of SOC and thus produce priming
effects. Soil microbial communities are hugely diverse networks of species that
exhibit specialism, dormancy and redundancy (Allison & Martiny, 2008). During
decomposition, the competitive advantage between different microorganisms
shifts with the gradual breakdown of the FOM substrate due to enzymatic
specificity (Hättenschwiler, Tiunov, & Scheu, 2005; Rui, Peng, & Lu, 2009; Torres,
Abril, & Bucher, 2005). Microbial succession during FOM decomposition entails
changes to microbial community structure and activity. When available substrate
is present, microorganisms can increase activity both through the propagation of
biomass (Rui et al., 2009) and the up-regulation of specific extracellular enzymes
(Allison et al., 2011; Mileski, Bumpus, Jurek, & Aust, 1988).
There is growing evidence that the competition between microbial groups
during succession is of great importance in inducing the mineralisation of SOM
13
Firestone, 2004). This theoretical model of microbial succession describes the
competition between fast (r-strategist) and slow (k-strategist) species and the
resulting shift in competitive advantage that leads to increased SOC
mineralisation. R-strategists are characterised by their ability to exploit FOM
inputs and endure periods of dormancy when resources are limiting. Following
FOM additions, the shift in available resources leads to a competitive advantage to
the fast growing r-strategists that can utilise the labile input. However, they are
unable to assimilate the more recalcitrant, polymerised compounds and
consequently, during the later stages of decomposition once the most labile
compounds are exhausted, slower growing, SOM specialists that persist
continuously on SOM become dominant as they can exploit the more recalcitrant
FOM compounds (Fontaine et al., 2003). This late-successional advantage to
slow-growing k-strategists may be the driver for priming effects, as this community
utilises the carbon from FOM to exploit more energetically costly compounds in
the SOM (De Nobili et al., 2001). Indeed as discussed earlier, experimental
additions of complex carbon sources often result in a greater priming effect than
additions of simple labile compounds (Allison et al., 2011; Hanif et al., 2004; Wu et
al., 1993) indicating that microbial succession during decomposition could be a
vital mechanism in the priming of SOC.
Like soil properties in general, microbial communities can vary greatly
between different ecosystems, for example, grassland soils are generally more
bacterial dominated than forest soils, which have a higher fungal: bacterial ratio
(Bardgett et al., 2005; Fierer, Strickland, Liptzin, Bradford, & Cleveland, 2009;
Grayston et al., 2004; Joergensen & Wichern, 2008). This provides importance
14
response to a substrate addition is likely to vary with its microbial community.
Micro-organisms also demonstrate different resistance and reliance to
disturbance both in situ, such as extreme weather events, and from disturbance in
laboratory experiments such as sieving and drying (Thomson et al., 2010).
Therefore, these disturbances provide important experimental-context as, for
example, a fungal dominated soil may be more susceptible to damage from sieving
in a microcosm experiment due to their hyphal structure when compared to a
bacterial dominated soil (Petersen & Klug, 1994). These changes to microbial
community structure may intern alter the expression of priming effects and the
importance of different mechanisms.
Each of the proposed mechanisms for priming effects is tightly linked to
nutrient availability and microbial community structure, both of which can vary
greatly with existing conditions (García-Palacios, Maestre, Bardgett, & de Kroon,
2012) and through disturbances both in situ and through experimental
manipulation (Thomson et al., 2010). This may imply that priming effects are
particularly depended on the context in which they are studied and great care
should be taken when interpreting experimental results and comparing between
studies. These proposed mechanisms for priming effects may also represent a
continuum during microbial succession whereby increased FOM input overcomes
substrate limitation which requires increased nitrogen acquisition from the SOM
to maintain C:N and this is only accessible for specific components of the microbial
community. Perhaps a more unified hypothesis for the mechanisms of priming
effects is required to acknowledge the various controls that determine the
availability and energetic costs associated with SOC mineralisation. This would
15
microbial succession after FOM input in which the three mechanisms of substrate
limitation, nitrogen acquisition and microbial competition work simultaneously
with emphasis between them shifting according to environmental and
experimental conditions as well as existing soil properties.
1.5 Thesis objectives
Soil carbon dynamics and plant-soil interactions such as priming are an
integral component of ecosystem function. Therefore, understanding the effect of
environmental change on these phenomena is vitally important for making robust
predictions about the future of ecosystems. However, issues of scale and
experimental-context present a considerable challenge in studying soil processes
and plant-soil interactions. The body of work presented in this thesis aims to
address some of these challenges by investigating the following questions:
1) How are soil properties affected by the common processing techniques
used to prepare or store soils for microcosm experiments? (Chapter 3)
2) Do changes to soil properties in soil microcosms alter the function of
soil in response to experimental litter addition treatments? (Chapter 4)
3) Does experimental scale influence the results of a litter manipulation
16
Chapter 2. Methods
2.1 Introduction
In order to address the aims of this thesis to determine the effect of
experimental scale and context-dependency on soil carbon dynamics, I carried out
a series of experiments using soil microcosms under controlled conditions in the
laboratory. This chapter contains an overview of the analytical and experimental
methods used in subsequent chapters. I also give the rationale behind the chosen
methods, and describe adaptations as well as general experimental designs.
2.2 Overview of experiments
Chapter 3 describes a series of soil microcosms assessing the extent to which
soil properties recover to field-like conditions after sieving and air-drying. Soils
were collected from Wytham Woods, Oxfordshire, Colt Park meadow, Yorkshire,
Hazelrigg field station, Lancashire and Gisburn forest, Lancashire. The
experiments described in Chapter 4 aim to determine the extent to which soil
disturbance and sample processing can alter functional measurements of soil
during microcosm incubations. I performed a series of litter addition experiments
on different types of microcosms and measured CO2 efflux and ion exchange rates.
Chapter 5 explores the effects of experimental scale in the outcome of a litter
manipulation experiments by comparing the results of a nested microcosm,
17 2.3 Soil sampling
Soil samples for analysis of soil properties and the microcosms described in
this thesis were collected in the field at 0-10 cm depth using either a 2.5-cm
diameter punch corer or a 5-cm soil sampler. Soils for chapter 3 were collected
from four different field sites using the same sampling protocol. At each site five
spatial replicates (min. 20 m apart; henceforth 'plots') were established to capture
the spatial variation at each study site. Nine cores were taken at random locations
(> 1 m from the nearest tree trunk in wooded sites) within each replicate plot and
mixed to form one composite soil sample per plot. Soils for chapters 4 and 5 were
sampled from an in-situ litter manipulation experiment with five replicate plots
per treatment. For experiments comparing disturbed soils to intact soil cores
(Chapter 4 and 5), all soil samples were collected using a 5-cm diameter soil
sampler with a slide hammer attachment (AMS Soil Core Sampler, AMS, USA. The
sampler was lined with a 10-cm polymethyl methacrylate (PMMA) tube to
minimise soil compaction and disturbance during sampling. To maintain the same
microcosm design for intact and homogenised soil cores, sieved and dried samples
were removed from the tubes, processed by sieving and/or drying, and then
repacked into the tubes at the original bulk density. All soil samples were
transported to the lab in a cool box and kept refrigerated at 5ºC and all analyses
requiring fresh soils were completed within 48 hours of collection.
2.4 Microcosm design
There are a wide variety of microcosm designs used to explore soil
processes, ranging from large pot microcosms containing several hundred grams
18
(Campbell, Chapman, Cameron, Davidson, & Potts, 2003). The choice of method
usually depends on the specific research objectives as well as practical limitations
of time and expense. However, the lack of consistency in microcosm design
renders comparisons among studies difficult. As the main aim of my research was
to compare results across experimental scales, I wanted to use a microcosm design
that was comparable to other studies but that also captured some of the natural
heterogeneity of the soils. As soil respiration was the main response variable in
several of my experiments, it was important that the microcosm design balanced
the volume of the headspace and mass of soil to achieve adequate mixing and
accumulation of CO2 against the rate of water loss from the soil. To achieve this, I
conducted a series of preliminary experiments to determine a) the influence of
microcosm volume and b) the effect of different lid designs on CO2 efflux and the
rate of water loss.
2.4.1 a) The influence of microcosm size on CO2 efflux and the rate of water
loss from the soil.
To determine the optimal microcosm design to minimise water loss, and
achieve stable soil CO2 efflux during incubation experiments, I tested three
different combinations of vessel volume (Kilner™ jars) and soil mass; small,
medium and large. Small microcosms used 0.25-L jars containing either 10-g,
20-g or 50-20-g of soil; medium microcosms used 0.5-L jars containin20-g either 20-20-g, 50-20-g
or 100-g of soil; while large microcosms used 1-L jars and contained 50-g, 100-g
or 200-g of soil. I established two replicate microcosms containing of air-dried,
sieved (2-mm) soil. Prior to incubation, soil water content of all microcosms was
19
open during a 24-h incubation period at room temperature. Soil CO2 efflux was
recorded using an infrared gas analyser (Li-8100, LiCor Biosciences, Lincoln,
Nebraska, USA) with an eight-port multiplexer adapted to incubation jars
(Li-8150). The rate of water loss was measured by weighing the jars. Measurements
were taken every hour for the first 6 hours and then at 18 and 24 hours. Small
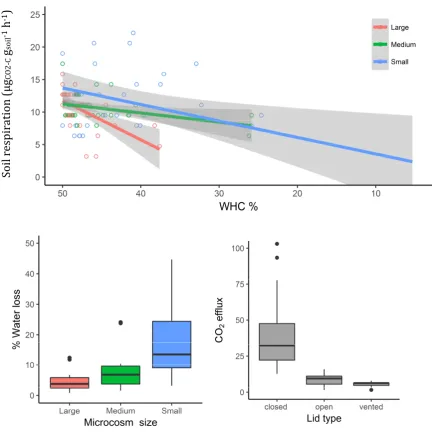
microcosms dried out more quickly than medium or large microcosms resulting in
a rapid decline in soil respirationover the incubation period (Figure 2.1). This was
exacerbated in microcosms where the soil sample had a high ratio of surface area
to volume, as the soil dried out much faster than the same soil quantity with a
smaller surface area. The effect of water loss on CO2 efflux was greatest in small
microcosms and in large microcosms with a large surface area to volume ratio.
Medium -sized microcosms with >50-g of soil and large microcosms with >100-g
of soil provided the best balance between water loss and stable CO2 efflux (Figure
2.1).
2.4.2 b) The effect of different lids on the rate of water loss and CO2 efflux As the rate of water loss from the soil in open microcosms is high, the
second test incubation used three different lid types (vented, closed and open) on
the same combination of microcosm sizes and soil quantities as described above
to test whether the type of lid affected soil respiration measurements and could
reduce the rate of water loss. For each volume soil mass combination, I established
2 replicate microcosms that were either left open ("open"), sealed with a lid
("closed") or "vented" with a 1-cm diameter hole drilled in the centre of the lids.
20
Lids were removed from closed and vented microcosms ~ 30 minutes prior to
measurement of soil CO2 efflux.
Closed microcosms had high concentrations of CO2 (>1000 ppm) in the
headspace prior to lid removal and after 30 minutes of aeration, showed elevated
and highly variable soil respiration when compared to the vented and open
microcosms (Figure 2.1). The vented lids showed the least variation in soil
respiration and lost less water than the open microcosms, which reduced the
frequency of water application to maintain soil moisture content within the
21
Figure 2.1. The results from the preliminary study comparing water loss and soil CO2 efflux in
different sized soil microcosms. Top; The effect of water loss on CO2 efflux among different
microcosm sizes. Bottom left; the effect on microcosm size on the rate over water loss during a
24-h incubation. Bottom rig24-ht; t24-he effect of different lids on t24-he soil respiration. Lid types were, ‘open’
= without a lid, ‘vented’ = lid with a 1-cm hole and ‘closed’ = completely closed.
As a result of these test incubations, I used ≥ 50 g soil (DW) in 0.5-L Kilner™
jars or ≥ 100 g soil (DW) in 1-L Kilner™ jars with vented lids for the experiments
described in chapters 3, 4, 5. There were some deviations to this design due to
So
il
re
sp
ir
at
io
n
(µ
gCO
2-C
gso
22
sampling constraints and according to experimental objectives; they are noted and
discussed as appropriate.
2.4.3 Incubation conditions
Prior to setting up microcosms, all jars were thoroughly cleaned with
deionised water, weighed, and labelled. Soil samples were then weighed into the
jars and watered to the target SWC. A pre-incubation period of ≥ 7 days was
conducted to condition the soil and allow for disturbance and ‘Birch’ effects to
subside prior to all incubation experiments. Soils were incubated in a controlled
temperature room at 16 ±1⁰C in the dark. Non-destructive measurements such as
soil respiration and water content were conducted in the controlled temperature
room. Soil water content was maintained by weighing microcosms and watering
to the target WHC every week.
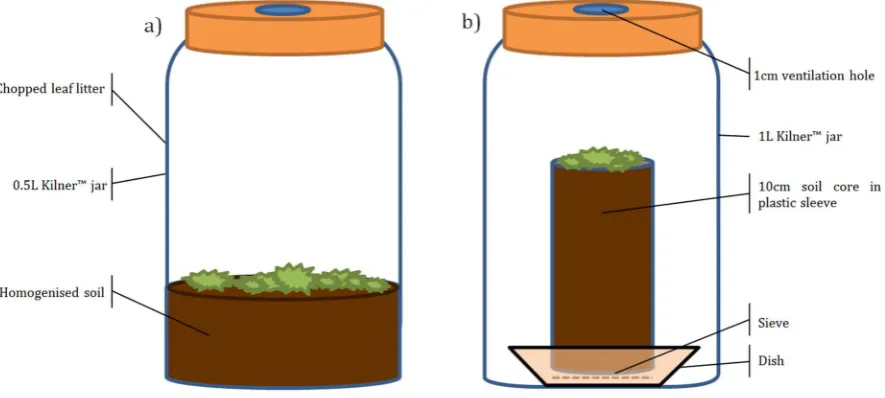
2.4.4 Microcosms with intact cores
For my experiments in Chapter 4 and 5 where I compared intact soil cores
with sieved and dried soil cores, I used 10-cm soil cores that were incubated inside
1-L Kilner™ jars. The soil cores were contained inside plastic sleeves with a mesh
attached to the base to allow drainage. The sleeves were then placed on a plastic
23
Figure 2.2. Microcosm designs for a) experiments using air-dried homogenised soil samples only
(chapter 3); all microcosm contained 50 - 100g of soil (dry-weight) in a 0.5-L Kilner™ jar; and b)
experiments with intact soil cores contained within plastic sleeves; these microcosms comprised
c. 150 g of soil in a 1L Kilner™ jar to accommodate the size of the cores.
2.4.5 Harvesting lab microcosm for soil analysis
Prior to harvesting soil microcosms for analysis, soils were watered to their
target SWC and left for 24 hours to limit the effects of rewetting. Litter was then
removed from samples where appropriate and air-dried. The soil was then divided
into eight subsamples: one subsample was used to determine soil dry weight, two
fresh subsamples were processed immediately for microbial biomass and
inorganic nitrogen, two subsamples were frozen, and three subsamples were
air-dried for analysis of total carbon, total nitrogen and cation concentrations.
2.5 Soil respiration measurements
In all experiments, soil respiration was measured using an infrared gas
eight-24
port multiplexer (LI-8150) that allows seven microcosms to be measured in series;
the 8th port is used for flushing the headspace of the microcosms. The multiplexer
works via a bank of solenoids that take the input and exhaust gas from multiple
microcosms and feeds them one at a time to the IRGA. The remaining microcosms
are ventilated with ambient air, which prevents the accumulation of CO2 in the
headspace prior to respiration measurements. The air input tube was placed
outside of the controlled temperature roomas the ambient levels of CO2 inside the
room gradually rose throughout the day.
Each CO2 measurement lasted 2 minutes with a 30-s pre-purge interval and
a 15-s dead-band in order to flush the tubes in the system and mix the air in the
headspace. The required time for pre-purge and dead-band was optimised for the
microcosm design during initial testing. Early testing also showed that soil
respiration in microcosms measured on the first 2 multiplexer ports was higher
compared to microcosms on subsequent ports; this was likely caused by a slight
pressure increase during the ventilation of the jars, which created a gradient of
CO2 from the top layer of soil into the headspace and thus increased the CO2 efflux.
This effect was minor and resolved by allowing all the jars to adjust to equal CO2
concentrations for c. 5 minutes after connecting them to the multiplexer and
before commencing measurements. Soil CO2 efflux was calculated automatically
by the internal LI-COR software and double-checked manually by plotting the
increase in CO2 concentration over time. Every six months, the IRGA was calibrated
against gas standards to insure the results were reliable and microcosm jars were
regularly tested for leaks using a built-in diagnostic mode, following the
25 2.6 Chemical and physical soil properties
2.6.1 Total soil microbial biomass
Total microbial biomass carbon (MBC) and microbial biomass nitrogen
(MBN) in the soil were determined on paired soil subsamples by chloroform
fumigation extraction following the protocol first described by Vance, Brookes and
Jenkinson (1987) and modified by Jones and Willett (2006), whereby soil samples
are exposed to chloroform, which lyses microbial cells and releases the cell
contents into the soil matrix. The amount of carbon (C) and nitrogen (N) in the
fumigated samples is then compared with unfumigated samples to determine the
C and N content of the microbial biomass.
For each fumigated soil sample, 8 g soil (fresh weight) were weighed into a
shallow glass dish to maximise the soil surface area and 20 dishes were placed into
a clean desiccator chamber with c. 1 cm of water in the base to prevent the samples
from drying out. A beaker with 30-40 ml ethanol-free chloroform was then placed
in the desiccator along with a second beaker containing 20 g soda lime.
Ethanol-free chloroform was used to avoid carbon accumulation in the soil samples and the
soda-lime limits CO2 accumulation during fumigation. The desiccator was then
evacuated using a vacuum pump until the chloroform had been boiling for 5 min.
At which point, the stopcock was closed, the pump turned off, and the samples
were left to fumigate in the desiccator for 24 hours in the dark.
To determine C and N concentrations of fumigated and unfumigated soils,
the samples were placed in a 50-ml tube with 40 ml 0.5M K2SO4 solution and
shaken on an orbital shaker for 1 h. Extracts were then filtered through
26
analysed using a TOC analyser (TOC-L, Shimadzu Corporation, Kyoto, Japan).
Finally, MBC and MBN were calculated as the difference in extractable C and N,
respectively, between fumigated and unfumigated samples. Unless otherwise
stated, no correction factors were applied.
2.6.2 KCl-extractable Ammonium and Nitrate
Soil ammonium (NH4+) and nitrate (NO3-)concentrations were estimated
by 2M KCl extraction. This extraction works by exposing the soil to anions and
cation with a higher affinity to the ion biding sites than the target ions. In this case,
the high concentration of K+ displaces NH4+ from the cation exchange sites and Cl-
displaces NO3- from the anion exchange sites. The target ions remain suspended
in the extractant solution and are analysed to determine their concentration in the
soil.
To perform KCL extractions, 2 g FW of soil was weighed in to a tube and
mixed with 20 ml of 2M KCl solution. One batch of KCl was used for each set of
extractions including three blanks, which were treated the same as the samples
through all stages. The soil-KCl solution was then shaken on an orbital shaker for
1 hour at 200 rpm. Extracts were then filtered (Whatmann 42), which was
pre-washed with KCl solution from the same batch. Filtered extracts are stored in the
fridge until they were analysed by colorimetry (AutoAnalyzer 3 HR, Seal
27 2.6.3 PRS Probe analysis
In order to measure ion exchange rates in soil microcosms I used Plant Root
Simulator (PRS™ Western Ag, SK Canada) probes. PRS probes are ion exchange
resin membranes, which are either positively or negatively charged by saturating
them with a counter-ion; anion probes are saturated with HCO3- and cation probes
are saturated with Na+. Upon burial in the soil, cations and anions are attracted
and adsorbed onto the probe with the opposite charge.
To measure soil ion exchange rates in the experiments described in Chapter
4, PRS probes were buried in 10-cm intact or homogenised soil cores, which were
incubated in 1L Kilner™ jars (Figure 2; B). Probes were buried for 24 hours in
order to allow adequate uptake of ions, following the manufacturer's
recommendations. After burial, the probes were thoroughly cleaned using
deionised water and returned to the manufacturer for analysis. NO3- and NH4+
were analysed colorimetrically and the remaining ions were measured via
inductively-coupled plasma spectrometry (ICP). Values for each ion are presented
as nutrient supply rates which are calculated as μg nutrient 10 cm-² ion-exchange
membrane surface area per unit time.
2.6.4 Soil pH
Soil pH was measured on 3 g of soil mixed into a slurry with 9 ml of distilled
water (modified from Allen, 1989). The soil slurry was shaken on an orbital shaker
for 30 minutes, left to settle for 30 minutes, and pH was then measured using a pH
probe (Mettler Toledo™ S220 SevenCompact™, UK). The probe was calibrated
using pH 4.0 and pH 7.0 buffer solutions prior to measurements and after each 45
28 2.6.5 Gravimetric water holding capacity
Soil water content was standardised in microcosm experiments by
maintaining 50% water holding capacity (WHC) throughout the incubations. A
WHC of 50% was used as it represented realistic soil water content for all soils
used in these experiments and preliminary tests demonstrated stable
measurements of soil respiration in a range of microcosm sizes (Figure 2.1).
SWC was calculated using the gravimetric water holding capacity with
modifications to methods outlined by Kittredge (1955) and Bernard (1963). Filter
papers (Whatman 42) were folded and placed in funnels, noting the weight of each
funnel and dry filter paper. The filters were then saturated with water and
reweighed. 5 g soil (dry weight) was added to each funnel and the exact weights
were recorded to two decimal points. Water was then slowly added to each soil
sample until the soil was saturated. The funnels were covered with Parafilm™ to
limit evaporation and the samples were left to drain for 6 hours. The procedure
was repeated to ensure that the soil was completely saturated and the samples
were weighed, dried at 105⁰C and re-weighed. Soil WHC was calculated as the
mass of water of saturated soil/dry weight of soil and multiplied by 100 to obtain
WHC in percent. The required amount of water to add to each soil was then
29
Chapter 3. Soil properties do not recover after sieving and drying
3.1 Abstract
Soil microcosms are a valuable reductionist approach for investigating soil
carbon dynamics and plant soil interactions. In order to reduce heterogeneity,
soils are often sieved and/or air-dried prior to use in microcosm experiments;
however, these homogenisation techniques represent a strong disturbance that
can alter multiple soil properties. It remains uncertain whether these changes in
soil properties persist throughout the experiments or whether certain soil
properties are more resilient to homogenisation techniques and could ‘recover’ to
resemble fresh soil properties. Importantly, for comparative experiments, we need
to establish whether the resistance and resilience of soil properties to sieving and
air-drying differs among soil types. Here, I studied soils from four contrasting
ecosystems to compare the resistance of commonly measured soil properties after
sieving and air-drying, and their resilience after 5, 10, 30 and 60 days of incubation
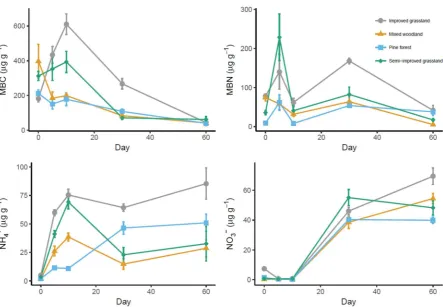
in microcosms. I observed similar overall patterns among soils: microbial biomass
carbon and nitrogen declined after sieving and drying, whereas extractable
ammonium and nitrate increased. I found no evidence for resilience of soil
properties to homogenisation techniques, as none of the measured soil variables
recovered to fresh soil values during the incubation. Despite the consistent overall
trends in soil properties, the trajectories of change in soil properties differed
among sites. Microbial biomass carbon and nitrogen in the two forest sites
declined continual across all time points, whereas the two grassland sites showed
air-30
drying. The observed effects of sieving and drying represent a dramatic shift in soil
properties that may mask treatment effects or create artefacts during incubation
experiments. The lack of consistent recovery trajectory among different soils
presents a challenge for comparative studies that use sieved and air-dried soils.
3.2 Introduction
Microcosms offer a simplified and reductionist means to study ecology. They
allow greater experimental control and enable researchers to test specific
research hypotheses (Verhoef, 1996). Soil ecological process are challenging to
study in situ due to natural spatio-temporal heterogeneity and complex feedbacks
between biotic and abiotic components of the ecosystem. Soil microcosms thus
allow researchers to ask questions, test treatment effects and identify mechanisms
in a way that would be impossible in situ, representing a vital tool in furthering our
understanding of key ecological processes.
Much of our knowledge of soil processes is derived from small-scale
microcosm experiments that use quantities of sieved and or air-dried soil
(Fontaine et al., 2011; Hamer, Marschner, Brodowski, & Amelung, 2004). The
validity of extrapolating these results to the ecosystem scale remains unclear,
because soil processing in microcosms represents a major disturbance with the
potential to alter soil structure, nutrient availability, physical protection of organic
matter, and microbial community structure (Kristensen, McCarty, & Meisinger,
2000; Petersen & Klug, 1994; Thomson et al., 2010). These effects on soil
properties may be important when exploring processes influenced by plant-soil
interactions, which are often studied using homogenised soil in microcosms
31
et al., 2011; Hamer et al., 2004). As a result, findings and extrapolations derived
from microcosms may not represent real-world processes.
Soil sieving is a common practice both in soil microcosm incubations and for
soil property analysis. It plays an important role in reducing the natural
heterogeneity of soil by homogenising the sample and removing rock and plant
material. Sieving can therefore improve the accuracy of analyses as properties and
response variables can be measured on a known quantity of homogenous soil. This
is particularly important to consider when exploring the effects of nutrients and
microbial activity on soil processes as hotspots of nutrients within a microcosm
may affect responses to experimental manipulation, hindering our ability to
identify treatment effects. Despite the advantages of sieving, it is important to
acknowledge that soil processes occur in heterogeneous ecosystems that are full
of hotspots, disturbances and abiotic influences including climate. Indeed, many
ecologically important soil processes occur within hotspots of nutrient availability,
microbial activity and at the interface between soil and roots.
After sampling from the field, soils are frequently air-dried prior to use in
microcosm incubations (Nottingham et al., 2009). Air-drying samples is
convenient for storage and shipping and mitigates some of the challenges of soil
sampling by ensuring comparable conditions for soils sampled from different
locations and at different times. However, the drying and subsequent rewetting of
soils can alter microbial community structure and activity (Gordon, Haygarth, &
Bardgett, 2008) as well the mobilisation of organic and inorganic nutrients (Fierer
& Schimel, 2003; Gordon et al., 2008; Wu & Brookes, 2005). These rewetting
effects can result in a flush of carbon (C) and nitrogen (N) being released into the
32
contents from lysed microbial biomass (Birch, 1958; Fierer & Schimel, 2002,
2003).
Changes to soil properties during sieving and air-drying also make
comparison between studies extremely challenging, as there is a lack of
consistency in soil processing and homogenisation techniques. Soils also respond
differently to disturbances. Studies have used microcosm experiments to compare
different soils (Hamer et al., 2004; Pietikäinen, Pettersson, & Bååth, 2005) and
make inferences about soil processes and the underlying mechanisms. Such
comparisons would be problematic if different soil types have different initial
responses and recovery trajectories after sieving and drying. Soils may differ in
their resistance and resilience to sieving and drying, perhaps arising from different
microbial communities, soil structure or in situ abiotic factors such as climate and
weather. Indeed, the outcome and magnitude of soil processes can be very context
specific as they are affected by soil properties and abiotic controls. Experimental
conditions and manipulations that alter these controls and soil properties might
therefore alter the function and dynamics of soil processes.
The effects of sieving and drying have been widely reported in the literature
(Kristensen et al., 2000; Petersen & Klug, 1994; Thomson et al., 2010), indicating
that many soil properties have low resistance to the disturbance caused by soil
processing techniques. However, there are still gaps in our understanding of how
changes to specific soil properties are linked to soil function within microcosms.
In particular, we need to know the extent to which sieved and air-dried soils in
microcosm studies are representative of soils in situ. I aimed to address this in a
series of experiments to investigate: 1) the extent to which microbial biomass and