1
Usability of VGI for Validation of Land Cover Maps
Cidália C. Fonteab, Lucy Bastinc, Linda Seed, Giles Foodye & Flavio Lupiaf a
Department of Mathematics, University of Coimbra, Coimbra, Portugal b
Institute for Systems Engineering and Computers at Coimbra (INESC Coimbra), Coimbra, Portugal
c
School of Engineering and Applied Science, Aston University, Birmingham, UK d
Ecosystems Services and Management Program, International Institute for Applied Systems Analysis (IIASA), Laxenburg, Austria
e
School of Geography, University of Nottingham, Nottingham, UK f
National Institute of Agricultural Economics (INEA), Rome, Italy
Abstract
Volunteered Geographic Information (VGI) represents a growing source of potentially valuable data for many applications, including land cover map validation. It is still an emerging field and many different approaches can be used to take value from VGI, but also many pros and cons are related to its use. Therefore, since it is timely to get an overview of the subject, the aim of this article is to review the use of VGI as reference data for land cover map validation. The main platforms and types of VGI that are used and which are potentially useful are analysed. Since quality is a fundamental issue in map validation, the quality procedures used by the platforms that collect VGI to increase and control data quality are reviewed and a framework for addressing VGI quality assessment is proposed. A review of cases where VGI was used as an additional data source to assist in map validation is made, as well as cases where only VGI was used, indicating the procedures used to assess VGI quality and fitness for use. A discussion and some conclusions are drawn on best practices, future potential and the challenges of the use of VGI for land cover map validation.
Keywords: VGI, land cover/land use, quality, validation, crowdsourcing
1. Introduction
2
The accuracy of a land cover map is assessed ideally by evaluating the degree to which the map agrees with a “gold standard“ reference database, which should indicate the actual land cover observed for a sample of spatial units (e.g. pixels), frequently referred to as “ground truth”. The spatial units can be points, pixels or blocks of pixels and are ideally identified using a sampling strategy that generates an unbiased and representative subset of the population, so that the accuracy assessment of the sample may be used to estimate the population’s accuracy (Steele 2005; Stehman 2009). The association of “ground truth” to each sample unit is usually done by experts and is then compared to the land cover map, generally by building confusion matrices, from which one or more statistical accuracy indices can be extracted (e.g. Congalton and Green 1998; Foody 2002; Steele 2005; Pontius and Millones 2011).
3
available. Many of these issues are discussed by Tsendbazar et al. (2014) in their meta-study of existing and forthcoming reference datasets for meeting the needs of different communities, including climate modellers and global land cover map producers. Some of the reference datasets reviewed include those provided by volunteers.
The increasing availability of data provided by volunteers worldwide has drawn the attention of scientists to the potential value of Volunteered Geographic Information (VGI) as a source of inexpensive, current and plentiful reference data. The term VGI is used here to cover a wide range of data provided by volunteers, to which a geographical location is associated. Other terms, such as Contributed Geographic Information, Geographic Citizen Science, Geocollaboration or Public Participation Geographic Information Systems are also used to refer to this new type of data, even though they are not synonyms (Elwood, Goodchild, and Sui 2012; Elwood, Goodchild, and Sui 2013; Harvey 2013; MacEachren and Brewer 2004; Sieber 2006; Haklay 2013). This information may be collected in many formats, ranging from text descriptions or photographs to complete maps created by the volunteers. A review on several of these sources of data may be found in Goodchild (2007), Haklay (2013) and Heipke (2010). On the face of it, VGI has huge potential to replace or complement authoritative data which are expensive or restricted, or to fill gaps in the available reference data, especially for global land cover monitoring. However, several questions are raised by this use; chief among these is how to guarantee the quality of VGI, given the patchy geographical and temporal distribution which impacts on representativity, the potential for contributor error and even malicious misinformation, and its lack of homogeneity in general.
The issues related to data quality may seriously limit and even compromise the use of VGI for land cover map validation, especially because in traditional map validation the reference is assumed to be a 'gold standard'. Therefore, VGI brings its own peculiarities and strengths to the mix, and in isolation is unlikely to ever constitute a 100% gold standard.
4
This article begins with a discussion on VGI quality, including a brief review of the main approaches currently or potentially used to assess quality, that may add some information on data quality and thus help in assessing whether VGI should or should not be used for validation. VGI platforms and projects whose outputs have already been used for land cover map validation are then identified and described, as well as others that may in the future be used for this aim, with particular attention to their quality assurance procedures. This is followed by a documentation of case studies where VGI has been used to validate land cover maps (including any quality assessments of the VGI which may have been carried out by the researchers in the course of their work). Finally, best practice, future potential and the challenges facing this application of VGI are discussed.
2. Data Quality
2.1 VGI quality
The quality of a spatial dataset has many aspects, such as internal consistency, completeness, precision, or closeness to reality (‘accuracy’) (Guptill and Morrison 1995; Devillers and Jeansoulin 2010). In combination, these aspects of quality define a dataset’s fitness-for-use for a certain purpose. When related to VGI, additional indicators related to these facets may also be considered, such as the credibility of the volunteers and the reliability of the information they supply.
5
Credibility or reliability of an observation is used to denote the quality of the information contained in that observation. It may be assessed in several ways; e.g.: (a) by comparing observations to independent verification data, (b) by checking the consistency of the information with contemporaneous data from other suppliers (either authoritative contributors, or peers in the crowd), or (c) by extrapolating from the credibility of the person supplying the data, on the assumption that an observer who has supplied high-quality information in the past will continue to do so. This last approach is possible when users undergo training against known data points, so that their learning and performance can be assessed. By high reliability, we intend to imply reliable provision of high-quality observations.
Flanagin and Metzger (2008) stress the differences between information credibility and accuracy. Credibility is indicated to have two dimensions: trustworthiness and expertise (broadly these map to the two categories above), and includes some subjective components which are complex to assess. The traditional meaning of accuracy is the degree of closeness to reality but it does not consider other factors such as the degree to which a contributor can be trusted.
The issue of VGI data quality has been raised by many commentators and is one of the most important topics on the VGI research agenda (Elwood, Goodchild, and Sui 2013), since it ultimately determines the relevance and appropriateness of the data for use in real-world contexts. The key point is that for VGI to be useful in scientific analyses there is a need for some measure of its credibility and accuracy. In particular, for the use of VGI as reference data to inform and validate land cover maps, a certain level of accuracy is fundamental to obtain credible results for a principled scientific analysis, since in this case VGI is supposed to represent ground truth.
2.2 Approaches to address VGI quality
Several perspectives may be taken to respond to the challenge of VGI quality control. Goodchild and Li (2012) categorize the different approaches to address the quality of VGI into three groups:
6
locations where the number of possible contributors is small – for example, more isolated regions;
2) ‘Social’, using trusted contributors with a reliable history of quality contributions to review the work of other contributors;
3) ‘Geographical’, identifying rules that connect various types of information based on their location, to assess the possibility that an attribute is correct at a certain location. In its simplest form, this approach is the most familiar to geoscience and land cover specialists, since it equates to traditional ‘ground-truthing’ against more credible data based on geographic context.
Allahbakhsh et al. (2013) also provide a categorization for quality control measures of crowdsourced systems more generally but which can also be associated to assessing the quality of VGI. They refer to: expert review, whereby the quality is checked by domain experts; output agreement and majority consensus, where multiple independent observations that agree on the same value are deemed to be correct or correctness is based on majority agreement; ground truth – i.e., comparison with a gold standard such as known answers; contributor evaluation, which assesses a current contribution based on past performance; real-time support, i.e., processes for guiding contributors in real-time, and workflow management, in which complicated tasks are broken down into workflows, monitored over time, and modified as necessary to improve the quality of outputs and the selection of workers. Worker selection strategies are further divided into
no selection (open to all); selection based on reputation; and selection based on credentials.
The proposed categorizations identify several quite distinct aspects of VGI quality assessment, ranging from how a procedure is executed, (i.e., who or what performs it), to the information used for the procedure (for example expert review versus ground truth).
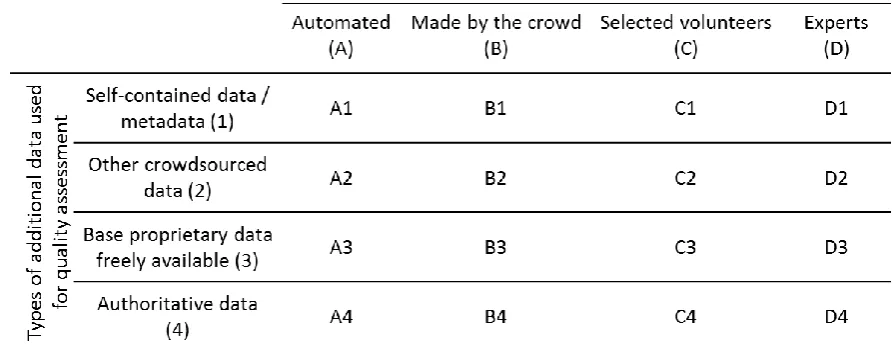
Another perspective to classify the various approaches to VGI quality assessment is proposed here, which is based on two facets, as follows:
1) the level of intervention required outside the crowd or the system; 2) the type of additional data used (if any) for the quality assessment.
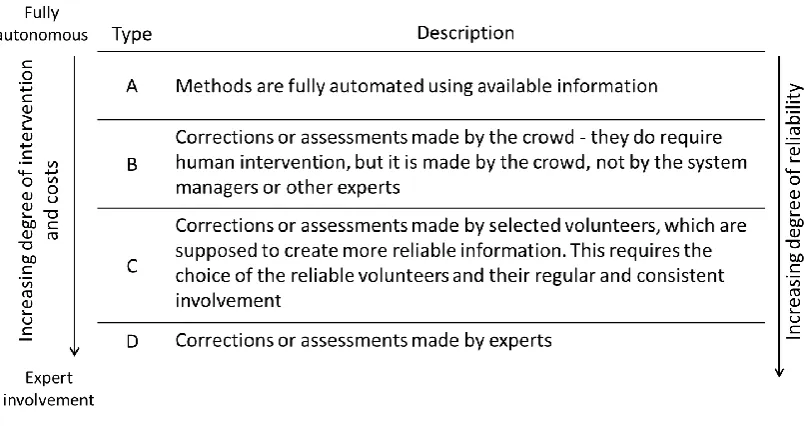
Four levels of intervention may be considered, illustrated in Table 1, which go from
7
[image:7.595.98.501.157.370.2]intervention of experts. An increase in the level of intervention means that more time and resources are usually necessary to perform the task.
Table 1. Degree of intervention required outside the crowd or the VGI application (system) to assess quality
8
Table 2. Types of data used for quality assessment
Table 3. Relation between levels of intervention required outside the crowd / system and data used to assess accuracy
[image:8.595.80.528.337.513.2]9
consensus may be considered as a type of the geographical approach, since they are associated with the same features or the same geographical location.
The proposed categorization assumes that a method of type A1 may be performed in real time and has no additional costs, while on the other extreme a method of type D4 needs much more resources and time to be performed.
3. VGI as Reference Data
3.1 Types of VGI used for land cover map creation and validation
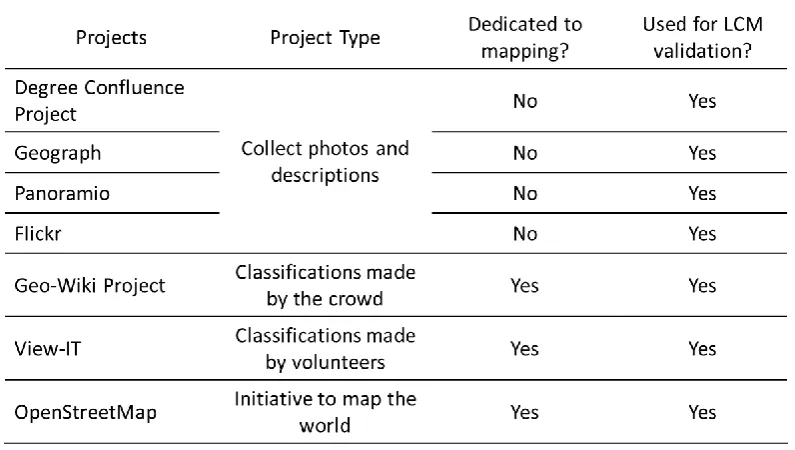
Several sources of VGI with different characteristics have and may be used to assist in the creation of land cover maps and assess their quality. The main sources used for this purpose include:
1) photographs and descriptions collected by the Degree Confluence Project (eg.
Iwao et al. 2006; Foody and Boyd 2013; Iwao et al. 2011);
2) photographs posted by volunteers at sites, namely Panoramio, Flickr and Geograph (Estima, Fonte and Painho 2014; Estima and Painho 2013b);
3) volunteer initiatives to map the world, such as OpenStreetMap (OSM) (Estima and Painho 2013a; Jokar Arsanjani et al. 2013; Bontemps et al. 2011);
4) land cover data collected by projects such as Geo-Wiki (e.g. Fritz et al. 2013; Comber et al. 2013) and VIEW-IT (Clark and Aide 2011; Aide et al. 2013; Redo et al. 2012).
10
[image:10.595.99.497.142.367.2]instances were found where the data had been used to derive or validate land cover information.
Table 4. Characteristics of VGI projects that may be used for land cover map validation.
An untapped source of information is descriptions of habitats from species identification sites such as iSpot and iNaturalist. When users identify species, they can also indicate the type of habitat, which if mapped into land cover classes, could be a valuable source of information for land cover map creation or validation.
3.2 Sources of VGI used as reference data
3.2.1 Degree Confluence Project
11
In order for these photographs and textual descriptions to become usable ground data for land cover mapping, they must be labelled, by volunteers or experts, as belonging to certain land cover classes (Iwao et al. 2006; Foody and Boyd 2013).
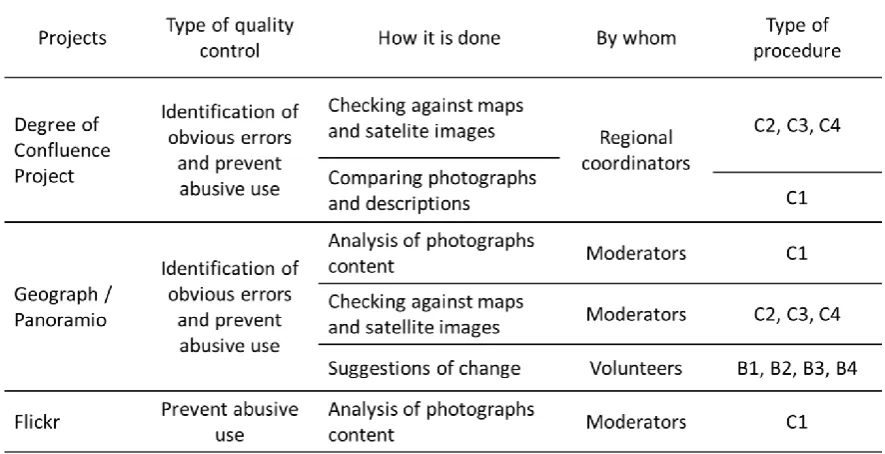
The submission policy to the DCP involves a preliminary check for errors by regional coordinators, which identify obvious mistakes and malicious submissions. This verification of obvious errors is done through the comparison of what is shown in the photographs with maps, or the assessment of correspondence between the description and what is shown in the photographs. Volunteers may be directly contacted to clarify any doubts.
[image:11.595.83.526.389.616.2]These quality control approaches are mainly social. For example, the coordinators may check the self-consistency of the VGI data itself (C1), may check it against data from other VGI initiatives such as OSM (C2), or against satellite images (C3) or even authoritative maps (C4) (see Table 5 for a summary).
Table 5. Types of quality control performed by the collaborative projects created to collect photographs.
12
accurate; however, inconsistency does not necessarily imply inaccuracy, but may give an idea of mixing or change on the ground, or give some insight into the difficulties involved in assigning particular land cover classes which are easily confused. In fact, locations where people disagree on the best class to assign may play a very useful role for land cover mapping – either by enabling the direction of more expensive sampling work towards contested locations or (if the land cover is ultimately verified as being mixed or transitional), by identifying useful training sites where mixed pixels occur (Pouteau and Collin 2013).
3.2.2 Geograph
Geograph (http://www.geograph.org/) is an initiative that encourages people to collect and submit photographs representative of every square kilometre of Great Britain, where the project was first started by Gary Rogers. Geograph has now been extended to Ireland, Germany and the Channel Islands. To date, there are 12,201 contributors who have submitted over 4 million photographs covering 82.3% of the total area of Great Britain and Ireland. Geograph Germany is a much newer initiative with only 160 users so far who have covered just over 5% of the country while 20 users have already covered more than 50% of the Channel Islands.
Anyone accessing the site can view information about the photographs, including tags assigned to each one, and, if logged into the system, can start discussions on individual photographs. Users can also view the location of any photograph on Google Earth, Google Maps, the corresponding Ordnance Survey map sheet and the Geograph map interface, as well as viewing additional links related to the location.
Once logged in, users can upload geo-tagged photographs and manually enter the location or can do a bulk upload of photographs using Geograph’s bespoke facilities or from Picasa. To the authors knowledge there is no automated checking by the system itself but there is a team of moderators who review the photographs that are uploaded. Moreover, users can disagree with the location or title of a photograph and make suggestions for changes (see Table 5 for a summary).
3.2.3 Panoramio
13
The main aim of the website is to document the world with photographs, so most of the photographs illustrate places. The volunteers may assign small descriptions to the uploaded photographs, as well as tags, which can be used to group them into categories. According to the website Panorank (http://www.panorank.com) by December 2014 the Panoramio users were around 8 million with a total number of uploaded photographs of approximately 85 million.
The inclusion of photographs in Panoramio requires a prior review, to control the type of photographs included on the site. Panoramio also allows correction of the position of the photographs by volunteers (approach of type B). However, no change information or versioning control is made available. Panoramio allows the insertion of comments on the images; this is a potential mechanism for documenting problems such as dispute on the spatial location of the image, but in reality these are more frequently used to comment on the photograph itself.
A selection of photographs are displayed on Google Earth on a monthly basis. This may motivate the users to upload good images with accurate geographic positioning.
The positional information for Panoramio photographs may be entered automatically if an exchangeable image file (EXIF) is used and the camera has a built-in GPS receiver. Alternatively, the photograph’s position can be uploaded manually, obtained from an external GPS receiver, or the photographs may be manually placed by the volunteer over a satellite image. Positional error may exist in all of these cases, but each strategy has different characteristics and is likely to have different degrees of accuracy.
Panoramio photographs have a date of upload but not the date when the photograph was taken, so there is no temporal information associated with the photographs, unless an EXIF file is used. This can be a limitation to the use of these photographs for land cover map validation purposes, since the reference data needs to relate to a time comparable to that of remote sensing image acquisition (Fritz et al. 2009).
14
3.2.4 Flickr
The Flickr initiative (https://www.flickr.com/) was started in 2004 by Ludicorp and was subsequently purchased by Yahoo in 2005. Flickr helps people share their photographs and videos with others. The application is not targeted to a particular kind of photograph or video, but gives freedom to the volunteers to submit all types of images. Some metadata are automatically associated with the photographs, such as date of upload, date of the photograph, camera used, and location obtained by an inbuilt GPS receiver, if available. Geographical location may also be associated with the photographs by locating them on a map or a satellite image. The user can add tags and descriptions to the photographs and include them into thematic groups, which may help find photographs by themes. There are a set of community guidelines and the content of the site is subject to moderation, but just to prevent abuse (see Table 5 for a summary). More than 150 million geotagged photographs were available in Flickr in April 2014, including all types of photographs. The photographs in Flickr are heterogeneous in their spatial and temporal density and also in their characteristics, i.e. to ensure spatial representativity for land cover map accuracy assessment, a subset would need to be selected using an appropriate sampling strategy.
3.2.5 The Geo-Wiki Project
15
Difference Vegetation Index) averages at 10 day intervals across the year, to help differentiate between, for example, evergreen and deciduous vegetation.
From the main Geo-Wiki application, volunteers can go to any location and indicate whether the three main global land cover products are good or bad at representing a given location as visible from Google Earth images. However, this has produced very little VGI (Fritz et al. 2012). Instead, a competition branch of Geo-Wiki is used in concentrated campaigns where volunteers are given random locations on the Earth’s surface and are asked to identify the land cover types visible using a simplified legend of ten land cover types, similar to the ones proposed by Herold et al. (2008). Although there are no restrictions on participation, the main contributors have been experts in remote sensing and geospatial sciences or students in a related field (Fritz et al. 2012). The actual crowd has been engaged more recently through the Cropland Capture game - essentially a simplified game version of the competition site (See et al. 2014), which asks users to determine whether any cropland is visible in a given pixel or photograph. The game uses a scoring system in which correct answers are assigned a point and incorrect answers result in point loss and prizes were awarded at the end of the game.
16
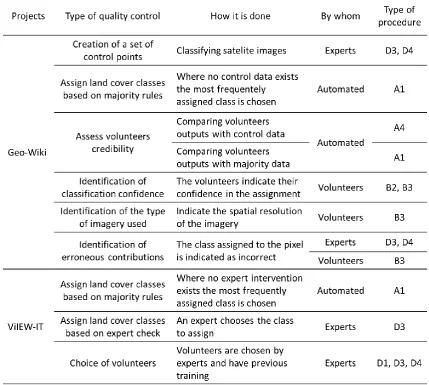
Table 6. Types of quality control performed by the collaborative projects created to collect land cover data.
The most recent Cropland Capture game uses a combination of methods including: 1) the use of pixels where the answers have been agreed upon by experts – i.e.,
‘control pixels’;
2) where no control exists, a majority rule is implemented whereby initially players are correct until sufficient data have been collected at a single point to use the majority rule – this determines whether players receive a point ; and
17
3.2.6 VIEW-IT Project
The Virtual Interpretation of Earth Web-Interface Tool (VIEW-IT) described by Clark and Aide (2011) is a collaborative Web-based system to automate the collection of reference data for producing and verifying the accuracy of land use/land cover maps derived from MODIS imagery. The browser-based tool aims to collect crowdsourced interpretations of reference data from high resolution imagery available on Google Earth and allow users to visually estimate the percent cover of seven basic land cover/land use classes within a sample grid. The tool builds on the approach developed by the Geo-Wiki Project, and is described as a prototype aimed at building a global community of volunteer interpreters, especially in developing countries, where land change occurs very frequently. No link was found to this platform.
The VIEW-IT application allows the use of historical images from Google Earth, as well as biome and ecoregion polygons accessed using ArcGIS Server, Panoramio photographs, Google Charts for viewing temporal Enhanced Vegetation Index (EVI) data and an administration data summary. This allows the use of several types of data to perform the classification of the sample points used for the accuracy assessment.
There are two sample approaches which can be used in this application; samples may be created by the administrator (using any sampling protocol) or the user can select their own sample locations manually. In the latter approach it is possible to analyse the characteristics of the additional information available at that location to decide if that sample location is a good one or not (Clark and Aide, 2011).
Each VIEW-IT sample unit is a 250 × 250 m square corresponding to a MODIS pixel. This square is further decomposed into a 4 × 5-cell grid, each covering 5% of the 250 m square.
18
assigned to it by the users the average of their indicated percentages is considered, but the original percentage information is kept in the system. Where discrepancies are found or if the image year used for the classification is different, then the answers are analysed by an expert. In this case the expert has access to the information about the identity of the users, so that it is possible to identify their credibility. If the classification is made by an expert, the classification process is closed (see Table 6 for a summary).
The volunteers are chosen by the system administrators. They have prior training using a sample dataset and their interpretation results are verified before using the system, so it is not yet a system open to the crowd. However, the developers express the will to expand it to the global scale and to a larger community of users. This situation is similar to that of the Web-based validation tools described in Bastin et al. (2013) which were first evaluated by a limited set of trusted experts and volunteers, but then expanded into a platform suitable for citizen labelling of multi-temporal land cover across a carefully designed set of sample points.
3.2.7 OpenStreetMap
OSM (http://www.openstreetmap.org/) is a global initiative in which volunteers digitise detailed information on features and infrastructure, according to a model rather similar to topographic maps. Point, line and polygon data are collaboratively submitted and edited to generate a plane-view representation of the Earth. A detailed taxonomy of tags allows features, such as buildings, for example, to be annotated with information defining their purpose and nature. In many areas (and particularly in developed urban zones), OSM is more complete and informative than authoritative alternatives (Neis, Zielstra, and Zipf 2011). However, its density and currency depends on local survey effort. Some well-defined projects exist to map regions, for example, where an urgent humanitarian response is needed, such as the case of the Haiti 2010 earthquake or the more recent Guinea Ebola epidemic (http://hot.openstreetmap.org/projects). Many of the tags in OSM relate to land use (e.g., ‘industrial area’) rather than physical land cover
19
computation of coverage proportions (Jokar Arsanjani et al. 2013). For natural land
cover types, OSM has a set of agreed tags
(http://wiki.openstreetmap.org/wiki/Key:natural), but these are used far less frequently (Mooney, Corcoran, and Winstanley 2010), and the data may be much more heterogeneous in its detail and quality. An analysis of class coverage on a national scale, when compared to the Corine Land Cover map, showed promising results mainly for water and urban classes (Estima and Painho 2013a). There is an ongoing debate among the OSM community as to the detail with which land use and land cover should be represented in the accepted tags (e.g. Mooney and Corcoran, 2012, Antoniou, 2011). Suggested conformance to official schemes such as the Land Cover Classification System (LCCS) (Di Gregorio 2005) of the Food and Agriculture Organization (FAO) have been generally seen as potentially too complex for general contributors to supply. In brief, OSM data are potentially of value for land cover validation, but present some problems due to their spatial and semantic patchiness.
3.3 Summary
Tables 5 and 6 summarize the quality control procedures used by the projects that collect photographs and the projects that collect land cover data, respectively.
The quality control for photograph collections is mainly made by volunteers, with approaches of types B and C. No automated methods were identified for this propose. For the quality control of Geo-Wiki a wide range of quality control procedures are used, automated, made by volunteers and experts. For the VIEW-IT project most of the quality control procedures are done by experts. Only a majority consensus approach is used when no expert intervention is available, providing an automated approach.
4. Uses of VGI for Quality Assessment of Land Cover Maps
In this section, projects where VGI was used as the main source of data to assess the accuracy of land cover maps are described, indicating the data used by the authors, the procedures applied to assess the quality of the VGI and additional approaches to improve the quality of the accuracy assessment results.
20
1) using volunteered data such as photographs and descriptions from platforms such as DCP, Flickr and Panoramio, which have then to be interpreted and classified for the specific purpose either by other volunteers or experts;
2) using classifications directly provided by the crowd or by volunteers, which may have been given access to several types of data, such as satellite imagery, photographs or NDVI values to perform the classification.
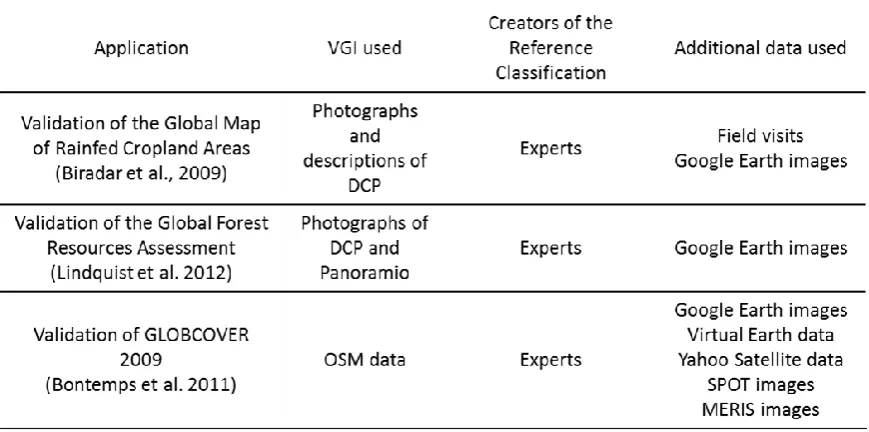
[image:20.595.86.521.375.591.2]In some cases data provided by volunteers in collaborative projects were used as additional data to validate land cover maps. This is the case, for example, in the validation of the Global Forest Resources Assessment (FRA) Remote Sensing Survey (Lindquist et al. 2012), the validation of GLOBCOVER 2009 land cover map (Bontemps et al. 2011) and the Global Map of Rainfed Cropland Areas (Biradar et al. 2009), further explained in the next section. Table 7 shows a summary of the data used in these projects. See Tsendbazar et al. (2014) for additional examples.
Table 7. Applications where VGI was used to assist the validation of global maps.
4.1 Using photographs and descriptions
21
sample of the field data and the Google Earth interpretations were then used for the accuracy assessment of the map.
The Global Forest Resources Assessment (FRA) Remote Sensing Survey, performed by a partnership between the Food and Agriculture Organization of the United Nations and the European Commission Joint Research Centre (Lindquist et al. 2012), enabled the estimation of global forest land use and change between 1990 and 2005. The survey was made through the classification of a sample of Landsat satellite imagery at the intersection of each degree of latitude and longitude. The validation of the classification was made using Google Earth imagery and photographs from both DCP and Panoramio (Lindquist et al. 2012), but no formal accuracy assessment was done.
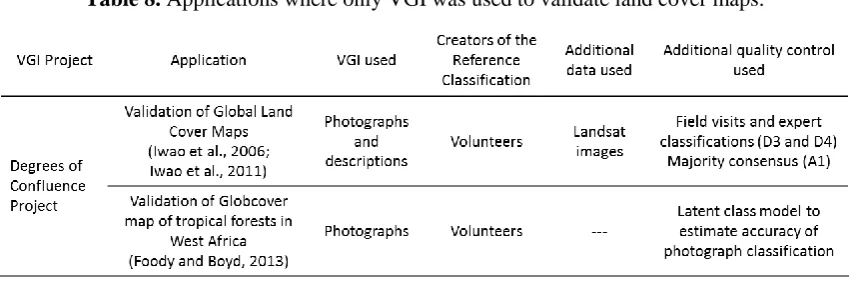
[image:21.595.85.512.514.656.2]Some tests have already been done to assess the possibility of validating land cover maps using information extracted only from VGI. For this type of approach the DCP has been tested, with promising results (Table 8). Iwao et al. (2006) used 749 photographs extracted from the DCP and their associated descriptions, to assess the accuracy of different land cover maps of Eurasia, namely GLC2000, MOD12, UMD and GLCC. To assess the accuracy of the descriptions provided by the volunteers, three individuals with different backgrounds confirmed that the descriptions were appropriate and did not depend on expertise. These three individuals then assigned classes to all 749 sites and the land cover class attributed to the sites was the most frequent class assigned by the three volunteers.
Table 8. Applications where only VGI was used to validate land cover maps.
22
accuracy could be trusted, an approach of type D1. An evaluation was also made as to whether the descriptions had changed over time, to identify changes in land cover.
To assess the accuracy of the thematic information extracted from the photographs and descriptions, the classification was compared to the classification of Landsat false-colour images for thirty sites, an approach of type D3. Iwao et al. (2006) also made field visits to some of the sites (approach of type D4). According to the authors, the results showed that the validation made using the DCP data presented the same or even higher accuracy than the one obtained with visual interpretation of Landsat images.
Iwao et al. (2011) also used the approach described in Iwao et al. (2006) to assess the accuracy of a land cover map generated by combining three existing land cover maps. The photographs and descriptions available at the DCP for 4,211 sites were used for the validation. No further details are given on additional quality control methodologies used.
Foody and Boyd (2013) tested the use of photographs available at the DCP to assess the accuracy of the Globcover map of tropical forests in West Africa. Photographs acquired at ninety nine confluence points were used. The photographs were then interpreted independently by four volunteers, who labeled them as representing either forest or non-forest. Since errors were expected to occur during the labelling process, a latent class model was used to estimate the user’s and producer’s accuracy of the classification as forest or non-forest. The descriptions associated with the photographs were not used in this study. The results showed that the labelling of the photographs varied greatly between volunteers, which raises some concerns about the possible use of VGI for accuracy assessment, especially if no means to select volunteers based on the quality of their work is used. In addition, low levels of agreement were observed between the reference data and the Globcover map, even though many sources of uncertainty may contribute to the observed disagreements. However, the use of latent class analysis was shown to produce useful information for the Globcover map validation.
23
Kinley (2013) compared land cover data from an area in Hampshire, UK, with tags from Geograph photographs and OSM data. The results showed a poor match between OSM and the authoritative data but a higher match between the Geograph photographs and the land cover map. The advantage of Geograph as a source of ground truth information, compared to sources of VGI such as Flickr and OSM for the study area considered, was its much higher and more homogeneous spatial coverage.
Hochmair and Zielstra (2012) assessed the positional accuracy of Panoramio and Flickr photographs, and Estima and Painho (2013b) assessed the availability of Flickr photographs on a country level, to determine whether they could be used for land cover map accuracy assessment. Estima et al (2014) compared the land cover classes obtained through the classification of Flickr photographs and the classification of high resolution satellite images to three level 1 classes available at Corine Land Cover, and concluded that this source of data can hardly be used alone for all classes, mainly due to the uneven spatial distribution of the available photographs and their high predominance in some classes.
4.2 Using classifications made by the crowd
As mentioned in section 3, the Geo-Wiki and VIEW-IT projects were developed with the overall aim of land cover map validation, and both integrate a variety of potentially useful data into the validation process. The Geo-Wiki project has hosted and provided data for several projects related to land cover map production and validation (Comber et al. 2013; Foody et al. 2013; Fritz et al. 2013; Perger et al. 2012; See, Comber, et al. 2013; See, McCallum, et al. 2013).
24
83%. Quality was further assured by correcting for biases based on the number of classifications provided and for specific land cover types. See et al. (2013) used the results of the same project to assess the variability of class assignment between experts and non-experts, and concluded that, while for some land cover classes, the experts performed better, non-experts learned over time and improved their performance. Although the project was considered to be successful, several strategies were identified that could further improve the results, such as allowing for indication of the percentage of land cover types, use of additional auxiliary data, such as geological maps, and implementation of a communication mechanism between the volunteers, allowing users to learn through this channel.
Foody et al. (2013) used data collected by this project to assess the accuracy of the VGI provided by multiple volunteers, which showed considerable variation between volunteers. They then used latent class analysis to extract information on the quality of the resulting data, including the producer’s accuracy without using reference data.
The Geo-Wiki project has developed several branches with different aims, including the assessment of different biomass datasets (http://biomass.geo-wiki.org), classification of urban areas into local climate zones (http://cities.geo-wiki.org), a repository for global maps of livestock (http://livestock.geo-wiki.org), a validation tool for regional-scale land cover and land cover change (http://lacoval.geo-wiki.org) and the validation of Australian maps of land cover and biophysical variables (http://auscover.geo-wiki.org).
The VIEW-IT project was used to acquire reference data to train classifiers and validate the classification results of several projects, such as the production and validation of a land use/land cover map for Latin America and the Caribbean (Clark and Aide, 2011), assessment of deforestation and reforestation of Latin America and the Caribbean (Aide et al., 2013) and identification of forest transitions in central America (Redo et al., 2012). Since VIEW-IT uses selected volunteers to perform the classifications, they receive initial training using an example dataset, which enables assessment of their performance before using the system. Therefore, some problems that may occur in projects that are open to all volunteers are not likely to occur, such as malicious contributions and incorrect classifications due to lack of knowledge.
25
in Kenya (in this case the classification of road types from imagery) using three types of contributors: individuals with no surveying experience but local knowledge, professional surveyors with local knowledge, and professional surveyors without local knowledge. The results showed that overall, local knowledge resulted in higher accuracy, regardless of whether the individuals had surveying experience or not. Those with surveying experience but no local knowledge did considerably worse in terms of accuracy, i.e. 68% compared to 92%. There was also a difference in accuracy based on the types of roads classified, where local knowledge helped identify smaller roads and tracks more accurately than tarmacked roads (or roads which could be more easily identified from the images). The conclusions were that communities with local knowledge should be involved in the co-production of spatial information. Not only would this reduce costs and be more accurate, but the maps could be updated more frequently. The quality control was ensured by experts who visited the roads on the ground (i.e. an approach of type D4).
5. Discussion and Conclusions
Amongst the wide variety of VGI currently available, some have been used as sources of data to assist in the validation of land cover maps. Two projects were developed for this aim, namely the Geo-Wiki project and the VIEW-IT project. Both use images made available by Google Earth and enable the inclusion of other types of data to assist the volunteers, such as photographs from the DCP and Panoramio, and environmental contextual data for the generation of more reliable information. Both projects have some training procedures and the data have subsequently been used in research. Therefore, they can be considered as promising tools. The developers of Geo-Wiki have developed several approaches to the assessment of data quality, and plan to continue to develop more approaches in this area in the future, since this is crucial for the appropriate use of VGI for these types of applications. The VIEW-IT project presents characteristics similar to the Geo-Wiki project, but is not openly available to all volunteers. Rather it relies on the use of selected volunteers for particular projects and has therefore implemented some preliminary control over the volunteer performance.
26
when their descriptions were not used, more divergence in the classification of the photographs was observed (Foody and Boyd 2013). This may be due to the information provided in the descriptions, to the different information used, or to other factors related to the classification of the photographs, such as the classes used. Two aspects make the data collected by the DCP particularly useful for land cover map validation. Firstly, the photographs are collected using a systematic approach (at every integer degree of latitude and longitude), which is compatible to good practices for accuracy assessment (Stehman 2009). Secondly, at each location, photographs are collected in the four cardinal directions, which is useful to have a better understanding of the region in which the point is located. Photograph descriptions can also be of use to improve the classification of LC at these sites. However, the spatial density of DCP data makes this project only potentially useful for the validation of global or continental maps.
Some preliminary studies have been done regarding the use of photographs from Panoramio and Flickr. One difficulty regarding the use of this data is the uneven distribution of the photographs, either geographically, temporally and by land cover class, which means that it is difficult to select a sample representative of the population (Estima and Painho 2013b). In addition, their positional accuracy varies considerably, as shown by Hochmair and Zielstra (2012), and it can be difficult to extract information on land cover classes from the photographs, since the photographs are not taken with this original purpose in mind (Estima, Fonte, and Painho 2014). The problem of spatial distribution may be overcome by approaches such as the one used in Geograph, where the spatial distribution of the collected photographs is taken into consideration, however this project is only available in UK and Germany at present.
27
be enough information to assess the accuracy of some classes (Estima and Painho 2013a).
As discussed above, a key caveat when using VGI to validate land cover maps is the fact that its volume, low cost and currency are likely to be offset by patchy data coverage and quality. Foody (2009; 2010; 2011; 2013) has repeatedly shown the large impacts that imperfect ground reference data may have on the results of the accuracy assessment, which demonstrates that the use of VGI for this purpose needs to be carefully controlled if reliable results are to be achieved. Therefore it is vital to develop methods for assessing the quality of VGI, so that data with appropriate levels of quality for a specific need can be distinguished and selected. Some quality aspects of VGI have already been studied in the wider Web 2.0 context for non-spatial crowdsourcing applications - for example, the assessment of contributors’ credibility or labelling accuracy in collaborative projects like, Wikipedia and Mechanical Turk. Interesting methodologies have been developed for the automated assessment of contributor credibility and labelling accuracy in these more general contexts (e.g. Allahbakhsh et al.
2013, Flanagin and Metzger, 2008, Ipeirotis et al. 2014, Tang and Lease, 2011), and many may be re-usable in the VGI context. Other aspects are specific to geographic information, such as positional accuracy, completeness and currency of the data, and these should be addressed within the context of geographic information requirements (Elwood, Goodchild, and Sui 2013). Even though VGI may have different levels of quality, as Foody et al. (2013) have shown, when enough data are available, it is possible to apply methodologies that enable the extraction of useful information. Moreover, See et al. (2013), Iwao (2006) and De Leeuw et al. (2011) have shown that the contributions of volunteers may, in some cases, be as good as experts or even better, since locals with some training are more likely to produce better results than experts with no local knowledge.
28
Authoritative best practices for land cover map validation originally evolved around ‘gold standard’ reference datasets representing snapshots in time which required significant time and expense to collect. In the face of more detailed and regular sensor data, rapidly increasing land cover change and habitat degradation, and disasters which continue to require significant spatial planning, the real world requires land cover maps which address a wider variety of themes and which can be generated and quality-assessed more quickly than is possible using this costly and time consuming approach. Therefore, further development of automated (type A) methods of quality assessment are desirable, providing current information on VGI quality, to assist its assessment of fitness for use.
The growing interest in VGI for land cover map validation is unsurprising, given its potential to harness the crowd for specific campaigns of data verification, using, for example, websites such as the Ushahidi platform (http://www.ushahidi.com), its spatial and temporal coverage, its potential to be a useful source of data to assess not only land cover but also land use (Newsam 2010) and its low cost. However, this also raises challenges, related mostly to data quality and heterogeneity. This article has given an overview of critical aspects related to VGI use for land cover map validation, highlighting strengths and weaknesses. It is a topic in which further work is needed. Acknowledgements
The production of this review benefited from support from EU COST Action TD1202 ‘Mapping and the Citizen Sensor’ which is greatly appreciated.
References
Aide, T. M., Clark, M. L., Grau, H. R., López-Carr, D., Levy, M., Redo, D., Bonilla-Moheno, M., Riner, G., Andrade-Núñez, M. J., & Muñiz, M. 2013. “The deforestation and reforestation of Latin America and the Caribbean (2001–2010)”.
Biotropica. doi: http://dx.doi.org/10.1111/j.1744-7429.2012.00908.x.
Allahbakhsh, M., B. Benatallah, A. Ignjatovic, H.R. Motahari-Nezhad, E. Bertino, and S. Dustdar. 2013. “Quality Control in Crowdsourcing Systems: Issues and Directions.” IEEE Internet Computing 17 (2): 76–81. doi:10.1109/MIC.2013.20. Bastin, L., G. Buchanan, A. Beresford, J. -F. Pekel, and G. Dubois. 2013. “Open-Source
Mapping and Services for Web-Based Land-Cover Validation.” Ecological Informatics 14 (March): 9–16. doi:10.1016/j.ecoinf.2012.11.013.
29
Map of Rainfed Cropland Areas (GMRCA) at the End of Last Millennium Using Remote Sensing.” International Journal of Applied Earth Observation and Geoinformation 11 (2): 114–29. doi:10.1016/j.jag.2008.11.002.
Bontemps, S., P. Defourny, E. van Bogaert, O. Arino, V. Kalogirou, and J.R. Perez. 2011. “GLOBCOVER 2009: Products Description and Validation Report.” European
Space Agency.
http://ionia1.esrin.esa.int/docs/GLOBCOVER2009_Validation_Report_2.2.pdf. Clark, Matthew L., and T. Mitchell Aide. 2011. “Virtual Interpretation of Earth
Web-Interface Tool (VIEW-IT) for Collecting Land-Use/land-Cover Reference Data.”
Remote Sensing 3 (3): 601–20. doi:10.3390/rs3030601.
Comber, Alexis, Linda See, Steffen Fritz, Marijn Van der Velde, Christoph Perger, and Giles Foody. 2013. “Using Control Data to Determine the Reliability of Volunteered Geographic Information about Land Cover.” International Journal of Applied Earth
Observation and Geoinformation 23 (August): 37–48.
doi:10.1016/j.jag.2012.11.002.
Congalton, Russell G., and Kass Green. 1998. Assessing the Accuracy of Remotely Sensed Data: Principles and Practices. CRC Press.
De Leeuw, Jan, Mohammed Said, Lapezoh Ortegah, Sonal Nagda, Yola Georgiadou, and Mark DeBlois. 2011. “An Assessment of the Accuracy of Volunteered Road Map Production in Western Kenya.” Remote Sensing 3 (12): 247–56. doi:10.3390/rs3020247.
Devillers, Rodolphe, and Robert Jeansoulin. 2010. Fundamentals of Spatial Data Quality. John Wiley & Sons.
Di Gregorio, A. 2005. Land Cover Classification System. Version 2. Rome Italy: Food and Agriculture Organization of the United Nations.
Elwood, Sarah, Michael F. Goodchild, and Daniel Z. Sui. 2012. “Researching Volunteered Geographic Information: Spatial Data, Geographic Research, and New Social Practice.” Annals of the Association of American Geographers 102 (3): 571– 90. doi:10.1080/00045608.2011.595657.
Elwood, Sarah, Michael F. Goodchild, and Daniel Z. Sui. 2013. “Prospects for VGI Research and the Emerging Fourth Paradigm.” In Crowdsourcing Geographic Knowledge, edited by Daniel Z. Sui, Sarah Elwood, and Michael Goodchild, 261–75.
Netherlands: Springer.
http://www.springer.com/earth+sciences+and+geography/geographical+information +systems/book/978-94-007-4586-5.
Estima, Jacinto, C.C. Fonte, and Marco Painho. 2014. “Comparative Study of Land Use/Cover Classification Using Flickr Photos, Satellite Imagery and Corine Land Cover Database.” In 17th AGILE International Conference on Geographic Information Science. Castellon, Spain.
Estima, Jacinto, and Marco Painho. 2013a. “Exploratory Analysis of OpenStreetMap for Land Use Classification.” In Proceedings of the Second ACM SIGSPATIAL International Workshop on Crowdsourced and Volunteered Geographic Information,
39–46. GEOCROWD ’13. New York, NY, USA: ACM.
30
Estima, Jacinto, and Marco Painho. 2013b. “Flickr Geotagged and Publicly Available Photos: Preliminary Study of Its Adequacy for Helping Quality Control of Corine Land Cover.” In Computational Science and Its Applications – ICCSA 2013, edited by Beniamino Murgante, Sanjay Misra, Maurizio Carlini, Carmelo M. Torre, Hong-Quang Nguyen, David Taniar, Bernady O. Apduhan, and Osvaldo Gervasi, 205–20. Lecture Notes in Computer Science 7974. Springer Berlin Heidelberg. http://link.springer.com/chapter/10.1007/978-3-642-39649-6_15.
Feddema, Johannes J., Keith W. Oleson, Gordon B. Bonan, Linda O. Mearns, Lawrence E. Buja, Gerald A. Meehl, and Warren M. Washington. 2005. “The Importance of Land-Cover Change in Simulating Future Climates.” Science 310 (5754): 1674–78. doi:10.1126/science.1118160.
Flanagin, Andrew, and Miriam Metzger. 2008. “The Credibility of Volunteered Geographic Information.” GeoJournal 72: 137–48.
Foley, Jonathan A., Ruth DeFries, Gregory P. Asner, Carol Barford, Gordon Bonan, Stephen R. Carpenter, F. Stuart Chapin, et al. 2005. “Global Consequences of Land Use.” Science 309 (5734): 570–74. doi:10.1126/science.1111772.
Foody, Giles M. 2002. “Status of Land Cover Classification Accuracy Assessment.”
Remote Sensing of Environment 80 (1): 185–201.
doi:10.1016/S0034-4257(01)00295-4.
Foody, Giles M. 2009. “The Impact of Imperfect Ground Reference Data on the Accuracy of Land Cover Change Estimation.” International Journal of Remote Sensing 30 (12): 3275–81. doi:10.1080/01431160902755346.
Foody, Giles M. 2010. “Assessing the Accuracy of Land Cover Change with Imperfect Ground Reference Data.” Remote Sensing of Environment 114 (10): 2271–85. doi:10.1016/j.rse.2010.05.003.
Foody, Giles M. 2011. “Impacts of Imperfect Reference Data on the Apparent Accuracy of Species Presence-Absence Models and Their Predictions: Imperfect Reference Data.” Global Ecology and Biogeography 20 (3): 498–508. doi:10.1111/j.1466-8238.2010.00605.x.
Foody, Giles M. 2013. “Ground Reference Data Error and the Mis-Estimation of the Area of Land Cover Change as a Function of Its Abundance.” Remote Sensing Letters 4 (8): 783–92. doi:10.1080/2150704X.2013.798708.
Foody, G.M., and D.S. Boyd. 2013. “Using Volunteered Data in Land Cover Map Validation: Mapping West African Forests.” IEEE Journal of Selected Topics in
Applied Earth Observations and Remote Sensing 6 (3): 1305–12.
doi:10.1109/JSTARS.2013.2250257.
Foody, G. M., L. See, S. Fritz, M. Van der Velde, C. Perger, C. Schill, and D. S. Boyd. 2013. “Assessing the Accuracy of Volunteered Geographic Information Arising from Multiple Contributors to an Internet Based Collaborative Project.” Transactions in GIS 17 (6): 847–60. doi:10.1111/tgis.12033.
31
Fritz, Steffen, Ian McCallum, Christian Schill, Christoph Perger, Roland Grillmayer, Frédéric Achard, Florian Kraxner, and Michael Obersteiner. 2009. “Geo-Wiki.Org: The Use of Crowdsourcing to Improve Global Land Cover.” Remote Sensing 1 (3): 345–54. doi:10.3390/rs1030345.
Fritz, Steffen, Ian McCallum, Christian Schill, Christoph Perger, Linda See, Dmitry Schepaschenko, Marijn van der Velde, Florian Kraxner, and Michael Obersteiner. 2012. “Geo-Wiki: An Online Platform for Improving Global Land Cover.”
Environmental Modelling & Software 31 (May): 110–23.
doi:10.1016/j.envsoft.2011.11.015.
Fritz, Steffen, Linda See, Marijn van der Velde, Rachel A. Nalepa, Christoph Perger, Christian Schill, Ian McCallum, et al. 2013. “Downgrading Recent Estimates of Land Available for Biofuel Production.” Environmental Science & Technology 47 (3): 1688–94. doi:10.1021/es303141h.
Goodchild, Michael F. 2007. “Citizens as Sensors: The World of Volunteered Geography.” GeoJournal 69 (4): 211–21. doi:10.1007/s10708-007-9111-y.
Goodchild, Michael F., and Linna Li. 2012. “Assuring the Quality of Volunteered Geographic Information.” Spatial Statistics 1 (May): 110–20. doi:10.1016/j.spasta.2012.03.002.
Guptill, Stephen C., and Joel L. Morrison. 1995. Elements of Spatial Data Quality. Elsevier Science Limited.
Haklay, Muki. 2013. “Citizen Science and Volunteered Geographic Information: Overview and Typology of Participation.” In Crowdsourcing Geographic Knowledge, edited by Daniel Sui, Sarah Elwood, and Michael Goodchild, 105–22. Springer Netherlands. http://link.springer.com/chapter/10.1007/978-94-007-4587-2_7.
Haklay, Muki, Sofia Basiouka, Vyron Antoniou, and Aamer Ather. 2010. “How Many Volunteers Does It Take to Map an Area Well? The Validity of Linus’ Law to Volunteered Geographic Information.” The Cartographic Journal 47 (4): 315–22. Harvey, Francis. 2013. “To Volunteer or to Contribute Locational Information?
Towards Truth in Labeling for Crowdsourced Geographic Information.” In
Crowdsourcing Geographic Knowledge, edited by Daniel Sui, Sarah Elwood, and
Michael Goodchild, 31–42. Springer Netherlands.
http://link.springer.com/chapter/10.1007/978-94-007-4587-2_3.
Hassan, R., R. Scholes, and N. Ash. 2005. Ecosystems and Human Well-Being - Current State and Trends: Volume I. Island Press.
Heipke, Christian. 2010. “Crowdsourcing Geospatial Data.” ISPRS Journal of
Photogrammetry and Remote Sensing 65 (6): 550–57.
doi:10.1016/j.isprsjprs.2010.06.005.
32
Hochmair, H.H., and Dennis Zielstra. 2012. “Positional Accuracy of Flickr and Panoramio Images in Europe.” In Proceedings of the Geoinformatics Forum, edited by A. Car, G. Griesebner, and J. Strobl, 14–23. Heidelberg: Wichman.
Ipeirotis, Panagiotis G., Foster Provost, Victor S. Sheng, and Jing Wang. 2014. “Repeated Labeling Using Multiple Noisy Labelers.” Data Mining and Knowledge Discovery 28 (2): 402–41. doi:10.1007/s10618-013-0306-1.
Iwao, Koki, K.N. Nasahara, T. Kinoshita, Y. Yamagata, D. Patton, and S. Tsuchida. 2011. “Creation of New Global Land Cover Map with Map Integration.” Journal of Geographic Information System 3 (2): 160–65. doi:10.4236/jgis.2011.32013.
Iwao, Koki, Kenlo Nishida, Tsuguki Kinoshita, and Yoshiki Yamagata. 2006. “Validating Land Cover Maps with Degree Confluence Project Information.”
Geophysical Research Letters 33 (23): n/a – n/a. doi:10.1029/2006GL027768.
Jokar Arsanjani, Jamal, Marco Helbich, Mohamed Bakillah, Julian Hagenauer, and Alexander Zipf. 2013. “Toward Mapping Land-Use Patterns from Volunteered Geographic Information.” International Journal of Geographical Information Science 27 (12): 2264–78. doi:10.1080/13658816.2013.800871.
Kinley, Laura. 2013. “Assessing the Potential for Crowdsourced Geospatial Content to Enhance the Quality of Authoritative Land Cover Mapping.” In . Nottingham, UK: AGI.
Lindquist, E.J., R. D’Annunzio, A. Gerrand, K. MacDicken, F. Achard, R. Beuchle, A. Brink, et al. 2012. Global Forest Land-Use Change 1990–2005. FAO Forestry Paper No. 169. Rome, Italy: Food and Agriculture Organization of the United Nations and European Commission Joint Research Centre.
Lu, D., and Q. Weng. 2007. “A Survey of Image Classification Methods and Techniques for Improving Classification Performance.” International Journal of Remote Sensing 28 (5): 823–70. doi:10.1080/01431160600746456.
MacEachren, Alan M., and Isaac Brewer. 2004. “Developing a Conceptual Framework for Visually-Enabled Geocollaboration.” International Journal of Geographical Information Science 18 (1): 1–34. doi:10.1080/13658810310001596094.
Mayaux, P., H. Eva, J. Gallego, A. H. Strahler, M. Herold, S. Agrawal, S. Naumov, et al. 2006. “Validation of the Global Land Cover 2000 Map.” IEEE Transactions on
Geoscience and Remote Sensing 44: 1728–37.
http://www.scopus.com/scopus/inward/record.url?eid=2-s2.0-33746330734&partnerID=40.
McCallum I, Franklin O. 2013. “Improved Light and Temperature Responses for Light-Use-Efficiency-Based GPP Models.” Biogeosciences 10: 6577–90. doi:10.5194/bg-10-6577-2013.
Mooney, Peter, Padraig Corcoran, and Adam C. Winstanley. 2010. “Towards Quality Metrics for OpenStreetMap.” In Proceedings of the 18th SIGSPATIAL International Conference on Advances in Geographic Information Systems, 514–17. New York, NY, USA: ACM.
33
Newsam, S. 2010. “Crowdsourcing What Is Where: Community-Contributed Photos as Volunteered Geographic Information.” IEEE MultiMedia 17 (4): 36–45. doi:10.1109/MMUL.2010.79.
Nie, Wenming, Yongping Yuan, William Kepner, Maliha S. Nash, Michael Jackson, and Caroline Erickson. 2011. “Assessing Impacts of Landuse and Landcover Changes on Hydrology for the Upper San Pedro Watershed.” Journal of Hydrology
407 (1–4): 105–14. doi:10.1016/j.jhydrol.2011.07.012.
Olofsson, Pontus, Stephen V. Stehman, Curtis E. Woodcock, Damien Sulla-Menashe, Adam M. Sibley, Jared D. Newell, Mark A. Friedl, and Martin Herold. 2012. “A Global Land-Cover Validation Data Set, Part I: Fundamental Design Principles.”
International Journal of Remote Sensing 33 (18): 5768–88.
doi:10.1080/01431161.2012.674230.
Perger, Christoph, Steffen Fritz, Linda See, Christian Schill, Marijn van der Velde, Ian McCallum, and Michael Obersteiner. 2012. “A Campaign to Collect Volunteered Geographic Information on Land Cover and Human Impact.” In GI_Forum 2012: Geovisualisation, Society and Learning, edited by T. Jekel, A. Car, J. Strobl, and G. Griesebner, 83–91. Berlin / Offenbach: Herbert Wichmann Verlag.
Pontius, Robert Gilmore, and Marco Millones. 2011. “Death to Kappa: Birth of Quantity Disagreement and Allocation Disagreement for Accuracy Assessment.”
International Journal of Remote Sensing 32 (15): 4407–29.
doi:10.1080/01431161.2011.552923.
Pouteau, Robin, and Antoine Collin. 2013. “Spatial Location and Ecological Content of Support Vectors in an SVM Classification of Tropical Vegetation.” Remote Sensing Letters 4 (7): 686–95. doi:10.1080/2150704X.2013.784848.
Redo, D.J., H.R. Grau, T.M. Aide and M.L. Clark. 2012. "Asymmetric forest transition related to the interaction of socio-economic development and forest type in Central America." Proceedings of the National Academy of Sciences, 109, pp. 8839–8844 See, Linda, Alexis Comber, Carl Salk, Steffen Fritz, Marijn van der Velde, Christoph
Perger, Christian Schill, Ian McCallum, Florian Kraxner, and Michael Obersteiner. 2013. “Comparing the Quality of Crowdsourced Data Contributed by Expert and Non-Experts.” PLoS ONE 8 (7): e69958. doi:10.1371/journal.pone.0069958.
See, Linda, Ian McCallum, Steffen Fritz, Christoph Perger, Florian Kraxner, Michael Obersteiner, Ujjal Deka Baruah, Nitrashee Mili, and Napendra Ram Kalita. 2013. “Mapping Cropland in Ethiopia Using Crowdsourcing.” International Journal of Geosciences 4 (6A1): 6–13. doi:http://dx.doi.org/10.4236/ijg.2013.46A1002.
See, Linda, Tobias Sturn, Christoph Perger, Steffen Fritz, Ian McCallum, and Carl Salk. 2014. “Cropland Capture: A Gaming Approach to Improve Global Land Cover.” In
17th AGILE International Conference on Geographic Information Science. Castellon, Spain.
Sieber, Renee. 2006. “Public Participation Geographic Information Systems: A Literature Review and Framework.” Annals of the Association of American Geographers 96 (3): 491–507. doi:10.1111/j.1467-8306.2006.00702.x.
Steele, Brian M. 2005. “Maximum Posterior Probability Estimators of Map Accuracy.”
34
Stehman, Stephen V. 2009. “Sampling Designs for Accuracy Assessment of Land Cover.” International Journal of Remote Sensing 30 (20): 5243–72. doi:10.1080/01431160903131000.
Stehman, Stephen V., Pontus Olofsson, Curtis E. Woodcock, Martin Herold, and Mark A. Friedl. 2012. “A Global Land-Cover Validation Data Set, II: Augmenting a Stratified Sampling Design to Estimate Accuracy by Region and Land-Cover Class.”
International Journal of Remote Sensing 33 (22): 6975–93.
doi:10.1080/01431161.2012.695092.
Strahler, A., L. Boschetti, G.M. Foody, M.A. Friedl, M.C. Hansen, M. Herold, P. Mayaux, J.T. Morisette, S.V. Stehman, and C. Woodcock. 2006. Global Land Cover Validation: Recommendations for Evaluation and Accuracy Assessment of Global Land Cover Maps. Luxembourg: Office for Official Publications of the European Communities. http://landval.gsfc.nasa.gov/pdf/GlobalLandCoverValidation.pdf. Tang, Wei, and Matthew Lease. 2011. “Semi-Supervised Consensus Labeling for
Crowdsourcing.” In: SIGIR 2011 Workshop on Crowdsourcing for Information Retrieval, 36–41. Beijing, China.
Tsendbazar, N.E., S. de Bruin, and M. Herold. 2014. “Assessing Global Land Cover Reference Datasets for Different User Communities.” ISPRS Journal of Photogrammetry and Remote Sensing, March. doi:10.1016/j.isprsjprs.2014.02.008. Verburg, Peter H., Kathleen Neumann, and Linda Nol. 2011. “Challenges in Using
Land Use and Land Cover Data for Global Change Studies.” Global Change Biology
17 (2): 974–89. doi:10.1111/j.1365-2486.2010.02307.x.