1
MATTHEW PIGGOTT,* a,b* MISCHA ZELZER* a,b,c
*Corresponding author
a
Interface and Surface Analysis Centre Boots Science Building
University of Nottingham University Park Nottingham NG7 2RD UK
b
University of Nottingham School of Pharmacy Boots Science Building University Park Nottingham NG7 2RD
UK
c National Physical Laboratory
Teddington Middlesex TW11 0LW
Interface and surface analysis for pharmaceutical
applications: Challenges and recent advances
KEYWORDS: pharmaceutical formulation and development; surface characterisation; drug delivery materials; ionic liquid X-ray spectroscopy (XPS); secondary ion mass spectrometry (SIMS); Raman spectroscopy
ABSTRACT: Innovation in R&D is a key target for the pharmaceutical sector to address some of the challenges it currently faces. This review discusses these challenges in the context of pharmaceutically relevant surfaces and interfaces. The surface properties of materials determine many pharmaceutically important interactions and can be drastically different from the material’s bulk properties. We first introduce current challenges in the surface and interface analysis of pharmaceutical materials in the context of design, administration and fabrication. We then review recent scientific and technological advances aimed to address these issues and shortly discuss a small number of examples to illustrate the capabilities of these techniques.
1. INTRODUCTION
The last decade has presented the pharmaceutical industry with a number of challenges that are expected to affect the long term business models of pharmaceutical companies.1, 2 Concerns relating to aspects of drug safety and efficacy impact the
public image of the pharmaceutical sector. Together with the expiration of several key patents in 2010-2014, these developments affect the valuation and profitability of pharmaceutical products.1
Innovation in R&D and a clear demonstration of the value of pharmaceutical products have been identified as key aspects to tackle these issues.1, 3-5 However, the development of pharmaceutical products is highly challenging and traditionally associated
with long and costly development phases. Reforming these processes to minimise risk of failure and reduce development cost has therefore been proposed as a core requirement to reform pharmaceutical development.1, 4-6
Key aspects for innovation in drug development are to improve the predictability of the properties, performance and production of drugs and to establish mechanisms that enable early go/no-go decisions.1, 3 To realise this, it is paramount that we overcome
current limitations in our understanding of how drugs interact with the body and their co-formulated excipients both on an organism and a molecular level.3 Besides the development of new biomarkers, analytical tools able to assess drug performance in pre-clinical and clinical tests are required. 1, 3 Many of these analytical challenges revolve around interfacial biological processes; consequently, surface and interface analysis has the potential to contribute significantly to these challenges and support the development of new approaches for pharmaceutical analysis.
2
academia has the potential to fill gaps in science and provide access and expertise to innovative procedures and equipment that is otherwise unavailable to pharmaceutical companies.3
In the following review, we will identify the challenges and opportunities presented by surface and interfacial analysis in pharmaceutical problems. We will then provide a brief account of recent technological advances for a selected number of techniques, accompanied by a number of examples to illustrate their application potential for pharmaceutical problems.
2. CHALLENGES IN PHARMACEUTICAL CHARACTERISATION
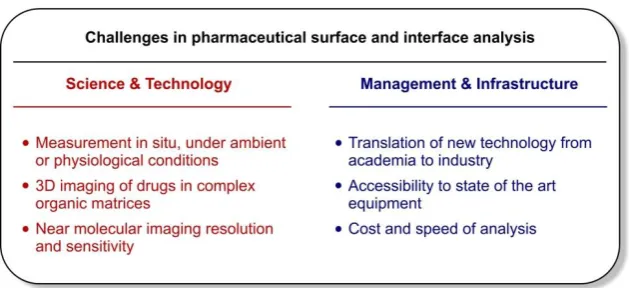
[image:2.595.72.387.266.410.2]Surface and interface analysis has become an integral part of pharmaceutical research and technology development. Advances in analytical capabilities have contributed significantly to understanding of the performance of pharmaceutical products; yet, significant challenges remain. The nature of these challenges is diverse and ranges from science and technology to management and infrastructural aspects. Some of them are highlighted in Figure 1 and will be discussed below in the context of design, administration and manufacturing of pharmaceutical products.
Figure 1. Key challenges in surface and interface analysis for pharmaceutical applications.
2.1. Characterising pharmaceutical formulations
Physicochemical properties of pharmaceutical formulations, next to other aspects such as potency, scalability, cost etc., are among the main factors that drive pharmaceutical performance and efficacy.3 For example drug availability, stability and the rate of dissolution can vary greatly with properties such as morphology, roughness and drug distribution in a matrix.8, 9 Equally, the chemical properties of a surface affect the interaction of materials at an interface within a system or indeed between that system and its environment. Identifying and characterising these properties is therefore essential to understand why formulations are successful or fail.
It is the understanding of these surfaces and interfacial properties and interactions that are particularly important. Bulk chemical and physical analytical methods such as NMR, infrared spectroscopy, traditional mass spectrometry, x-ray diffraction, dynamic light scattering etc. have been the mainstay of material characterisation catalogues.10 While providing necessary and important information, these techniques do not offer insight into interfacial and surface phenomena. For example, active pharmaceutical ingredient (API) distribution and morphology can be markedly different on the surface of a tablet as compared to the bulk material.11 Standard bulk characterisation techniques are unable to identify these subtle differences whereas surface sensitive analysis techniques are able to distinguish between the top molecular layer and the bulk of the material.
2.2. Administration and interaction
Characterising spatial and temporal changes of the API composition (stability) and distribution in a formulation during uptake and release is essential to understand drug performance. As the interactions of a tablet or drug delivery particle with its biological surrounding takes place at the solid-liquid interface, characterising surface and interfacial properties of the formulation become extremely important.11, 12 However, analysing these materials and their surfaces under physiologically relevant conditions presents a significant challenge. Routine dissolution tests only provide limited information about the distribution of APIs within a tablet.8 Surface analysis techniques such as X-ray photoelectron spectroscopy (XPS) and mass spectrometry have been used but for these ex-situ methods the effect of sample preparation for analysis in low pressure environments is a critical issue.8 The continued development of surface analysis techniques operating under near ambient conditions 13, 14 has the potential to address this issue.
Knowledge of where in the body and in the cell the APIs accumulate is an important aspect related to drug efficacy and toxicity.3 Mass spectrometry techniques are able to identify and image (both in 2D and 3D) APIs in biological tissue in a
3
as well as the sensitivity of these techniques 16-18 to enable insight into molecular level interactions of APIs with cells.15
Moreover, issues with the preparation of complex biological samples and the effect of matrices on the mass spectra need to be addressed.8, 18
2.3. Manufacturing, packaging and quality control
Drug development not only requires the design or discovery of APIs with appropriate targets and uptake characteristics, the API also has to be stable and able to be produced in a scalable manufacturing process in an appropriate dosage form.3 The surface of solid dosage forms plays a major role during manufacturing, packaging and quality control of pharmaceutical products.19, 20
These interactions must be understood and well controlled to prevent undesired interactions, inter-batch variability or contaminations that affect the performance of the formulation.8, 19
While these aspects of surface analytics are unlikely to present significant scientific challenges in terms of analysis, selection and availability of the correct techniques may represent a barrier. Translation of knowledge and cooperation between industry and academia is essential to address these aspects and support the development of the pharmaceutical industry towards more efficient R&D models.21
3. RECENT ADVANCES IN SURFACE AND INTERFACE ANALYSIS
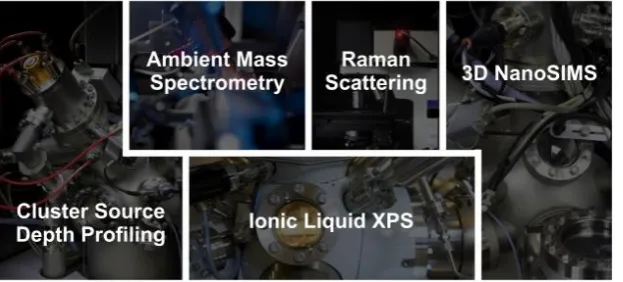
[image:3.595.76.388.370.511.2]A key element in meeting the challenges described above is the ability and capacity to adapt to advances in technical and operational methodologies. The routine bulk characterisation techniques discussed above are often favoured due to their established capabilities and operational familiarity which inherently conforms to a heavily regulated framework. This comes with the risk that novel methods and developments can be negatively selected against, which presents an obstacle to efficient development. Subsequently, we will discuss a series of advances in surface and interface analysis pertinent to pharmaceutical research that have potential to function as powerful research tools and help address the challenges outlined (Figure 2). We will particularly highlight the possibility to study the distribution of non-labelled APIs in 3D and recent developments towards measuring surfaces and interfaces of pharmaceutically relevant samples under ambient conditions.
Figure 2. Some state of the art surface and interface analysis tools and technologies. Images reproduced with permission from ISAC and NPL (in parts © Crown copyright, Courtesy of NPL).
3.1. Cluster source depth profiling
Polyatomic ion sources used with surface sensitive analytical techniques such as XPS and Time-of-Flight Secondary Ion Mass Spectrometry (ToF- SIMS) have been fundamental to advances in organic sample analysis. The ability to profile the chemistry of organic materials was enabled by the development of cluster ion sources that provide increased sputter yields in conjunction with reduced subsurface damage.22 With depth sensitivities as low as 5-10 nm, these ion sources allow multilayer or composite materials to be chemically characterised in 3D. However some complex pharmaceutically relevant materials such as cross-linked polymers and hydrogels have continued to prove difficult to analyse with traditional cluster sources such as C60
n+
. Significant damage accumulation persists, causing a rapid loss in secondary ion signal and sputter yields.23
The recent development of Argon gas cluster beam technologies (Arn+) has addressed these issues. Arn+ sources showcase a
significant reduction in chemical damage, with the capacity to achieve constant depth resolution and sputtering yields rarely seen using C60
n+
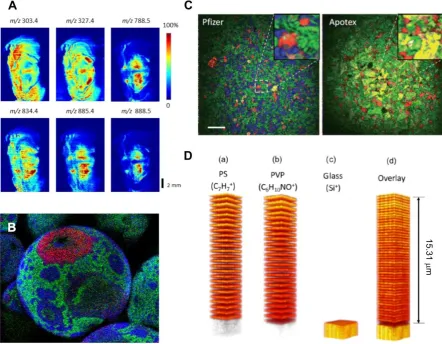
(see for example Fig 3 D).24 Therefore, the growing number of XPS and ToF-SIMS facilities with an Argon cluster source havethe capacity to characterise the spatial and lateral surface specific chemistries of a broader range of organic substrates without labelling, to an almost unrivalled resolution. Furthermore, the distinct differences in sputter yield that Arn+
sources provide on organic and inorganic materials can be used to directly localise and manipulate organic/inorganic interfaces.25 Translation of this technology to investigate medical devices such as drug loaded polymeric stents or impregnated
4
3.2. Ionic liquid X-Ray photoelectron spectroscopy
XPS has increasingly been utilised to analyse the surface chemistry of novel drug delivery formulations, in particular with respect to the process of micro particle fabrication for drug delivery9, 26-28 XPS’ ability to characterise both the elemental and chemical state of the surface makes it almost uniquely capable of identifying and quantifying the functional chemistry.29 However the technique requires ultra-high vacuum (UHV) conditions to avoid electron scattering by a gas phase and ensure sample cleanliness. This has precluded the analysis of materials unstable in a vacuum, including liquid formulations and many biopharmaceutical products. However recent advances in the area have opened up the capacity to work with a broader range of materials and expand the utility of XPS into additional applications.
Ionic liquids are salts with melting points below 100˚C, (some are liquid at room temperature) that possess ‘extremely low volatility, unusual solvation and miscibility characteristics, a large electrochemical window, high thermal stability, nonflammability and electroconductivity’.30
They have potential application in the pharmaceutical industry either as APIs themselves, or as solvents or co-solvents for the delivery of drugs with poor water solubility.31 This interest has been driven by the capacity to adjust the properties of an ionic liquid formulation by altering the ionisable functional groups to overcome poor solubility, bioavailability issues, stability and polymorphism and foster new delivery options such as slow release systems.32
Over last decade, it was established that the volatility of ionic liquids is low enough to render them stable in UHV conditions and will not contaminate sensitive operational systems. As such the nanometre resolution and ppm / ppt sensitivities of UHV surface analytics can now be applied to ionic liquid systems. The introduction of unique XPS facilities dedicated to these liquids, such as the LiPPS (Liquid Phase Photoelectron Spectroscopy) instrument at the University of Nottingham, presents an opportunity to develop the surface characterisation of a potentially revolutionary formulation component, or utilise them as a medium for more abstract sample presentations.
3.3. Ambient mass spectrometry techniques
A significant number of technical developments in the mass spectrometry field (and indeed with other chemical analysis tools such as confocal Raman) have been complemented with expanding operational experience that has significantly increased the capacity for ‘in-situ’ analysis of a broadening range of samples. Desorption electrospray Ionization mass spectrometry (DESI), liquid extraction surface analysis (LESA), plasma assisted desorption ionization mass spectrometry (PADI) are all ambient mass spectrometry techniques that have been developed to not simply spectrally analyse complex samples with high mass sensitivities, but also chemically map them to determine distributions of biomolecules.33 In conjunction with other related ionization techniques such as matrix assisted laser desorption mass spectrometry (MALDI), biological samples such as brain tissue have been characterised without extensive pre-treatment or labelling under ambient or in-situ conditions (see for example Figure 3 A).33 This lends itself towards trains of analysis such as the permeation of APIs (particularly proteins) through
skin, and the localisation of chemical components in a given physiological system.34-36 The spatial resolution of these
techniques is constantly improving (currently tens to hundreds of microns), and has contributed to their developing catalogue of applications.37
3.4. Coherent Raman scattering
Traditional Raman spectroscopy relies on the spontaneous inelastic scattering of light to generate spectra unique to a material’s molecular composition and state. However, such spontaneous scattering is typically very weak (the scattered intensity is about 10-6 less than that of the incident radiation38) and therefore imaging based on this process tends to be very slow (although improving rapidly). Furthermore spectra may sometimes struggle with broad features due to a sensitivity to conformational differences in structure, differences in environment and rapid dephasing processes, giving rise to feature overlap and an occluded spectra.39 Coherent Raman scattering techniques offer a solution to this, by using non-linear excitation to enhance the scattering signal. By using simultaneous excitation with two laser beams at different frequencies, when the difference in the two frequencies match that of a given molecular vibration, the interaction of the beams and the sample give rise to a coherent vibrational motion, greatly enhancing the signal.40
Coherent anti-stokes Raman scattering (CARS) and stimulated Raman scattering (SRS) are the two principal variations of this technique and have been available for some time, but it has been with recent technical updates in non-linear optics and laser technologies that the potential applications have grown. These techniques are now capable of offering video speed imaging, dynamic assessment of vibrational coherences as well as higher spectral resolutions. The ability of Raman techniques to operate under ambient or environmentally controlled conditions, in-situ and to detect subtle physicochemical changes (polymorphisms, crystallinity etc.) without labelling makes such adaptations very attractive for real time tissue or cellular imaging, API localisation, and/or dynamic API response monitoring. Recent examples of pharmaceutically pertinent applications include non-invasive 3D permeation assessment of API delivery through skin,41 the real time dissolution analysis of an oral dosage form42 and the characterisation of binder distribution in API-sugar-polymer granules (see Figure 3 C).43
3.5. Tip enhanced Raman scattering
Another emerging Raman technique is tip enhanced Raman scattering (TERS). TERS developed over the last decade as a high resolution variant of surface enhanced Raman scattering (SERS).44 In SERS, the ability of light to excite localised surface
5
While the potential of high resolution spectral imaging with TERS is evident, a number of challenges remain to be addressed before the technique will find broader application. One of the main remaining issues currently is the reproducible manufacture of metal tips in order to obtain a stable field enhancement.44 For other issues such as the background signal resulting from the far field illumination and the generation of artefacts due to thermal drifts, fluctuations of the signal intensity etc., solutions have been proposed.48-51 The application of TERS in liquid environments has been reported to be feasible,52, 53 but the liquid surrounding introduces other challenges such as tip contamination and stability that have to be addressed.44 While TERS still
requires significant development before it will become a routine surface analysis technique, the attractiveness of obtaining spectra of sample surfaces with nanometre resolution on biological samples such as lipids, cells and biominerals has already generated considerable interest54. Thisis likely to see TERS become a major tool in the analysis of pharmaceutical samples ex- and in-vivo
3.6. 3D NanoSIMS
Announced at the back end of 2013, the National Physical Laboratory (NPL) confirmed the development of a new 3D nanoSIMS system. The project is a pioneering collaboration between the National Centre of Excellence in Mass Spectrometry Imaging (NICE-MSI) at NPL, GlaxoSmithKline (GSK), ION-TOF, Thermo Scientific and academics from the University of Illinois and the University of Nottingham. The project builds upon the achievements of the pre-existing CAMECA nanoSIMS instrument. These current machines use a specific alignment of primary and secondary ion beams that allow the primary focussing lens to be closer to the sample, thereby reducing focussing aberrations.55 This has allowed spatial resolutions of down to 50 nm, but is limited to elemental information in 2D, with appropriate labelling and mechanical sectioning.55 The 3D
[image:5.595.77.520.320.664.2]nanoSIMS instrument is being designed to match the spatial resolution of the current nanoSIMS while providing 3D, label-free, molecular imaging. These adaptations will open the door to even more versatile, unadulterated measurements of intracellular API concentrations and localisation at a cellular (and perhaps cell site) level. While still under manufacture, this potentially revolutionary instrumentation development is a prime example of the unique and positive outcomes of collaborations between academia and industry in refining approaches to pharmaceutical development.
6
Bailey, R. Havelund, J. S. Sharp, A. G. Shard, I. S. Gilmore, M. R. Alexander, and D. J. Scurr, “Argon cluster ion beam depth profiling of polymer multi-layer films”. Image courtesy of Dr David Scurr, University of Nottingham.
4. CASE STUDIES
4.1. Coherent Raman scattering characterisation of drug disposition
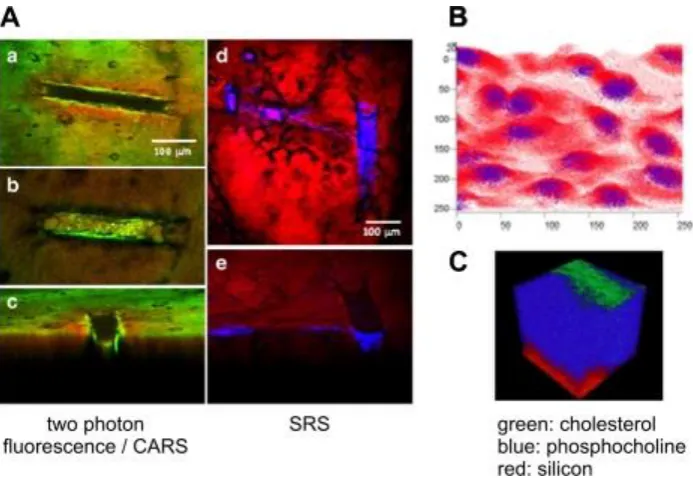
The advancement of coherent Raman scattering technologies and the growing catalogue of published SRS and CARS research applications could provide the basis for updated and streamlined pharmaceutical analysis protocols. As discussed in section 3.4, a principal advantage of these newer techniques is the potential for label free, in-situ chemical imaging at video speed with high resolution. Some recent examples of published work showcase the particular strengths of these techniques in their application to assessments of drug disposition. Belsey et al. demonstrated the capacity of coherent Raman scattering to characterise topical pharmaceutical delivery through skin tissue.41 In this work both SRS and CARS were used to visualise and measure ketoprofen and ibuprofen as well as nanoparticle delivery through porcine skin. Characterisation was performed in 3D, showcasing the formulation at the surface, skin penetration of the API, the drug delivery pathways and final API localisation.
SRS allowed semi-quantitative concentration gradients to be measured through skin layers. This was achieved with simultaneous 3D visual localisation of the transport pathways of the APIs and physical characterisation of changes to the formulation e.g. crystallisation of API at the surface. Nanoparticulate delivery uptake into thermally ablated channels was also characterised in 3D using CARS.41 These analyses were performed without the need to employ traditional sequential skin stripping preparation that is invasive and labour intensive. Furthermore, the Raman techniques enabled small nanoparticles (~40nm diameter) to be resolved individually beyond the resolution capability of fluorescent microscopy.
Other research showcases equally impressive and diverse results; for example, using SRS Wei et al. characterise (among a range of processes including DNA synthesis etc.) the spatial distribution of the antifungal drug terbinafine hydrochloride and its delivery pathway into ear tissue.59 By using Raman sensitive, alkyne tags, bulky and pharmacokinetically damaging fluorophores were avoided and live imaging in-vivo was possible.
Other applications of these techniques have exploited the increased speed and resolution possible with CARS imaging to investigate pharmaceutical dosage forms. Fussell et al. imaged the dissolution of theophylline anhydrate from a series of formulations and related real-time changes of surface content and morphology to a concurrent UV dissolution profile.60
Importantly, growth of theophylline monohydrate crystals could be visualised and associated with a decrease in dissolution rate. Fonteyne et al. used CARS to visualise and prove homogeneous binder distribution within granules produced by twin screw wet granulation.43 Hartshorn et al. used the improved spatiochemical resolution of CARS to confirm a previously unidentified API phase in an Indomethacin dosage form while operating with 10x faster speeds than conventional Raman spectroscopy.61 Such examples highlight how recent advances in the coherent Raman scattering field offer the capability to perform real time chemical imaging for a broadening range of pharmaceutical analyses.
4.2. Imaging of biomolecules in tissue with ToF-SIMS
In section 2 we highlighted the importance of identifying specific biomolecules or drugs within a biological sample – either tissue sections or individual cells – in a spatially and temporally resolved manner. ToF-SIMS is one technique where technical developments have expanded the potential for unlabelled, high resolution 3D chemical mapping. Localisation of molecules in biological samples is becoming increasingly accessible due to the ongoing developments in cluster sources for SIMS techniques discussed in section 3.1..62 The introduction of the C60
+
cluster source opened up the ability to depth profile cells using mass spectrometry. While initially large cells (oocytes) were used,63 improved operational and data analysis procedures have increased the spatial resolution and quality of 3D MS cell imaging,63-65 providing for example 3D images of fibroblasts.65 One particular example demonstrates that ToF-SIMS of HeLa cells using C60+ cluster ion beams to sputter the biological
sample and a Bi3+ liquid metal ion gun to analyse it in a layer by layer fashion is able to provide 3D chemical maps of the cells
when the sample is z-corrected on the basis of a combined atomic force microscope image.64 The distribution of a non-native compound, bromodeoxyuridine, a nuclear marker, was thus visualised and shown to be localised at the nucleus of the cell, demonstrating the ability of the technique to provide label free chemical maps of drugs within biological samples.
SIMS imaging of tissue samples in 2D has already advanced to pre-clinical applications. For example, the skin penetration of topically applied drugs (roflumilast, tofacitinib, ruxolitinib, chlorhexidine) was evaluated in cross sections of mouse ears and porcine skin66, 67 and the distribution of various biomolecules (non-alcoholic fatty acids, cholesterol, vitamin E) was visualised in liver biopsies obtained from human patients.68 Advancing the application of 3D SIMS imaging to tissue samples, the recently developed argon cluster source was employed to generate a 3D chemical map of a 14 m thick rat brain tissue.69 Dual beam
depth profiling, using Ar1500+ for sputtering and Bi3+ for analysis, was used to generate a 3D image of the rat brain slice in which
the distribution of phosphocholine (PC) and cholesterol as well as the presence of the silicon wafer substrate were visualised in a label free manner. It was shown that cholesterol was mainly localised near or at the sample surface but that it also generated a strong matrix effect, affecting the ionisation of other lipids. Notably, it was shown that argon cluster sources are capable of producing 3D chemical images of biological samples with a markedly increased sensitivity.
7
Figure 4. Illustraation of case studies. A. Comparison of fluorescence and Raman imaging techniques to study the localisation of nanoparticles (40 nm diameter) in porated skin. Green: fluorescence, Red: CARS; Blue: SRS. Reprinted from reference 41,
with permission from Elsevier. B. Overlay of ToF-SIMS images of HeLa cells containing 24 slices obtained by depth profiling with a C60+ cluster ion beam. Red: CxHyOz-; Blue: bromodeoxyuridine. Image size: 202 x 202 m2. Reprinted with permission
from reference 64. Copyright 2013 American Chemical Society. C. 3D ToF-SIMS image of a 14 m thick rat brain slice obtained
by depth profiling with an Ar1500 +
cluster source. Analysed area: 150 x 150 m. Reprinted with permission from reference 69. Copyright 2013 American Chemical Society.
5. CONCLUSIONS
Surface and interface analysis has been an important aspect of pharmaceutical research for many years and provided significant insight into pharmaceutical problems. Several recent examples have been highlighted here to illustrate how state of the art analysis techniques can elucidate important aspects of pharmaceutical applications such as the surface properties of pharmaceutical formulations and their interfacial interactions during administration. The ongoing development of instrumental capabilities will continue to contribute to the advancement of our understanding of interfacial phenomena in drug formulation, administration and manufacturing.
The recent progress and prospects for a number of powerful surface analysis techniques discussed here illustrate that technological advancement is critically reliant on close collaborations between industry and academia. Translation of these novel or advanced technologies to industry is not straightforward but can be facilitated by collaborative centres that provide the necessary access to facilities and expertise. The combined development of technological and infrastructural capabilities in surface and interface analysis presents the pharmaceutical sector with the necessary prerequisites to tackle important challenges in drug discovery and development. Surface and interface analysis can be expected to continue to play a significant role in addressing the scientific pharmaceutical challenges that lie ahead and improve the R&D pipeline of pharmaceutical products.
REFERENCES