A method for simultaneous determination
of
210Pb and
212Pb in drinking water
samples
Guogang Jia∗, G. Torri and M. Leandro
National Institute of Environmental Protection and Research Via V. Brancati 48, 00144 Roma, Italy
Abstract
A sensitive and accurate method for determination of 210Pb and 212Pb in drinking water samples was developed. In the method Pb
was pre-concentrated as hydroxides, separated from alkaline earth el-ements as PbS precipitate, purified by an anion exchange resin chro-matography column, precipitated as PbSO4for source preparation and
counted by a low background β-counter. The procedure was checked with a reference material supplied by the IAEA, and the obtained data were in good agreement with the recommended values, showing the recommended procedure can provide reliable results. The mini-mum detectable activity of the method was 0.039 mBq L−1 for 210Pb
and 0.033 mBq L−1for212Pb if a 48 liter of water sample was analyzed.
Seventeen drinking water samples were analyzed with a Pb recovery of 88.8±5.5%, and the typical activity concentration was in the range of 0.191-15.1 mBq L−1 for210Pb and of 1.12-5.77 mBq L−1 for212Pb.
1.
Introduction
There is an elevated concern about the radiological characteristics and im-pact of drinking water. In fact, the naturally occurring radionuclides, such as those in the uranium series and the thorium series (238U,234U,226Ra,228Ra,
∗E-mail:[email protected]
222Rn, 210Pb, 210Po), exist ubiquitously in drinking water, and often
con-tribute significantly to internal dose to the population. Although gross α
and β activity measurements can serve as a screening tool for authority to control drinking water quality, for dose estimation it is necessary that the specific radionuclide in drinking water should be identified and their individual activity concentration measured, due to the fact that the dose coefficients are only related to the specific radionuclides.
Among the concerned radionuclides, lead isotopes are not only biologi-cally but also radiologibiologi-cally harmful. There are 4 radioactive lead isotopes in nature, i.e. β- and γ-emitting 210Pb (T1/2: 22.23 yr) and 214Pb (T1/2:
26.8 min) in the uranium series, β- and γ-emitting 212Pb (T1/2: 10.64 h) in
the thorium series, andβ- and γ-emitting 211Pb (T1/2: 36.1 min) in the ac-tinium series. Due to its chemical behaviors, lead is rather insoluble in natural water and is usually readily adsorbed onto solid particles, and the contents of lead isotopes in water are relatively low. Among the four lead iso-topes,214Pb and211Pb, possessing very short half-lives, low contents and/or poor abundance, are not measurable in the effective time of sample prepa-ration and sepaprepa-ration, but 210Pb and 212Pb are. Especially, 210Pb together with its granddaughter210Po (T1/2: 138.4 d) can be of great concern from the
standpoints of radiation protection due to their radiotoxicity, as they can accumulate in sources of food, for instance, in particular forms of marine life, reindeer and caribou, and contribute to about nearly half of the dose from total internal irradiation by ingested natural radionuclides [1–5]. Therefore, the routine monitoring of the210Pb concentration is very important.
For the purpose of studies on the accumulation and migration rate, cy-cling process in environmental media, bioavailability of the specific contam-inant, survey of contamination level in environment and impact assessment, the monitoring of210Pb in biological and environmental materials often
re-quires methods that should be sensitive, reliable and applicable to samples of considerable chemical complexity. There are five main kinds of method for the measurement of 210Pb: (1) direct counting of the low-energy (46.5 keV) γ-ray of210Pb usingγ-spectrometry equipped with Ge(Li) detector [6,7]; (2) separation of210Po, being an indirect decay product of210Pb, and counting of its α activity byα-spectrometry [8, 9]; (3) co-precipitation of 210Pb with
Ba as a sulphate, dissolving the sulphate in EDTA, mixing the obtained solution with the scintillation cocktail and measuring by liquid scintillation counting [10, 11]; (4) separation of 210Bi, the direct progeny of210Pb, and
counting of its β activity [12], and (5) separation of Pb and counting of the
It is concluded that the Pb separation method is one of the most practical, sensitive and less time-consuming methods.
In contrast with210Pb,212Pb, being a decay progeny of thoron (220Rn),
owing to its short half-life the methodology studies on 212Pb determination in water samples are scarce [17].
Based on the Pb separation procedures [14, 15], more experiments were made on herein, seeking for further developing and improving the 210Pb and 212Pb separation conditions in water sample. The quality control tests and real sample analyses showed that the developed method for 210Pb and 212Pb determination in big quantity of water samples is a very sensitive and
accurate technique, and can serve as a very useful tool for 210Pb and212Pb studies in the fields of health physics, geochronology and environmental science.
2.
Experimental
2.1 Apparatus and reagents
210Bi for210Pb determination and212Pb-212Bi for212Pb determination were
measured using a 10-channel low-level β-counter (Berthold LB770, Ger-many). The counting efficiency of the instrument for the 210Pb measure-ment was calibrated with a PbSO4 precipitate source obtained from a
stan-dard 210Pb solution and that for the 212Pb measurement was done with a PbSO4 precipitate source separated from a standard 232U solution that is
old enough and has reached radioactive equilibrium between 232U and its progeny 212Pb. The obtained counting efficiencies were 48.16% for 210Bi
and 88.36% for 212Pb-212Bi, respectively. The reagent background was of
≤0.0053 cps.
The 232U and 210Pb standard solutions for instrument calibration, the
reference material (IAEA-315) for quality control and the BIO-RAD-AG 1-X4 resin (100–200 mesh) for Pb separation were supplied by Amersham (UK), the IAEA and the Bio-Rad Laboratories (Canada), respectively. Pb(NO3)2 was used to prepare the carrier solution for Pb separation and all
other reagents were analytical grade.
2.2 Column preparation
were then loaded in an ion-exchange column with dimensions of 13 mm inter-nal diameter and of 250 mm length. Before use, the column was conditioned with 20 mL of 1.5 M HCl.
2.3 Preliminary tests
Preliminary tests for determination of 210Pb and 212Pb in water samples were primarily based on the procedure reported in the literatures [14, 18], in which Pb separation was conducted by coprecipitation with lead and/or iron hydroxide, absorption with a BIO-RAD-AG 1-X4 anion-exchange resin column, purification with Na2S to precipitate Pb as PbS in 6 M ammonium
acetate and source preparation as PbSO4.
2.3.1 Eliminating the interference of alkaline earth elements
Lead forms two series of compound, the stable plumbous salts in which it is bivalent and forms the Pb2+ in many ways resembling the Ba2+, and the less stable covalent plumbic compounds resembling the stannic compound, in witch it is quadrivalent. The plumbic compounds are either insoluble or hydrolyzed by water to lead dioxide PbO2. The fate and mobility of lead in
environmental water are governed by its chemical and biological behaviors. Due to formation of many precipitates, such as PbO, PbO2, PbS, PbCO3,
PbSO4, lead halides etc., the concentration of dissolved Pb in environmental
waters including drinking water is generally low and variable, depending on formation of soluble complexes. Therefore, for accurate determination of 210Pb and 212Pb in environmental water a big sampling volume up to 20–100 L is needed.
When the procedure mentioned above was used to treat such a big volume of water sample, in many cases a big quantity of precipitate was obtained in the process of Pb pre-concentration. It was found that the major part of the precipitate is formed by carbonates, due to the fact that (1) the environmental or mineral water samples often contain a certain amount of HCO−3 (30–1343 mg L−1), and (2) many transitional
(KspMnCO3 = 1.8×10⁻¹¹,KspFeCO3 = 3.5×10⁻¹¹,KspPbCO3 = 3.3×10⁻¹⁴, KspAg2CO3= 8.1×10⁻¹²,KspHgCO3 = 8.9×10⁻¹⁷) and alkaline earth metals
etc. (KspMgCO3= 1×10⁻⁵,KspCaCO3= 4.8×10⁻⁹,KspSrCO3 = 1.1×10⁻¹⁰, KspBaCO3 = 5.1×10⁻⁹) can precipitate with CO23− at the basic condition.
Although the carbonates can be destroyed by addition of HCl or HNO3
and deteriorate the effective separation from uranium, radium etc. in the next step.
In order to solve this problem, Jia and Torri [15] have tried to sepa-rate Pb as PbSO4 precipitate first and this way is working well for 0.5 g
of soil or sediment, but it seems not very effective when a big quantity of Ca present in the sample solution, as a big quantity of PbSO4 as well as
CaSO4 is obtained and the latter is not easily soluble in 10–20 mL of 6 M
NH4Ac. A big volume of 6 M NH4Ac (100–300 mL) could dissolve CaSO4
completely, but low Pb recovery was observed due to the increasing solubility of PbSO4.
The second test was to reverse the original analytical procedure of resin exchange separation and PbS purification,i.e.after Pb coprecipitation and dissolution, PbS precipitation was made first with addition of 20–30 g of NH4Ac and 8 mL of 0.5 M Na2S at pH 6–7. In this case, all the alkaline
earth elements remain in solution and are eliminated by centrifugation, and the obtained black PbS and FeS etc. are dissolved by HCl for further purifi-cation by resin exchange column. This modifipurifi-cation is very successful and with advantages of (1) high Pb recovery and short analytical time, (2) elim-inating the most of silicon gel before resin separation and preventing from column blocking, and (3) improving the decontamination effects from main
α- and/or β-emitters, such as uranium, thorium, radium and their other progenies.
2.3.2 The mechanism of the 210Pb and212Pb measurements
As mentioned above, due to their short half-lives and/or low abundance, un-supported214Pb and211Pb in water sample are not detectable after chemical separation. The unsupported 212Pb in water is difficult to be directly de-tected by γ-spectrometry due to its low activity concentration in most of the samples and there is few report concerning the determination of 212Pb in water samples by chemical separation methods. On the contrary, there are a number of reports about the determination of 210Pb in water sam-ples by physical and chemical methods [7, 14]. Pb-210 through its daughter
210Bi can be determined with ease by the most routinely used instrument –
low backgroundβ-counter. As reported in the reference [14], more accurate
210Pb concentration can be obtained when210Pb and210Bi have reached the
secular equilibrium about 30 days after the Pb source preparation.
0 2 4 6 8 10
0 20000 40000 60000
Time after Pb separation, min
212
Pb
-212
Bi
a
n
d
210
Bi
c
o
u
n
ti
n
g
r
a
te
, c
p
m
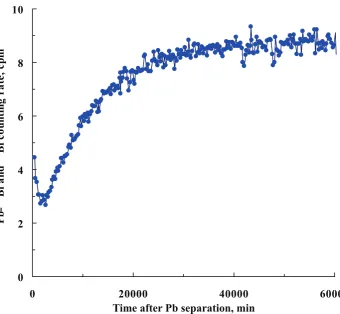
Figure 1: The212Pb-212Bi decay and210Bi ingrowth curve of a Pb source obtained
from a potable water sample collected in Italy.
and separation. Figure 1 is a typical one, which shows the β counting rate as a function of time after the Pb source preparation from a mineral water sample based on the recommended procedure. After careful treatment of the data, it is found that the figure can be very well resolved into two fractions. The first fraction, located in the counting time of 0–2 days, is dominated by the 212Pb-212Bi decay, as shown in fig. 2; while second fraction, located in the time after 2 day counting, is characterized by 210Bi ingrowth from
210Pb (fig. 3). Therefore, after deducting the count contribution of the
212
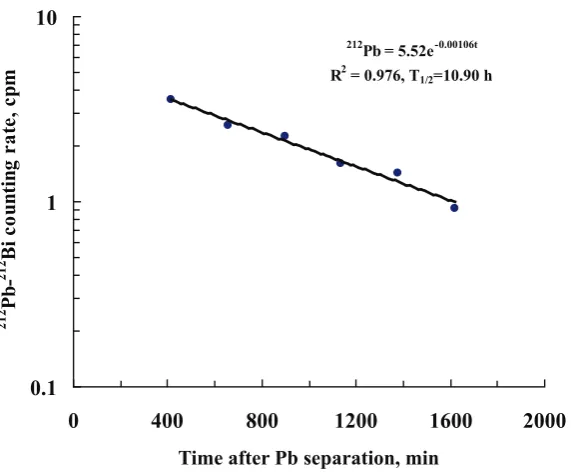
Pb = 5.52e-0.00106t R2 = 0.976, T1/2=10.90 h
0.1 1 10
0 400 800 1200 1600 2000
Time after Pb separation, min
212
Pb
-212
Bi
c
o
u
n
ti
n
g
r
a
te
, c
p
m
Figure 2: The 212Pb-212Bi decay curve of a Pb source obtained from a potable
water sample collected in Italy (same water as shown in fig. 1).
2.4 Recommended procedure
2.4.1 Pre-concentration of Pb from water samples
Thirty to fifty mL of concentrated HCl, 40 mg of Fe3+ (40 mg Fe3+ mL−1) carrier, 25 mg of Pb2+ (25 mg Pb2+ mL−1) carrier are added to 20-50 L of water sample. After 30 min stirring for isotopic exchange between carriers and analytes, the solution is adjusted to pH 9–10 with concentrated am-monia solution to precipitate iron and lead as hydroxides and carbonates, and mixed well. After the precipitate settled down, the supernatant is care-fully siphoned off and the precipitate slurry is centrifuged at 4000 rpm. The supernatant is discarded and the precipitate is dissolved with 30–40 mL of concentrated HCl. The solution is then transferred to a beaker and heated to boil for digestion with 2 mL of 30% H2O2.
2.4.2 Separation of Pb from alkaline earth elements as PbS
0 1 2 3 4 5 6 7 8 9 10
0 10000 20000 30000 40000 50000 60000
Time after Pb separation, min
210
Pb
o
r
210
Bi
c
o
u
n
ti
n
g
r
a
te
, c
p
m
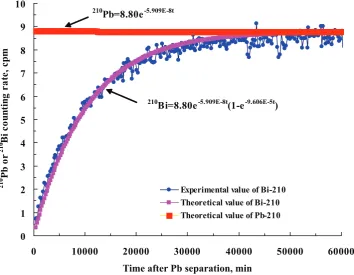
Experimental value of Bi-210 Theoretical value of Bi-210 Theoretical value of Pb-210
210
Pb=8.80e-5.909E-8t
210
Bi=8.80e-5.909E-8t(1-e-9.606E-5t)
Figure 3: The210Pb decay and210Bi ingrowth curves (after subtracting the212Pb
contribution) of a Pb source obtained from a potable water sample collected in Italy (same water as shown in fig. 1).
Eight mL of 0.5 M Na2S is added, and in this case PbS is precipitated while
most of Ca2+and Mg2+will remain in the solution. After centrifugation, the supernatant is discarded and the black precipitate is collected. Dissolving the precipitate with 4 mL of concentrated HCl and 26 mL of water, digestion is made by adding 2 mL of 30% H2O2, then the solution is filtered through
a Millipore filter paper (pore size: 0.1μm).
2.4.3 Purification of Pb with anion-exchange resin column
The obtained solution in an acidity of 1.5 M HCl is passed through a pre-conditioned anion-exchange resin column at room temperature and a free flow rate. After washing with 40 mL of 1.5 M HCl, Pb is eluted with 60 mL of distilled water at free flow rate, and the separation time of the pair
2.4.4 Source preparation, measurement and activity concentra-tion calculaconcentra-tion
Three mL of concentrated H2SO4 are added to the collected eluant, which
is then evaporated until fuming to destroy the organic matters by oxidation with 1 mL of 30% H2O2. Both the precipitate and the solution are
cen-trifuged. The supernatant is discarded and the precipitate is filtered on a weighed filter paper with a diameter of 24 mm (Whatman 42). The sample is dried at 110◦C until constant weight (about 1 h) and weighed again to calculate the Pb chemical yield.
Pb-212 is measured immediately after the chemical separation. 210Pb is determined by measuring the ingrowth activity of its progeny 210Bi (T1/2: 120 h) by a low background β-counter some time after the
separa-tion (about one month being suitable). The210Pb activity concentration in the water sample (CP b-210, Bq L−1) can be calculated according to eq. (1):
CP b-210=ABi-210/(1−e−λBi-210t)ηYν , (1)
where, ABi-210, the net count rate of 210Bi (cps); λBi, the 210Bi decay
con-stant (min−1); t, the 210Bi ingrowth time after 210Pb separation (min); η,
the detection efficiency for210Bi; Y, the chemical yield and;v, the sampling volume (L).
The 212Pb activity concentration in the water sample (C
P b-212, Bq L−1)
can be calculated by eq. (2):
CP b-212 =AP b-Bi-212/e−λP b-212tηYν , (2)
where, AP b-Bi-212, the net count rate subtracting the contribution of the
blank and 210Bi (cps); λP b-212, the 212Pb decay constant (min−1); t, the
time from212Pb separation to counting (min); η, the detection efficiency for
212Pb(212Bi).
2.5 Detection limits
Taking into account the 3σ of the blank count rates (0.364±0.016 cpm), the counting efficiencies of the instrument for 210Pb +210Bi (48.16%) and for 212Pb +212Bi (88.36%), the radiochemical yields (88.8±5.5%), the in-growth or decay factor (210Pb: 100%;212Pb: 63.8%) and the sampling quan-tity (48 L), the detection limit, or more precisely, the minimum detectable activity (MDA) of the method for water sample are 0.039 mBq L−1 for210Pb
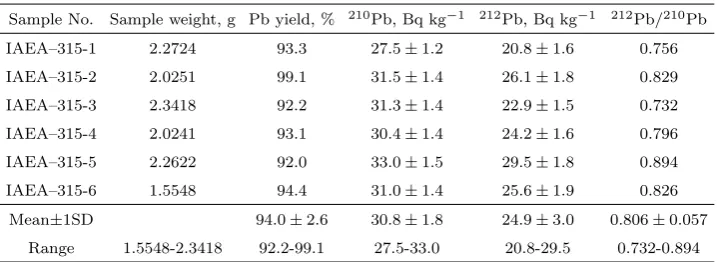
Table 1: The210Pb and 212Pb activity concentration (Bq kg−1), corrected to the
date of 1st Jan. 1993, in the IAEA-315 Marine Sediment∗.
Sample No. Sample weight, g Pb yield, % 210Pb, Bq kg−1 212Pb, Bq kg−1 212Pb/210Pb
IAEA–315-1 2.2724 93.3 27.5±1.2 20.8±1.6 0.756 IAEA–315-2 2.0251 99.1 31.5±1.4 26.1±1.8 0.829 IAEA–315-3 2.3418 92.2 31.3±1.4 22.9±1.5 0.732
IAEA–315-4 2.0241 93.1 30.4±1.4 24.2±1.6 0.796 IAEA–315-5 2.2622 92.0 33.0±1.5 29.5±1.8 0.894 IAEA–315-6 1.5548 94.4 31.0±1.4 25.6±1.9 0.826
Mean±1SD 94.0±2.6 30.8±1.8 24.9±3.0 0.806±0.057 Range 1.5548-2.3418 92.2-99.1 27.5-33.0 20.8-29.5 0.732-0.894
∗ The recommended value (95% confidence interval) of210Pb and228Th are 30.1 (26.0–33.7) and
27.0 (24.0–28.9) Bq kg−1, respectively.
3.
Results and discussion
The results were given in tables 1-2, and the reported uncertainty of the obtained activity concentration of radionuclides for individual analysis of a sample was 1 standard deviation (SD), which was estimated from the uncertainties associated with the instrument calibration, the addition of the carrier to the sample and the counting statistics of the sample and the blank etc.
3.1 Quality control
The step of Pb separation from alkaline earth elements as PbS precipitate in the method could also be used to simplify the procedure for210Pb deter-mination in soil if the reliable results could be confirmed. For the purpose of quality control, reference material IAEA-315 Marine Sediment supplied by the IAEA was analyzed to check the recommended procedure. The ref-erence material of about 2 g was leached based on the procedure given in the literature [15], and the obtained leachate was analyzed following the procedure for water samples. The precision was evaluated by the relative standard deviation obtained from a set of six analyses. The accuracy was assessed by the term of relative bias, which reflects the difference between the experimental mean and recommended value of the 210Pb activity
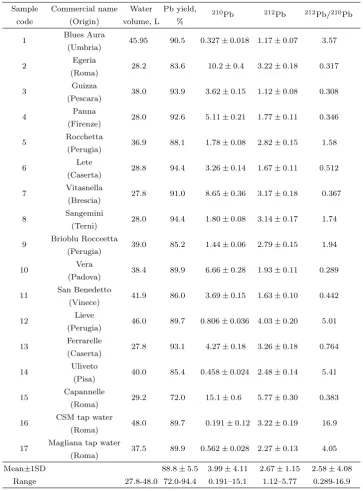
Table 2: The 210Pb and 212Pb activity concentration (in mBq L−1) in drinking
water samples collected in Italy.
Sample Commercial name Water Pb yield, 210
Pb 212Pb 212Pb/210Pb code (Origin) volume, L %
1 Blues Aura 45.95 90.5 0.327±0.018 1.17±0.07 3.57 (Umbria)
2 Egeria 28.2 83.6 10.2±0.4 3.22±0.18 0.317 (Roma)
3 Guizza 38.0 93.9 3.62±0.15 1.12±0.08 0.308 (Pescara)
4 Panna 28.0 92.6 5.11±0.21 1.77±0.11 0.346 (Firenze)
5 Rocchetta 36.9 88.1 1.78±0.08 2.82±0.15 1.58 (Perugia)
6 Lete 28.8 94.4 3.26±0.14 1.67±0.11 0.512 (Caserta)
7 Vitasnella 27.8 91.0 8.65±0.36 3.17±0.18 0.367 (Brescia)
8 Sangemini 28.0 94.4 1.80±0.08 3.14±0.17 1.74 (Terni)
9 Brioblu Rocceetta 39.0 85.2 1.44±0.06 2.79±0.15 1.94 (Perugia)
10 Vera 38.4 89.9 6.66±0.28 1.93±0.11 0.289 (Padova)
11 San Benedetto 41.9 86.0 3.69±0.15 1.63±0.10 0.442 (Vinece)
12 Lieve 46.0 89.7 0.806±0.036 4.03±0.20 5.01 (Perugia)
13 Ferrarelle 27.8 93.1 4.27±0.18 3.26±0.18 0.764 (Caserta)
14 Uliveto 40.0 85.4 0.458±0.024 2.48±0.14 5.41 (Pisa)
15 Capannelle 29.2 72.0 15.1±0.6 5.77±0.30 0.383 (Roma)
16 CSM tap water 48.0 89.7 0.191±0.12 3.22±0.19 16.9 (Roma)
17 Magliana tap water 37.5 89.9 0.562±0.028 2.27±0.13 4.05 (Roma)
The obtained210Pb and212Pb activity concentration in the IAEA-315 is shown in table 1. The mean210Pb concentration in the IAEA-315 was found to be 30.8±1.8 Bq kg−1 (decay correction to the date of 1st Jan. 1993). It
was observed that the relative standard deviation obtained from a set of six analyses of the IAEA-315 is ±5.9% for 210Pb. Since all being less than
±10% the precision for the analyses is well acceptable as far as such a low activity is concerned. The relative bias obtained from the analyses is +2.3% for210Pb, showing that the mean activity concentration of210Pb is in good agreement with the recommended value of 30.1 Bq kg−1(the 95% confidence
interval: 26.0–33.7 Bq kg−1).
The mean212Pb concentration in the IAEA-315 was found to be 24.9± 3.0 Bq kg−1. Although the IAEA did not issue any recommended value for
212Pb, the reliability of the 212Pb activity concentration may be judged
from the recommended value for 228Th that is in secular equilibrium with its predecessors 228Ra and232Th. In fact, the 212Pb activity in the IAEA-315 sample is nearly in equilibrium with 228Th, as (1) the half-lives of its decay products are short, and (2)220Rn escaped from the sealed container is negligible (≤2%). In this case, the obtained relative standard deviation and the relative bias of 212Pb are±12% and −7.8% respectively. The obtained deviation and bias for 212Pb are bigger than those for 210Pb, mainly due to multi-corrections for the instrument background, reagent background, as well as interference of the 210Bi ingrowth from 210Pb. But the data of
212Pb can still be considered as acceptable and in good agreement with the
recommended value [27.0 (24.0–28.9) Bq kg−1] for228Th.
3.2 Concentration of 210Pb and 212Pb in drinking water
For the purpose of application of the established method, seventeen brands of drinking water samples were collected and analyzed. As shown in table 2, the typical activity concentration in the analyzed drinking water samples is in the range of 0.191–15.1 mBq L−1 for210Pb and of 1.12–5.77 mBq L−1 for
212Pb. The calculated activity ratio for212Pb/210Pb is in the range of
210Pb/226Ra, and of212Pb/228Ra in the water samples, in spite of210Pb and 212Pb being the most important progenies of226Ra and228Ra, respectively.
The statistic correlation analyses between the concerned components have been made. It was shown that: (1) no correlations between210Pb and
226Ra and between 212Pb and 228Ra concentration in the drinking water
samples were observed, even if each pair of them belongs to the same de-cay series and with the same chemical valences of 2+; (2) the carbonate presenting in the water samples is one of the most important complexion agent, but no statistic correlations were observable for the pair of neither
210Pb/HCO−
3 nor212Pb/HCO−3, showing that the effect of HCO−3 or CO23−
on the 210Pb and 212Pb dissolution is poor [2] and the behaviors of lead isotopes seems different from radium in water containing HCO−3; and (3) a positive correlation between 210Po and 210Pb was found in the drinking water samples with a correlation equation of [210Po] = 0.721[210Pb] + 1.65 (R2 = 0.4254,n= 17,P <0.05).
References
[1] Ham G. J., Wilkins B. T., Ewers L. W.,Radiation Protection Dosime-try, 93 (2001) 151.
[2] Jia Guogang, Torri Giancarlo, Magro Leandro, J. Environ. Radioact., 100 (2009) 941.
[3] Pietrzak-Flis Z., Chrzanowski E., Dembinska S., Sci. Total Environ., 203 (1997) 157.
[4] Pietrzak-Flis Z., Suplinska M. M., Rosiak L., J. Radioanal. Nucl. Chem., 222 (1997) 189.
[5] Smith-Briggs J. L., Bradley E. J., Potter M. D., Sci. Total Environ., 54 (1986) 127.
[6] Bolivar J. P., Garcia-Tenorio R., Garcia-Leon M., Appl. Radiat. Isot., 47(9/10) (1996) 1069.
[7] Schery S. D.,Anal. Chem., 52 (1980) 1958.
[8] Holtzman R. B., J. Radioanal. Nucl. Chem., 115(1) (1987) 59.
[10] Brown S. A., J. Radioanal. Nucl. Chem., 264(2) (2005) 505.
[11] Schonhofer F., Wallner G., Radioactivity and Radiochemistry, 12(2) (2001) 33.
[12] Desideri D., Guerra F., Meli M. A., Testa C.,J. Radioanal. Nucl. Chem. (Letters), 200(5) (1995) 385.
[13] Jia Guogang, J. Radiochem. Nucl. Chem., 16 (1994) 1 (in Chinese).
[14] Jia Guogang, Belli M., Blasi M., Marchetti A., Rosamilia S., Sansone U.,J. Radioanal. Nucl. Chem., 247(3) (2001) 491.
[15] Jia Guogang, Torri Giancarlo, Appl. Radiat. Isot., 65(1) (2007) 1.
[16] Santos E. E., Lauria D. C., Amaral E. C. S., Rochedo E. R.,J. Environ. Radioact., 62 (2002) 75.
[17] Nuccetelli C., Risica S.,Appl. Radiat. Isot., 66 (2008) 1657.
[18] Jia Guogang, Belli M., Blasi M., Marchetti A., Rosamilia S., Sansone U.,Appl. Radiat. Isot., 53 (2000) 115.