BETWEEN DIFFERENT SKILL LEVELS
AND CLUBS IN GOLF
A Research Thesis Presented to
School of Human Movement, Recreation and Performance
Faculty of H u m a n Development
VICTORIA UNIVERSITY
VICTOR/A UNIVERSITY
LIBRARY
In fulfillment of the requirements for the degree
MASTERS OF APPLIED SCIENCE
HUMAN PERFORMANCE
By
DEAN BROWN
TABLE OF CONTENTS
C H A P T E R 1 I N T R O D U C T I O N 1
1.1 ABBREVIATIONS 4
CHAPTER 2 LITERATURE REVIEW 5
2.1 WHAT IS WEIGHT TRANSFER 5
2.2 CP AS A MEAUSRE OF WEIGHT TRANSFER 7
2.3 HANDICAP DIFFERENCES 8
2.3.1 Weight Transfer Patterns Between the Feet 9 2.3.2 Handicap Comparison Between the Studies 13
2.3.2.1 Low Handicap Golfers 13 2.3.2.2 High Handicap Golfers 16
2.4 GOLF CLUB DIFFERENCES 19
2.4.1 Weight Transfer Patterns Between the Feet 19
2.5 GOLF SWING EVENTS USED IN WEIGHT
TRANSFER STUDIES 23
CHAPTER 3 ATMS 25
3.1 GENERAL AIM 25
3.2 SPECIFIC AIMS 25
3.2.1 Hypotheses 26
CHAPTER 4 METHODS 28
4.1 SUBJECTS 28
4.2 TASK 28
4.2.1 Club Selection 28 4.2.2 Testing Procedure 29
4.3 EXPERIMENTAL SET-UP 31
4.6 STATISTICAL ANALYSIS 42
4.7 RELIABILITY OF THE CPyt % CALCULATED
A T T H E EIGHT GOLF SWING EVENTS 47
4.7.1 Aim 48 4.7.2 Method 48 4.7.3 Results 49 4.7.4 Conclusion 50
C H A P T E R 5 RESULTS 51
5.1 GOLF CLUB COMPARISON 51
5.1.1 All Golfers 51 5.1.2 Low Handicap Golfers 55
5.1.3 High Handicap Golfers 59
5.2 COMPARISON OF CPyt % BETWEEN LOW HANDICAP
GOLFERS A N D HIGH HANDICAP GOLFERS 63
5.2.1 Driver 63 5.2.2 3 iron 66 5.2.3 7 iron 68
5.3 INTERACTION EFFECT 72
73
73 74 76 80 82 85
CHAPTER 6
6.1
DISCUSSION
GOLF CLUB COMPARISON
6.1.1
6.1.2
6.1.3
6.1.4
6.1.5
TA, M B and L B
T B and B C
ED
MD
MF
6.2 HANDICAP COMPARISON 6.2.1 T A
6.2.2 M B 89 6.2.3 LB 91 6.2.4 TB 92 6.2.5 E D 93 6.2.6 M D a n d B C 94
6.2.7 M F 96
6.3 INTERACTION EFFECT 97
6.4 VARIABILITY WITHIN THE LOW HANDICAP
GOLFERS A N D HIGH HANDICAP GOLFERS 101
C H A P T E R 7 C L U S T E R ANALYSIS 104
7.1 AIM OF THE CLUSTER ANALYSIS 104
7.2 METHOD 104
7.3 THE CLUSTER GROUPS 105
7.4 THE FOUR WEIGHT TRANSFER STYLES 108
7.4.1 Main Points of interest between the four
weight transfer styles 110 7.4.2 Assessment of the four weight transfer styles 111
7.5 COMPARISON OF THE CPyt % BETWEEN
T H E L O W HANDICAP GOLFERS A N D HIGH HANDICAP
GOLFERS FOR T H E 'TYPICAL GOLFERS GROUP' 113
7.6 SUMMARY OF THE CLUSTER ANALYSIS 119
CHAPTER 8 PRACTICAL IMPLICATIONS 120
CHAPTER 9 CONCLUSION 123
REFERENCES 126
Table 2.3.2.2
Table 2.4.1.1
Table 4.4.1a Table 4.4.1b Table 4.5.2
Table 4.7 Table 4.7.3
Table 5.1. L I
Table 5.1.1.2
Table 5.1.2.1
Table 5.1.2.2
Table 5.1.3.1
Table 5.1.3.2
Table 5.2.1.1
Table 5.2.2.1
Table 5.2.3.1
front foot between low handicap golfers and an average
golfer for three studies 14 Comparison of weight transfer results between the
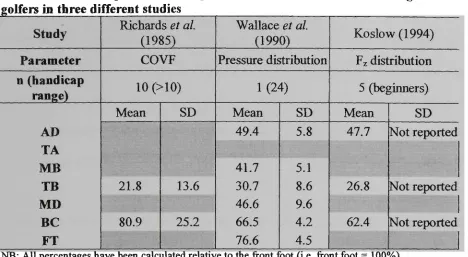
high handicap golfers in three different studies 17 Proper, Reverse and Abbreviated weight transfer styles
found for 30 beginner golfers for the driver and 8 iron
byKoslow(1994) 22 Forces sampled from the two A M T I force plates 36
M o m e n t s sampled from the two A M T I force plate 37 Events used for analysis along with abbreviations
and definitions 41 Potential factors that influence the error of each system 47
Comparison between test 1 and 2 showing the reliability data for the change in the m e a n and the total error of
measurement 50 M e a n CPyt % and SD for the driver, 3 iron and 7 iron
for All Golfers (n = 38) 53 Club comparison for All Golfers (n = 38) at the eight
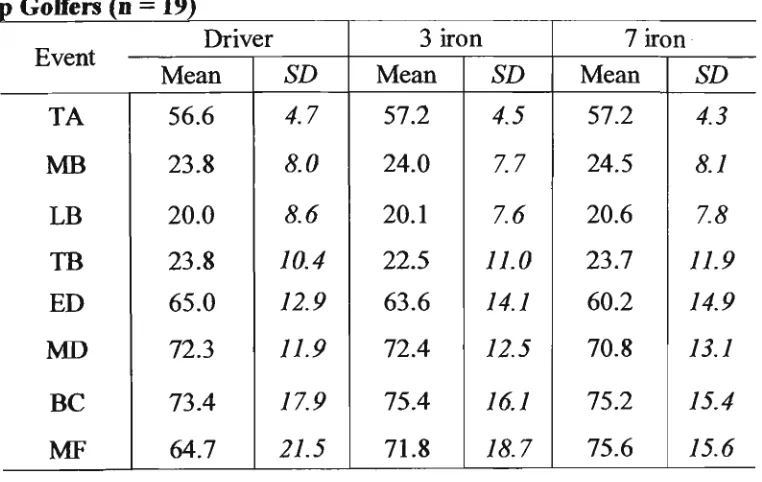
golf swing events 54 M e a n CPyt % and SD for the driver, 3 iron and 7 iron
for the L o w Handicap Golfers (n = 19) 57 Club comparison for the L o w Handicap Golfers
(n = 19) at the eight swing events 58 M e a n CPyt % and SD for the driver, 3 iron and 7 iron
for the High Handicap Golfers (n = 19) 61 Club comparison for the High Handicap Golfers
(n = 19) at the eight swing events 62 M e a n CPyt % for the L o w Handicap Golfers and High
Handicap Golfers for the driver at the eight golf
swing events 64 M e a n CPyt % for the L o w Handicap Golfers and High
Handicap Golfers for the 3 iron at the eight golf
swing events 66 M e a n CPyt % for the L o w Handicap Golfers High
Handicap Golfers for the 7 iron at the eight golf
Table 5.3
Table 6.1
Table 6.1.1.1
Table 6.1.1.2
TabIe6.L1.3
Table 6.1.2.1
Table 6.1.2.2
Table 6.1.3.1
Table 6.1.3.2
Table 6.1.3.3
Table 6.1.4.1
Table 6.1.4.2
Table 6.1.5.1
Table 6.1.5.2
Table 6.2
three clubs at the eight swing events and post-hoc test 71 Interaction effect between the L o w Handicap Golfers
High Handicap Golfers for the driver, 3 iron and 7 iron
at the eight swing events 72 Summary of the significant results for the golf
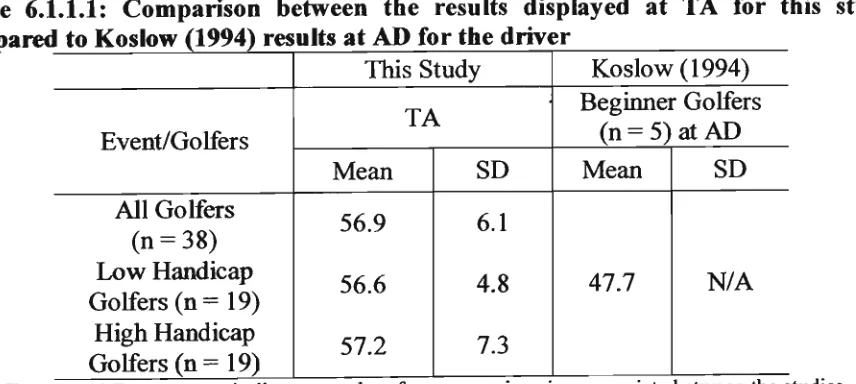
club comparison within each group 73 Comparison between the results displayed at T A
for this study compared to Koslow (1994) results
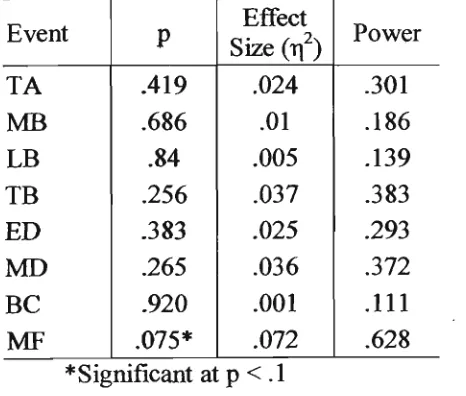
at A D for the driver 74 Effect size and power data for the L o w Handicap
Golfer, High Handicap Golfer and All Golfers at
TA, MB, LB 75
n required in each group to provide a power of .8 for the main effect between the three golf clubs at
T A , M B a n d L B f o r p = .l 76 Effect size (n2) and power data for all three groups at
T B a n d B C 79 n required for the L o w Handicap Golfers and
High Handicap Golfers to provide a power of .8
between the three golf clubs at T B and B C for p = 0.1 79 M e a n CPyt % and S D for all three groups at E D
for the driver, 3 iron and 7 iron and the significance levels 80 Comparison between All Golfers (n = 38) and
High Handicap Golfers (n = 19) effect size (d), p value and m e a n CPyt % data between the driver and
the 3 iron at E D 81 M e a n CPyt % movement and paired samples t-test
for all three groups from T B to E D for the driver, 3 iron
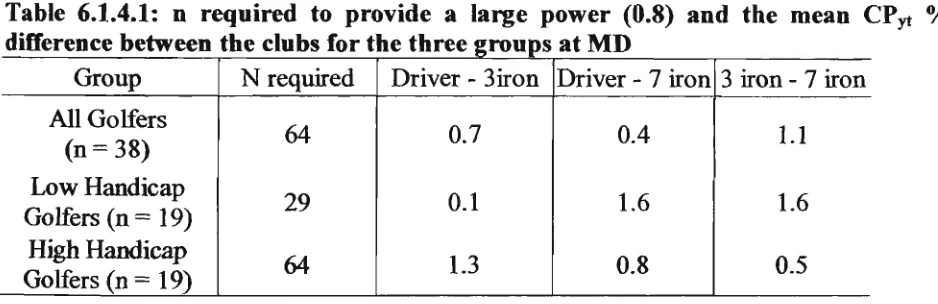
and 7 iron 82 n required to provide a large power (0.8) and the
mean CPyt % difference between the clubs for the
three groups at M D 83 M e a n CPyt % movement paired samples t-test for
all groups between E D to M D for the driver, 3 iron
and 7 iron 84 Comparison between the m e a n CPyt % from this
study and Fz distribution from Cooper et al. (1974)
at M F for the driver, 3 iron and 7 iron 86 M e a n CPyt % movement and paired samples t-test
for the three groups between B C and M F for the driver,
3 iron and 7 iron 87 M e a n CPyt % differences between the two handicap
groups for the driver, 3 iron and 7 iron at the 8 golf
Table 6.2.4
Table 6.2.5
Table 6.2.7
Table 6.4.1
Table 6.4.2
Table 7.3
Table 7.4
Table 7.4.2
Table 7.5.1
Table 7.5.2
Table 7.5.3
92 High Handicap Golfer for the three clubs and the
n required to produce a large power (0.8)
Comparison of the weight transfer values at T B between
this study, Richards et al. (1985) and Wallace et al. (1990) 93 M e a n CPyt %, S D , m e a n CPyt % difference and the
effect size for the L o w Handicap Golfers and High Handicap golfers for the three golf clubs at E D and
the n required for a large power (0.8) 94 Descriptive statistics, p value, effect size and power
for the L o w Handicap Golfers and High Handicap
golfers for the three golf clubs at M F 96 S D for the L o w Handicap Golfers and High Handicap
golfers for the three golf clubs at T B and B C compared
to Richards et al. High Handicap Golfers 101 The mean, S D and range for the L o w Handicap Golfers
(n = 19) and High Handicap Golfers (n = 19) for the
driver at the eight golf swing events 102 Assessment of the best cluster solution using the
coefficient jump and C Index and the validation of
the cluster group using the point biserial correlation 106 M e a n CPyt % and S D for the four-cluster groups for
the driver at the eight golf swing events 108 M e a n A G U , age and number of golfers in the
'Typical', 'Back Foot', 'Late Translation' and
'Irregular' golfer groups 112 Results of the independent samples t-test and comparison
between the 'typical' L o w Handicap Golfers and
'typical' High Handicap Golfers to the S P A N O V A for the p value, effect size and n required to produce a large
power (0.8) 116 Comparison of the M e a n CPyt % difference for
the handicap groups for the cluster analysis and S P A N O V A
a t E D , M D a n d B C 117 Comparison of the M e a n CPyt % difference for
the handicap groups for the cluster analysis and
LIST OF FIGURES
Figure 2.3.1 Richards et al. (1985) sample of the COVF trace
throughout the swing 10 Figure 4.2.2 Force plates and surrounding nylon netting
(NB, set-up here w a s for a right-handed golfer) 30 Figure 4.3.1 Force Plate set-up (Note, set-up is for a
right-handed golfer) 32 Figure 4.3.2.1 Camera set-up used in the testing session
(Note, set-up is for a right-handed golfer) 33 Figure 4.3.2.2 Field of view of the overhead camera 34 Figure 4.3.2.3 Experimental set-up showing major pieces of equipment 35
Figure 4.4.1 Forces and M o m e n t s measured by the A M T I force
plates (direction of arrows indicate positive axes) 36 Figure 4.5.1.1 Digitised position of the toe and heel for the front
and back foot and R P digitised position 39 Figure 4.5.12 CPyt expressed as a % between the mid-point of the
front foot and mid-point of the back foot 40 Figure 4.5.2 The eight golf swing events used for analysis 41 Figure 4.6.1 S P A N O V A design employed to analyse the dependent
variable (CPyt % ) 43 Figure 4.7 The three sources that contribute to the CPyt % error
at the eight golf swing events 47 Figure 5.1.1.1 M e a n CPyt % for the three golf clubs at the eight golf
swing events for All Golfers (n = 3 8) 52 Figure 5.1.2.1 M e a n CPyt % for the three golf clubs at the eight golf
swing events for the L o w Handicap Golfers (n = 19) 56 Figure 5.1.3.1 M e a n CPyt % for the three golf clubs at the eight golf
swing events for the High Handicap Golfers (n = 19) 60 Figure 5.2.1 M e a n CPyt % for the L o w Handicap Golfers (n = 19)
and High Handicap Golfers (n = 19) at the eight golf
swing events for the driver 65 Figure 5.2.2 M e a n CPyt % for the L o w Handicap Golfers (n = 19)
and High Handicap Golfers (n = 19) at the eight golf
swing events for the 3 iron 67 Figure 5.2.3 M e a n CPyt % for the L o w Handicap Golfers (n = 19)
and High Handicap Golfers (n = 19) at the eight golf
swing events for the 7 iron 69 Figure 6.2.6 M e a n CPyt % pattern between the L o w Handicap
Golfers and High Handicap golfers for the three golf
clubs at B C 95 Figure 6.3.1 Interaction effect between the L o w Handicap Golfers
and High Handicap Golfers for the driver, 3 iron and
Figure 7.5 M e a n CPyt % trace of the 'typical golfers group' L o w Handicap Golfers (n = 14) and High Handicap Golfers (n = 15) for the eight golf swing events for
I wish to express my gratitude for their help and support to the following people:
The Club Golfers who participated in this study
Victorian Institute of Sport Golfers
Kevin Ball
D r Russell Best
Steven D o w l a n
T i m Wrigley
Ian Fairweather
Robert Stokes
Thirty-eight male golfers were divided evenly into two handicap groups defined as: Low
Handicap Golfers (handicap = -2 to 10) and High Handicap Golfers (handicap = 11+).
Each golfer was required to bring their own driver, 3 iron and 7 iron to the testing
session Testing was conducted at Victoria University Biomechanics Laboratory,
Melbourne, Australia and the laboratory was set-up to emulate a golf driving range.
Thirty golf swings (10 with each club) were performed while the golfer stood on two
AMTI force plates, which measured the CP position at 500 Hz. A 200 Hz camera was
placed perpendicular to the line of shot and was used to obtain timing data for eight key
events of the golf swing. A 50 Hz overhead camera recorded the position of the feet on
the force plate. This footage was then digitised (Peak Motus) to plot the CP trace relative
to the feet, which was then expressed as a percentage of movement between the feet (CPyt
%).
Eight repeated measures ANOVA (SPANOVA, SPSS definition) were conducted to
investigate the within main effect (golf club comparison), between main effect (handicap
effect (p < .03) at four golf swing events for All Golfers (n = 38), two golf swing events
for the Low Handicap Golfers (n ~ 19) and one golf swing event for the High Handicap
Golfers (n = 19). The interaction effect between the handicap groups and clubs displayed
a significant effect (p < .1) for one golf swing event. The between main effect did not
reveal a significant difference between the Low Handicap Golfers and High Handicap
golfers mean CPyt % for the three golf clubs at the eight golf swing events. Further
handicap analysis was conducted with the driver and through cluster analysis it was
discovered that four distinct weight transfer patterns existed for the 38 golfers. A
handicap comparison was conducted within the weight transfer patterns, however no
significant differences were displayed between the Low Handicap Golfers or High
(Australian Bureau of Statistics, 1999). One of the results of this popularity is the vast amount of coaching and scientific literature that has emerged, examining all elements of the game of golf. Cochran and Stobbs (1968) performed the first extensive scientific research on the golf swing and labeled their study 'The Search for the Perfect Swing'. This research examined the fundamental skills of the golf swing and provided a model of technical, physical and mental approaches for the game of golf. The scientific research that has followed has continued to build on the theories and ideas defined by Cochran and Stobbs. One area, which Cochran and Stobbs briefly researched, was the interaction
between the feet and the ground during the golf swing.
Williams and Sih (1998) suggested that the interaction between the feet and the ground plays an important role by producing forces at the feet that provide a foundation for movement of the body to activate the golf swing. A number of scientific studies have investigated the interaction between the feet and ground by utilising force platforms to measure the ground reaction forces that were present during a golf swing (Williams and Cavanagh, 1983; Richards et al, 1985; Koenig et al, 1994). All of these studies have
The primary goal of the previous weight transfer literature has been to quantify the
weight transfer patterns that exist within the golf swing. More specifically, some studies have examined the weight transfer patterns of golfers with various handicaps (Richards et
al, 1985; Wallace et al, 1990; Barrentine et al, 1994; Koenig et al, 1994). The
assumption made in these studies was that the professional or low handicap golfers are more 'skilled' (produce superior weight transfer patterns) than the amateur or high handicap golfers. The objective of these studies was to determine if different weight transfer patterns exist between the skilled golfers (professional, low handicap) compared to the unskilled golfers (amateur, high handicap). Discrepancies were evident in the scientific literature, as some studies reported differences between the handicap groups (Barrentine et al, 1994; Wallace et al, 1994), while other studies have not reported any differences between the low and high handicap golfers (Richards et al, 1985; Koenig et
al., 1994).
In conjunction with the handicap comparison, some studies have investigated the weight transfer patterns performed by golfers with various golf clubs (i.e. driver, 3 iron etc). The aim of these studies was to compare the different weight transfer styles that were present for golfers when the golf club characteristics were changed (i.e. clubface loft, club shaft length etc). Like the handicap comparison, some studies have reported the
golfers performing different weight transfer patterns for various golf clubs (Cooper et al, 1974; Williams and Cavanagh, 1983; Koenig et al, 1994), while other studies have not
1.1 A B B R E V I A T I O N S General
CG
HSV
PGA
AGU
Centre of Gravity High Speed Video
Professional Golfers Association Australian Golfers Union
Force plate CP CPyt % G R F FP C O V F Fx
Fy Fz
Mx
My Mz
A M T I
Centre of Pressure
CP between the feet (front foot = 100%, back foot = 0%) Ground Reaction Forces
Force Plate
Centre of Vertical Force (as defined by Richards et al. 1985) Force in the anterior/posterior direction
Force in the medial/lateral direction Force in the vertical direction M o m e n t measured about Xaxis M o m e n t measured about Y axis M o m e n t measured about Z axis
Advanced Mechanical Technology Incorporated
Statistical S D
S P A N O V A P
r,2 d
Standard Deviation
Split Plot Analysis of Variance (SPSS version 10) Significance level
Eta squared (effect size) for S P A N O V A Effect size for t-tests
Golf Swing Events:
A D
TA
M B
LB
TB
ED
M D
BC
MF
Address
Take Away
Middle of Backswing Late Backswing Top of Backswing Early Downswing Middle of Downswing Ball Contact
Weight transfer is a golf coaching term that is used to describe the movement of weight
between the feet throughout the golf swing (eg. PGA teaching manual, 1990; Newell and
Fosfon, 1995; Norman, 1995). For these coaching texts a common weight transfer
sequence is described as (Norman 1995);
• Weight is evenly balanced between the feet at AD.
• During the backswing the weight is transferred towards the back foot and remains
here until the completion of the backswing.
• The downswing is initiated from the legs up and a rapid weight transfer from the
back foot to the front foot is produced during this phase.
• After BC the weight transfer ceases and the golfer tries to maintain a balanced
finish position.
The PGA teaching manual (1990) place large importance on weight transfer and regard it
as one of the most important fundamental skills in executing a golf swing. This manual
suggests that correct weight transfer must be mastered before more advanced swing
instruction can occur and acquiring correct weight transfer enhances the golf swing by,
1. Providing a platform for the rotation of the body and swinging of the arms.
3. Placing the body in a position to strike the ball with a clubface that is traveling in the right direction at the correct angle of approach.
Not all golf coaches agree with the PGA (1990) teaching principles of weight transfer. Cooke (1987) suggests that an overemphasis on weight transfer during the backswing can increase the likelihood of the golfer swaying too much during this phase. Cooke
advocates that weight transfer should not be taught separately from the swing, instead it
\
should become part of the backswing motion and relates to the arms and hands moving away from the body. Madonna (2001) agrees with this premise and added that the weight transfer must occur naturally and be facilitated by the swinging of the arms.
investigated on three occasions (Mason et al, 1991; 1995; Ball et al, 2001). Mason et
al. (1991) examined the relationship between CG movement and CP movement between
the feet during the golf swing for 14 single digit handicap golfers. It was anticipated that
these two parameters followed a similar trace between the feet during the golf swing. If
this was found to be true, then CP could be used instead of CG to provide more readily
obtained weight transfer analysis. The results showed that the medial/lateral movement
(between feet movement) of the CG and CP throughout the backswing and downswing
phase was similar until BC. At BC, the position of the CP was located on the medial
edge of the front foot and was closer to the target than the CG. The CG was further back
in the stance and was positioned in line with the ball at BC. After BC, the CG continued
to move towards the front foot, while the path of the CP was inconsistent from
golfer-to-golfer which resulted in no general pattern for this parameter. The primary conclusion of
Mason et al. was that CP was a good diagnostic parameter of weight transfer although the
CP and CG displayed some differences at BC. Mason et al. reasoning for this conclusion
was related to the calculation of CG and CP. The calculation of CG was time-consuming
due to the extensive experimental set-up and the digitising process involved in
determining the CG of the golfer and the club (26 reflective markers placed on joint
segments of the golfer and club). The calculation of CP however, was more readily
conducted another golf swing study using this parameter then CP will be considered an
accurate and reliable measure of weight transfer.
Another parameter used to assess the weight transfer patterns in golf was the Fz
distribution between the feet. This parameter has been used more extensively (Cooper et
al, 1974; Williams and Cavanagh, 1983, Richards et al, 1985; Koenig et al, 1994;
Koslow 1994) than CP or CG. In all of these studies a force plate was utilised to measure
the F2 distribution between the feet. The relationship between the Fz distribution and CP during the golf swing was investigated by Ball (2001, Appendix 2A) to determine how
similar these two parameters are. The Fz distribution and CP was calculated for 62 golfers at eight golf swing events (TA, MB, LB, TB, ED, MD, BC, MF). Ball found a
strong relationship (r = .999, p < .001) between these two parameters and displayed a
mean difference of less than 1% for the eight golf swing events. Ball concluded that the
Fz distribution and CP predominately measure the same thing and suggested a comparison of these two parameters was appropriate.
2.3 HANDICAP DIFFERENCES
Golfing handicaps were implemented by golfing bodies worldwide and were usually
compulsory when golfers compete in amateur competitions and tournaments. The aim of
the golfing handicap is to normalise golfers so they can compete on an even playing field.
The handicap is calculated by comparing the golfers average round to the par of the
course and is generally an indication of playing ability. Weight transfer studies have
professional/low handicappers were more skilled than the amateur/high handicappers.
The aim of these studies was to quantify the differences that exist between the groups and determine whether the difference were important for more skilled play. The problem
with classifying golfers according to handicap score is that it may not be related to technical ability. A variety of swing techniques exists for golfers of the same handicap score and golfers who possess an unorthodox style may still have the ability to shoot low scores and obtain a low handicap. It seems that the handicap classification of golfers is the only viable and fair method of comparing golfers of different skill levels.
2.3.1 Weight Transfer Patterns Between the Feet
Richards et al. (1985) investigated the Fz distribution between the feet for 10 low
handicap golfers (handicap <10) and 10 high handicap golfers (handicap >20). A force
plate containing three piezoelectric transducers located in all three corners measured the Fz placed on each foot. The amount of Fz loading on each transducer allowed Richards et
al. (1985) to calculate the center of vertical force (COVF) relative to the mid point of the
front foot and the mid point of the back foot. COVF was expressed as a percentage of Fz
M i d point back foot
M i d point front foot
Direction of! Shot
•
MAT —
BALL— &
•
X
0
P-= AD
= TB
= BC
Figure 2.3.1: Richards et ah (1985) sample of the C O V F trace throughout the swing
N . B ; T h e force plate is rectangular in this figure, but in the study it w a s triangular. Also, no data w a s reported for this figure.
Richards et al. (1985) showed that the low and high handicap golfers produced different
COVF percentages at TB and BC but were not significantly different (table 2.3.1.1). The
maximum COVF (farthest point forward the COVF travelled towards the front foot)
displayed by the low and high handicap golfers was significantly different (p < .05) and
Richards et al. indicated that the maximum COVF occurred after BC for every golfer.
This led Richards et al. to the conclusion that the follow through positions were different
between the two handicap groups, whereby the low handicap golfers exhibited a larger
maximum COVF than high handicap golfers. This statement however, appeared to be
speculation, considering Richards et al. did not examine the COVF during the follow
through phase or at a specific event during this phase. The small number of golf swing
events investigated by Richards et al severely limits this study. This study would have
provided more relevant results if more golf swing events were investigated in the same
Max*
105.4 5.6 98.1 9.1'Significant p < .05
Wallace et al. (1990) investigated the C P distribution between the feet of one low handicap golfer (handicap = 6) and one high handicap golfer (handicap = 24), while performing ten trials standing on two Musgrave pressure sensor footplates (each plate contained 2048 sensors). The footplates measured the pressure located under each foot during the golf swing, which was expressed as a percentage of movement between the
feet. This method of expressing the parameter (pressure on each foot) relative to the feet as a percentage was similar to the study of Richards et al. (1985), except Wallace et al. (1990) investigated the pressure percentage values at more events. The mean pressure
percentage of the ten trials for the low and high handicap golfer was calculated at six golf swing events (AD, MB, TB, MD, BC, FT). Wallace et al. found that the low and high
Table 2.3.1.2: Pressure percent on the front foot for Wallace et al (1990) at five golf swing events between the low and high handicap golfers
Events
AD*
MB*
TB
MD*
BC*
FT*
L o w (handicap=6) M e a n
63.2 52.6 27.3 69.2 82.2 89.8
SD
7.0 10.9
6.3 6.4 4.2 4.5
High (handicap=24) M e a n
49.4 41.7 30.7 46.6 66.5 76.6
SD
5.8 5.1 8.6 9.6 8.3 6.0
*Significant p < .05
Wallace et al. (1990) reported a meaningful weight transfer comparison between a low and high handicap golfer but inferences about the sample populations was difficult considering only one subject was examined within each handicap group. The results
from Wallace et al. will be treated with caution compared to other studies with a greater number of low and high handicap golfers (Williams and Cavanagh, 1983; Richards et al, 1985; Koenig et al, 1994). Nevertheless, the pressure distribution percentages presented by Wallace et al. provided a more thorough investigation of the between feet weight transfer patterns of a low and high handicap golfer because of the increased number of golf swing events utilized in the study.
The pressure distribution percentage of the low and high handicap golfer at follow through in Wallace et al. (1990) study supports Richards et al. (1985) hypothesis.
Richards et al. suggested that low handicap golfers produced a larger Fz distribution on
the front foot (105.4%) than the high handicap golfers (98.1%) during the follow through phase. Wallace et al. (1990) showed this was the case with the low handicap golfers
golfers with a range of handicaps. No descriptive data or statistics were reported between the handicap groups, however Koenig et al reported that the high handicap golfers
produced much less weight shift towards the back foot than the low handicap golfers during the backswing phase. The high handicap golfers in this study maintained an even balance between their feet during the backswing phase. These findings contradict the weight transfer patterns found by Wallace et al (1990) who reported a significant difference (p < .05) between the low and high handicap golfers at MB. At MB, the high handicap golfer exhibited a larger percentage of pressure on the back foot than the low handicap golfers. At TB only a small difference was reported between the low and high handicap golfers and they were not significantly different.
2.3.2 Handicap Comparison Between the Studies
2.3.2.1 Low Handicap Golfers
Three studies have reported the weight transfer values between the feet for low handicap golfers at specific events of the golf swing (table 2.3.2.1). Koenig et al. (1994) did not report any specific weight transfer values for the low handicap golfers, instead the average weight transfer pattern of the 14 golfers were reported. Both Richards et al (1985) and Koenig et al. (1994) examined the Fz distribution, while Wallace et al (1990)
pressure distributions for six events, while Koenig et al. (1994) reported three and
Richards et al (1985) two.
Table 2.3.2.1: C o m p a r i s o n of the percentage c b e t w e e n l o w h a n d i c a p golfers a n d a n average
S t u d y
P a r a m e t e r
n (handicap range)
AD
TA
M B
TB
M D
BC
FT
N B : All percentages
Richards et al (1985) COVF 10 (<10) Mean 27.5 95.6 have been
SD
8.8
12.1 calculated re•f weight placed o n the front foot golfer for three studies
Wallace et al. (1990) Pressure distribution 1(6) Mean 63.2 52.6 27.3 69.2 82.2 89.8
ative to the fr
SD
7
10.9 6.3 6.4 4.2 4.5 ont foot (i.«Koenig et al (1994) Fz distribution
1 4 ( 0 to 1 5 + ) A v e r a g e
Mean
55.0 20.0 35.0
;. front foot =
SD
N o t reported N o t reported N o t reported
100%)
Wallace et al. (1990) was the only study to report weight transfer data between the feet
for the low handicap golfer at AD. The pressure distribution displayed by this golfer
(63.2%) suggested that more weight is being placed on the front foot (table 2.3.2.1).
Between AD and MB this golfer exhibits a small transfer of pressure towards the back
foot and finishes with the weight evenly balanced between the feet at MB (52.6%). The
weight transfer pattern from TA to MB is similar to the average golfer in Koenig's et al.
(1994), except the average golfer has commenced the swing with less weight on the front
foot. After TA the average golfer (n = 14) exhibited a larger transfer of force towards the
back foot during these events and completed MB (20%) with the majority of weight
At TB Richards et al (1985) and Wallace et al. (1994) have reported almost identical
weight transfer values for the low handicap golfers (Richards et al. = 27.5%, Wallace et
al. = 27.3%), while the average golfer in Koenig et al (1994) study displayed a larger
percentage (35%) of weight on the front foot. The weight transfer patterns exhibited
from MB to TB for the low handicap golfer in Wallace et al (1990) and the average
golfer in Koenig et al. (1994) were notable different. For Koenig et al the average golfer
weight transfer pattern from MB to TB was depicted by a forward shift towards the front
foot resulting in a larger Fz distribution at TB than MB. The opposite weight transfer pattern occurs for the single high handicap golfer in Wallace et al (1990) who displayed
a backward weight transfer pattern that resulted in more weight on the back foot for TB
compared to MB. These different weight transfer patterns may explain why differences
were shown in the between feet percentage for these two studies at TB. Considering
Wallace et al had presented similar results to Richards et al (1985) it could be assumed
that this data was more accurate than Koenig et al (1994). Furthermore, the data
presented by Koenig et al at TB was for the average golfer and the high handicap golfers
and mid handicap golfers may have caused a larger percentage of weight to be placed on
the front foot compared to Richards et al. (1985) and Wallace et al (1990) low handicap
Wallace et al (1990) has been the only between feet weight transfer study to report data for the low handicap golfer during the downswing events. The data presented for the
single low handicap golfer demonstrated a large transfer of pressure from the back foot at TB to the front foot at MD. From MD to BC the single low handicap golfer continued to
transfer pressure towards the front foot but the range of pressure distribution during these events (13%) was smaller than that shown from TB to MD (46.4%). The pressure
distribution percentage shown at BC for the single low handicap golfer (82.5%) in Wallace et al was smaller than the mean COVF displayed by the ten low handicap golfers (95.6%) in Richards et al (1985, table 2.3.3.1). The low handicap golfer in Wallace et al (1990) may have been an extreme case, considering the pressure
distribution value was outside one standard deviation for the ten low handicap golfers in Richards et al. (1985).
2.3.2.2 High Handicap Golfers
Richards et al. (1985), Wallace et al. (1990) and Koslow (1994) reported between feet weight transfer data for high handicap golfers. The methods used by Richards et al (1985) and Wallace et al. (1990) were the same for the low handicap golfers, while Koslow (1994) examined the Fz distribution of five beginner golfers at three golf swing
AD
TA
M B
TB
M D
BC
FT
NB: All percentages h
M e a n
21.8 80.9 ave been calci
SD
13.6 25.2 iilated relativ
M e a n 49.4 41.7 30.7 46.6 66.5 76.6 e to the front \
SD
5.8
5.1 8.6 9.6 4.2 4.5
M e a n 47.7
26.8 62.4
SD
Not reported
Not reported Not reported
1
bot (i.e. front foot = 100%)
Wallace et al. (1990) s h o w e d that the high handicap ( 4 9 . 4 % ) golfers address the ball with the pressure placed almost evenly between the feet. Koslow (1994) supported this
finding, with the five high handicap golfers (47.7%) displaying a similar AD position to the single high handicap golfer in Wallace et al (1990). Comparison between the low
(table 2.3.2.1) and high handicap (table 2.3.2.2) golfers at AD and TA indicated that the high handicap golfers (Wallace et al, 1990; Koslow, 1994) address the ball and initiate the swing with more weight placed closer to the back foot than the low handicap golfer in Wallace et al (1990).
F r o m T A to M B the single high handicap golfer in Wallace et al. (1990) displayed a transfer of pressure towards the back foot, which was also demonstrated by the low
greatest for this golfer (30.7%) compared to the ten high handicap golfers (21.8%) in Richards et al. (1985) and Koslow (1994). The values presented at TB by the three studies were spread over a range of approximately 10%, which may be attributed to the different subject numbers tested in each study. Both Richards et al. (1985) and Koslow (1994) sampled more than one high handicap golfer and reported mean TB positions that were more closely related than the results reported by the single high handicap golfer in Wallace etal (1990).
Comparison between Richards et al. (1985) and Wallace et al. (1990) results at TB for the low and high handicap showed two different outcomes. The high handicap golfers (21.8%) in Richards et al (1985) exhibited more weight on the back foot than the low handicap golfers (27.5%), while Wallace et al. (1990) reported more weight on the back foot for the low handicap golfer (22.8%) than the high handicap golfer (30.7%) at the same event. Both of these studies showed no significant difference between the handicap groups at TB. No other weight transfer studies have displayed between the feet data at TB for low and high handicap golfers. Further analysis is required to determine which handicap group transfers more weight towards the back foot during the backswing phase and at TB.
From TB to MD Wallace et al. (1990) showed that the high handicap golfer transferred
2.4 GOLF CLUB DIFFERENCES
The emphasis of the weight transfer literature has focussed primary on handicap related differences and has often neglected the weight transfer patterns that may exist between various golf clubs. Studies that have only used one club for analysis have either opted for the driver (Wallace et al, 1990; Wallace et al, 1994; Mason et al, 1991; Mason et al,
1995) or 5 iron (Carlsoo, 1967; Richards et al, 1985). Only a handful of weight transfer studies have used various golf clubs as a part of their experimental design. Barrentine et
al. (1994) and Koslow (1994) made use of two clubs (driver, 5 iron for Barrentine et al,
driver, 8 iron for Koslow), while Cooper et al. (1974), Williams and Cavanagh (1983) and Koenig et al. (1994) used three clubs (driver, 3 iron and 7 iron) to investigate the weight transfer patterns. All the studies that analysed more than one club have used the Fz to examine the different weight transfer patter.
2.4.1 Weight Transfer Patterns Between the Feet
Cooper et al. (1974) compared the Fz distribution patterns between the feet for five low
handicap university students for the driver, 3 iron and 7 iron. Cooper et al. found that the maximum forward shift of Fz onto the front foot occurred at different times in the swing
for the driver, 3 iron and 7 iron. The driver displayed a maximum Fz on the front foot
after BC. Williams and Cavanagh (1983) reported a similar result for the driver as
Cooper et al. (1974), however the 7 iron exhibited a peak Fz on the front foot prior to BC.
Adding more inconsistency to the literature was Barrentine et al (1994) who found that the driver and 5 iron displayed a peak F2 on the front foot after BC (driver .010s, 5 iron
.028s). The data presented by Barrentine et al. would be considered more generalized to the wider golfing community due to the large number of golfers tested (n = 60).
Furthermore, Barrentine et al. was the only study that provided descriptive data to support the claim, while Williams and Cavanagh (1983) and Cooper et al (1974) only provided a qualitative assessment.
The Fz distribution between the feet for the five low handicap university golfers (Cooper
et al. 1974) showed that the transfer of weight after BC for the 7 iron continued towards
the front foot. The driver displayed a decrease in the Fz distribution for the five low
handicap golfers, which resulted in less weight on the front foot. Just after BC the Fz
distribution for the 7 iron (75%) was larger than the driver (50%) Fz distribution at the
same instance. Visual examination of the graph shows the Fz distribution percentage for
the driver is actually larger than 50%. Cooper et al. appears to have understated the Fz
distribution percentage for this club. The instance to which Cooper et al. referred to, on the graph, the five low handicap golfers display a Fz distribution percentage of
iron and the 7 iron maintained a similar Fz distribution during this phase. This resulted in
a small Fz distribution difference between the three golf clubs at the end of follow
through, with the 7 iron (80%) exhibiting the greatest amount of weight on the front foot and the driver (70%) producing the smallest. The 3 iron (approx 75%) fell in between the driver and the 7 iron.
Williams and Cavanagh (1983) suggested that the low, middle and high handicap golfers produced larger peak forces for the driver throughout the whole swing, while the 7 iron produced the least. Koenig et al (1994) found a similar result and suggested that the
different peak forces exhibited by the driver, 3 iron and 7 iron were the product of inertial effects. Both of these studies did not expand on this explanation and provided very little data or discussion on the comparison of weight transfer patterns exhibited by the golfers for the various golf clubs. It is clear from these two studies that further research is warranted with a larger sample population.
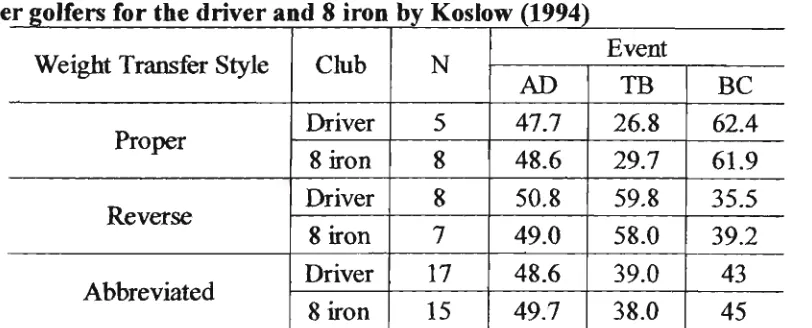
for each golf club. T h e m e a n weight transfer pattern of each golfer was analysed at three events. Koslow found that the weight transfer patterns between the driver and 8 iron were not significantly different for the beginner golfers. In addition to the club comparison, Koslow also found that three weight transfer styles were evident for the
beginner golfers. Five of the 30 golfers for the driver and eight of the 30 golfers for the 8 iron displayed a 'proper weight shift'. Koslow defined a 'proper weight shift' as equally balanced weight at AD, more than 50% of weight set on the back foot at TB and more
than 50% of weight on the front foot at BC. Koslow also reported an 'abbreviated weight shift' (proper weight shift at AD and TB, while BC < 50% on front foot) and 'reverse weight shift' (TB = > 50% on front foot, BC = > 50% on back foot) for the remaining
golfers that were not classified into the 'proper weight shift' (table 2.4.1.1). The majority of the 30 beginner golfers were classified into the 'abbreviated' weight transfer group, which represented golfers whom do not achieve a 'proper weight transfer' early in the learning process. If this classification system was applied to the data shown by Richards
et al. (1985), Wallace et al (1990) and Koenig et al (1994) for the low and average
(table 2.3.2.1) and high handicap golfers (table 2.3.2.2) then they would have all been considered 'proper' weight transfer styles.
Table 2.4.1.1: Proper, Reverse and Abbreviated weight transfer styles found for 30 beginner golfers for the driver and 8 iron by Koslow (1994)
Weight Transfer Style
Proper
Reverse
Abbreviated
Club
Driver 8 iron Driver
8 iron Driver
8 iron
N
5 8 8 7 17 15
Event
AD
47.7 48.6 50.8 49.0 48.6 49.7
T B 26.8 29.7 59.8 58.0 39.0 38.0
BC
62.4 61.9 35.5 39.2 43 45
present in Koslow's study. Firstly, only three golf swing events (AD, TB, BC) were used
to identify the weight transfer styles. The large time delay between these events does not
give any information of the movement patterns. Secondly, the procedure used to
determine the three styles was subjective and lacked scientific merit. The 'proper' weight
transfer style was constructed from previous weight transfer studies (Cooper et al, 1974;
Williams and Cavanagh, 1983; Richards et al, 1985). The 'reverse' weight transfer style
was created through anecdotal coaching literature (Frank, 1994; McGetrick, 1994) and
assessment of the Fz distribution at TB and BC. The 'abbreviated' weight transfer style was produced because the majority of the beginner golfers Fz distribution did not fit the mould of the 'proper' or 'reverse' style. This qualitative method of classifying golfers
into the three weight transfer groups seems simple. A more appropriate method of
classifying the golfers into weight transfer groups may have been cluster analysis.
2.5 GOLF SWING EVENTS USED IN WEIGHT TRANSFER STUDIES
A six-year study conducted by Cochran and Stobbs (1968) was one of the first scientific
studies to examine the underling principles governing the game of golf. This vast amount
of research incorporated all aspects of the game of golf and they labelled the study 'The
Search for the Perfect Swing'. The golf swing was broken down into specific segments
biomechanical research of the golf swing involving kinematic and kinetic research. In these studies the golf swing was broken into specific phases and events in an attempt understand the technique that were required to perform the skill. Weight transfer studies examining the between feet movement have examined the parameters at two (Richards et
al, 1985), three (Koslow 1994; Koenig et al, 1994), six (Wallace et al, 1990) and eight
(Williams and Cavanagh, 1983) events, while others have investigated the weight transfer patterns for phases of the swing (Cooper et al, 1974; Mason et al, 1991; 1995). The
problem associated with examining the weight transfer data in phases, is that valuable data can be missed, due to large time delays. For example from MB to TB and TB to
MD, the golfer moves the body through a large range of motion. To date, specific events within these phases have not been investigated. Examining the weight transfer data at more events would provide a more thorough analysis of what occurs at specific events in the golf swing (i.e. TB, MD etc), rather than the phase of the golf swing (TB to MD).
The method used to assess the events and phases of the swing have often been variable between the weight transfer studies. Cameras have been the primary source of obtaining temporal information of the golf swing and 200Hz cameras have been used previously by several studies (Cooper et al, 1974; Williams and Cavanagh, 1983; Barrentine et al, 1994). Those studies that have used video footage with smaller sample rates (Carlsoo, 1974; Wallace et al, 1990; Kawashima et al, 1994) would not have determined the
3.1 GENERAL AIM
The objective of this investigation is to analyse the weight transfer patterns of golfers
incorporating the effect of two handicap groups (Low Handicap Golfers and High
Handicap Golfers) while using three different golf clubs (driver, 3 iron and 7 iron).
Kinetic data will be examined at specific events of the golf swing for both handicap
groups and club types to determine the effect on each other.
3.2 SPECIFIC AIMS
1) To compare the mean CPyt % between the driver, 3 iron and 7 iron at the eight
golf swing events for All Golfers (both Low Handicap Golfers and High
Handicap Golfers).
2) To compare the mean CPyt % between the driver, 3 iron and 7 iron at the eight
golf swing events for the Low Handicap Golfers.
3) To compare the mean CPyt % between the driver, 3 iron and 7 iron at the eight
golf swing events for the High Handicap Golfers.
4) To compare the Low Handicap Golfers and High Handicap Golfers mean CPyt %
5) T o compare the L o w Handicap Golfers and High Handicap Golfers m e a n CPyt % for the 3 iron at the eight golf swing events.
6) To compare the Low Handicap Golfers and High Handicap Golfers mean CPyt % for the 7 iron at the eight golf swing events.
7) To determine the interaction effect between the two handicap groups and three golf clubs at the eight golf swing events.
3.2.1 Hypotheses
Aim 1: Null Hypothesis
No significant difference in the mean CPyt % between the driver, 3 iron and 7 iron at the eight golf swing events for All Golfers (both handicap groups).
Aim 2: Null Hypothesis
No significant difference in the mean CPyt % between the driver, 3 iron and 7 iron at the eight golf swing events for the Low Handicap Golfers.
Aim 3: Null Hypothesis
Aim 5: Null Hypothesis
No significant difference between the Low Handicap Golfers and High Handicap Golfers mean CPyt % for the 3 iron at the eight golf swing events.
Aim 6: Null Hypothesis
No significant difference between the Low Handicap Golfers and High Handicap Golfers mean CPyt % for the 7 iron at the eight golf swing events.
Aim 7: Null Hypothesis
CHAPTER 4
METHODS
4.1 SUBJECTS
Thirty-eight male golfers of varying ability participated in this study. All golfers were required to have a current Australian Golfers Union (AGU) handicap, which were
used to classify them into either a Low Handicap group or a High Handicap group. The Low Handicap Golfers (-2 to 10 AGU handicap) consisted of 19 golfers (mean age = 29, SD = 13) and the High Handicap Golfers (11+ AGU handicap) consisted of 19 golfers (mean age = 42, SD = 14).
The male golfers were canvassed from Victorian golf clubs. Two of the Low
Handicap Golfers were framing professionals and one other was considered the best amateur golfer in the state, at the time of testing. Of the 38 golfers, 3 were left-handed and the remaining 35 golfers were right left-handed. The laboratory was set-up to allow for both left-handed and right-handed golfers.
4.2 TASK
4.2.1 Club Selection
the laboratory and the testing procedures were explained to them. Before the
commencement of the testing session, the golfers were required to complete a consent form (Appendix 1). The testing session commenced once the golfers had adequately warmed up and were familiar with the hitting environment.
The researcher requested that each golfer bring their own golf clubs to the testing session (Driver, 3 iron and 7 iron). Additionally, golfers were asked to bring along and wear their normal golfing attire (golf shoes, glove, etc) for the testing session.
All golfers were required to perform ten golf swings with each golf club, hence a total of 30 golf swings required for the testing session. To eliminate club order effect a randomised club selection was performed for each golfer (e.g. ten shots with the 7 iron, followed by ten shots with the driver, then ten shots with the 3 iron, this sequence varied for each golfer). Ten trials were performed for each club to obtain an average weight transfer pattern of the golfer for the three golf clubs. The method of obtaining an average swing has been used extensively in the weight transfer literature (Williams and Cavanagh, 1983, 4 trials per condition; Richards et al, 1985, 4 trials per condition; Wallace et al, 1990, 10 trials; Koenig et al, 1994, 7 trials; Barrentine
et al, 1994, 3 trials per condition). However, the number of trials required to obtain
required to obtain an average CP profile for a beginner golfer. This study lead to the conclusion that ten trials would be performed to attain the average CP profile of each golfer in this study.
For every golf swing trial, the golfers were required to stand on two force plates. The two force plates were independent of the building and were placed in the ground so the surface level of the force plates was the same level as the floor. The two force plates were separate systems placed about 15cm apart, which enabled the golfer to
place one foot on each plate. Artificial grass (similar to that used at driving ranges) was placed on the force plate surface. This allowed subjects to wear their golf shoes to simulate a typical driving range setting. Ceiling to floor nylon nets were hung about three metres away from the hitting area, which wrapped around both sides to stop the ball and ensure safety (figure 4.2.2).
/
Intended Shot Direction
I Hitting • Surface
=AC_C
\ Force Plates (+ Artificial Grass)
Figure 4.2.2: Force plates and surrounding nylon netting (NB, set-up here was for a
right-handed golfer)
For each golf swing trial the ball w a s placed o n a rubberised tee o n a P r o V swing
characteristics, but this data was not used in conjunction with weight transfer data.
Each golfer performed the 30 golf swing trials at their own pace and were requested to hit the ball as they normally would. The golfers were not given any feedback until the completion of the testing session. During the feedback session a short
biomechanical assessment of the golfers swing took place. Analysis of video footage and ProV swing data was discussed in this session and each golfer was made aware that weight transfer data would be available to them at the completion of the study.
4.3 EXPERIMENTAL SET-UP
43.1 Force Plate
Two AMTI force plates OR6-5 (508mm x 464mm, FP 1) and LG6-4 (1200mm x
A microphone located near the hitting area controlled force plate data sampling (figure 4.3.1). The sound of ball contact was detected by the microphone and
activated force plate data sampling 2s prior to, and Is after ball contact (total of 3s).
Figure 4.3.1: Force Plate set-up (NB, set-up is for a right-handed golfer)
4.3.2 C a m e r a Set-Up
Intended Shot Direction
Nylon Netting
Force Plates (+ Artificial G r a s s )
(_ "j C^i^V^^I
Overhead VCR
Figure 43.2.1: C a m e r a set-up used in the testing session (Note, set-up is for a
right-handed golfer)
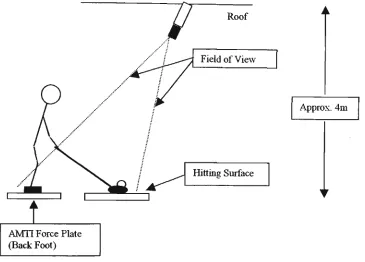
The overhead camera (50Hz) was mounted in the roof of the laboratory approximately 4m above the ground. The overhead camera was positioned perpendicular to the
intended shot direction and parallel with the AMTI force plate y direction (figure 4.3.2.2). The purpose of the overhead camera was to determine the position of the feet on the force plates. This footage was recorded on a VCR (Overhead VCR) and
was later used to digitise the heel and toe position of both feet (see section 4.5.1). The overhead camera was offset so the position of the feet could be seen past the upper
depending on their position on the screen. The offset problem was overcome with the use of a perspective correction calculation performed by Ball (2001, Appendix 2B).
Roof
Field of View
Approx. 4m
Surface
A M T I Force Plate (Back Foot)
Figure 4.3.2.2: Field of view of the overhead camera
The HSV camera was placed perpendicular to the line of shot and the image of this footage was displayed on TVL The purpose of this footage was to obtain temporal
information for specific events of the swing (see section 4.5.2). Previous studies have made use of HSV (Cooper et al, 1974; Williams and Cavanagh, 1983; Barrentine et
al, 1994) due to the explosive nature of the golf swing and Cooper et al. (1974)
suggests that 1000Hz cameras are more appropriate but this type of equipment was not available for this study. A pilot study was conducted to compare the precision of a 50Hz camera and the 200Hz camera. Quantitative assessment of the 50Hz and the
200Hz video footage suggested that the high-speed footage was far more precise in gaining temporal data for the events of the golf swing. The complete laboratory set-up is displayed in figure 4.3.2.3 showing the major pieces of equipment utilised.
Overhead Camera (50Hz)
H
Carrier!
\
j (200 Hz)
\ ' • i
Microphorv
/i
1
Golf Tec. ProV
AM" Force Plates
4.4 P A R A M E T E R S
4.4.1 CP Displacement
Force and moment data sampled from the two AMTI force plates were used to
calculate CP displacement. The AMTI force plates measures three force components along the X, Y and Z axes and three moment components about the X, Y and Z axes (figure 4.4.1, table 4.4.1a and 4.4.1b). A total of twelve force and moment channels were sampled (six for each force plate). However, not all force plate channels were required to calculate CP displacement but the definition of all forces and moments are required to understand h o w C P is calculated.
Figure 4.4.1: Forces and M o m e n t s measured b y the A M T I force plates (direction of arrows indicate positive axes)
Table 4.4.1a: Forces sampled from the two A M T I force plates
Force Plate
1
1
1
2
2
2
Force direction Anterior/Posterior
Medial/Lateral Vertical Anterior/Posterior
Medial/Lateral Vertical
Abbreviation
Fxj
Fyl
F
2i
Fx2
Fy2
F*2
M o v e m e n t relative to target Perpendicular
Parallel Perpendicular Perpendicular
C P displacement w a s measured in the medial/lateral direction, which is a C P
movement parallel to the line of shot. CP movement in this plane is referred to as CPy. CPy was calculated for both individual force plates using the following
equations, specified by AMTI. FP1
CPyi =
F P 2 CPy2 =
-(Mi-{ZolxFyi))~
FA
-(Mz-(Zo2xFy2)y
Fz2
Where,
Z0] = 0.067
Zo2 = 0.085
Zoi and Z02 were k n o w n value specified by A M T I . These values are vertical distances
from the transducers of the force plate to the contact surface of the force plate. The
Z0i and Zo2 values were a combination of force plate and the artificial grass and are
defined above for each force plate.
CPy l and C Py 2 were calculated relative to the centre of each individual force plate
(global reference). Both CPyi and CPy2 were then transformed to be calculated
relative to the front corner of force plate 1 (reference point, RP depicted in figure 4.4.1 via a black dot and RP 0,0). Once transformed, CPyi and CPy2 were then used to
(FzlxCPyl) + (F2XCPy2)
FA + Fz2
CPyi,2 and CPyt were expressed in (m), but CPyt was later converted to a percentage of CP movement relative to the feet (see section 4.5.1). CPyt percentages were
determined at eight events of the golf swing (see section 4.5.2)
4.4.2 Data Smoothing
The force plate data obtained from the 38 golfers was used in conjunction with two
other studies to examine different parameters of the GRF during the golf swing. The
other studies included differentiation to calculate CP velocity and hence smoothing of
the raw data was deemed necessary. The method used to smooth the force plate data
was the same for all three studies and this procedure was conducted by Ball (2001,
Appendix 2C) and below a summary of this process is presented.
After the force plate data was amplified it was passed through a 16.4 Hz pre filter.
This cut-off frequency was determined via spectral analyses of force, moment and CP
data. Ball (2001) suggested no signal above 16.4 Hz was associated with the golf
swing. This data was then used to calculate CPyi, CPy2 and CPyt. CP displacement values were then smoothed with a 15Hz Butterworth filter as detailed by Ball (2001),
this was detennined by using four methods.
1. Automatic methods for deterrnining optimal smoothing frequency.
2. Spectral analysis
3. The effect of different smoothing cut-off frequencies on parameters of interest.
expressed relative to the feet. The camera was placed in a generic position and the view catered for all golfers' stance and set-up positions. The overhead footage was digitised on PEAK Motus, motion analysis software.
Using P E A K Motus the toe and heel position of the left and right foot at A D , along
with the corner of FP 1 (RP figure 4.4.1) were digitised to determine the x coordinates for these points (figure 4.5.1.1). The average distance between the toe and the heel was calculated to determine the mid-point of the foot at AD. The mid-point of the foot remained a fixed position throughout the whole swing and the CPyt movement
was made relative to this position. The corner of FP 1 (RP) was digitised to provide a reference of alignment between the force plate data and the foot data.
O/H Camera
v direction (intended shot direction)
(0)RP
CPyt displacement was expressed as a percentage (CPyt %) between the average
distance of the left toe to heel (defined as mid foot), to the average distance of the right toe to heel (defined as mid foot). The movement of CP occurred between the
front and back feet (parallel to the line of shot). When CP was placed completely on the front foot then CPyt % equalled 100%. Conversely if CP was placed completely on the back foot then CPyt % equalled 0%. Figure 4.5.1.2 illustrates how CPyt % may be displaced between the feet at MD.
Intended Direction of shot
Toe
Mid
Foot 75<M>
7)
CPyt W
Toe
Mid Foot
Heel Front Foot
100% I
cr
75W
J L
-50% 25%
Heel Back Foot
0 %
_ l
Example of CPyt % at M D . C P was displaced 7 5 % from the back foot. Figure 4.5.1.2: CPyt expressed as a % between the mid-point of the front foot and mid-point of the back foot
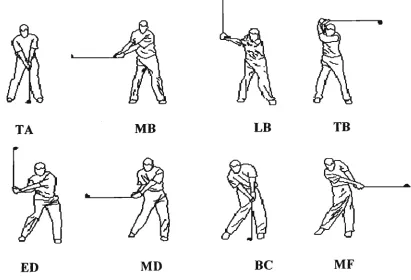
4.5.2 Golf Swing Events
Take A w a y
Mid-Backs wing
Late Backswing
Top of Backswing
Early Downswing
Mid-Downswing
Ball Contact
Mid-Follow Through
M B
LB
TB
ED
M D
BC
MF
initiate the swing.
The club shaft is parallel with the horizontal plane in the backswing phase.
The club shaft is perpendicular to the horizontal plane in the vertical Y, Z plane during the backswing phase.
The clubhead reaches its furthest point in the backswing, prior to the commencement of the downswing.
The club shaft is perpendicular to the horizontal plane in the vertical Y, Z plane during the downswing phase
The club shaft is parallel to the horizontal plane in the downswing phase.
Contact is m a d e between the club head and the ball.
The club shaft is parallel to the horizontal plane during the follow-through phase.
*This event w a s not used for analysis of C P displacement. It w a s only used to define the address position of the heels and toe so the C Py t % could be calculated relative to this position.
TA M B LB TB
ED M D BC M F
4.6 STATISTICAL ANALYSIS
M e a n CPyt % and standard deviation (SD) were calculated for the eight golf swing events for the driver, 3 iron and 7 iron. The m e a n CPyt % for each golfer was combined with the golfers in the same handicap group. From this data a mean CPyt % value and S D was deteiniined for the L o w Handicap Golfers and High Handicap Golfers at the eight golf swing events for the three golf clubs. A list of the independent and dependent variables are detailed below.
Independent Variables:
• Handicap group (two levels) 1. L o w Handicap 2. High Handicap • Clubs (three levels)
1. Driver 2. 3 iron 3. 7 iron • Events
1. TA
2. M B
3. LB
4. TB
5. ED
6. M D
7. BC
8. MF
Dependent Variable:
to be analysed specifically within their independent groups. Huberty and Morris (1989) suggest that multiple ANOVA design was more appropriate than a MANOVA
for statistical designs that are interested in finding how treatment variables affect each of the outcome variables. The treatment variables in this case are the handicap groups and clubs, while the outcome variable was the CPyt %.
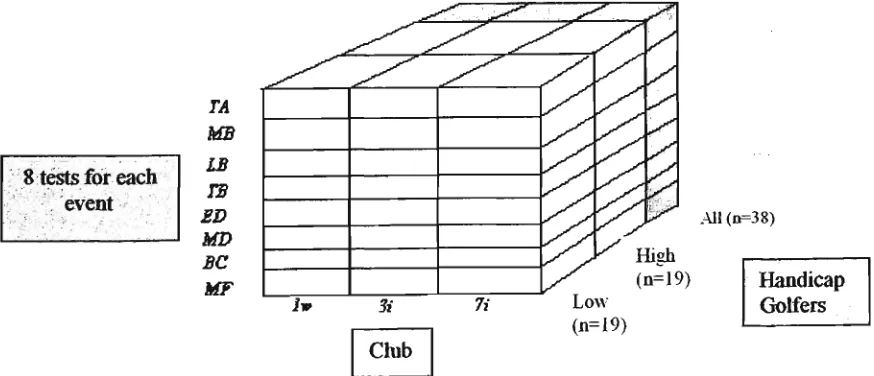
Each of the eight SPANOVA's consists of a 3x2 (clubs x handicaps) factorial design. That was, the first independent variable (Clubs) is within subject (repeated measure) in nature and has three levels, while, the second independent variable (Handicap
groups), is a between subject (not repeated measure) factor with two levels (figure 4.6.1). In addition to the SPANOVA, a repeated measure ANOVA was conducted
between the driver, 3 iron and 7 iron at each event for All Golfers (Low Handicap Golfers and High Handicap Golfers combination n=38, grey area of figure 4.6.1).
8 tests for each event
Club
Figure 4.6.1: SPANOVA design employed to analyse the dependent variable
(CPy,
%)
All (0=38)
There were five assumptions underlying the SPANOVA. All five of these
assumptions were tested and the following recommendations were made by SPSS if the assumptions were violated.
1. Random Selection - Subjects were randomly sampled from the golfing population.
2. Normality - SPSS suggests that each population score should have a normal distribution. This assumption was examined by visual inspection of the data and also Shapiro-Wilks test of normality.
3. Homogeneity of Variance - SPSS recommends that the population scores should have homogeneous variances. This was examined with Levene's test of equal variance between the groups. If the F ratio was greater than 3 then the assumption had been violated. If this test was violated then a more conservative alpha level must be used.
4. Sphericity - SPSS suggests that the variance of the population scores for any two groups should be the same as the variance of any other two population
scores. This assumption was tested using Mauchly's test of sphericity. If this was violated (Mauchly's test is significant p < .05) then the Huynh-Feldt was used to assess the SPANOVA. SPSS uses the Huynh-Feldt method as part of
the statistical procedure.
5. Homogeneity of Intercorrelations - This assumption is defined by SPSS' as the intercorrelation among the various levels of repeated measures factors, which should be consistent from level-to-level of the between subject factors. This assumption is tested with the Box's M statistic. No recommendations
conventions, for theoretical and statistical reasons. Firstly, small subject numbers in each group (n = 19). Franks and Huck (1986) recommend that less rigorous
significant levels be set when there are limited sample size, as in this case. Secondly, previous weight transfer studies appear to neglect the chance of type II errors
(Richards et al, 1983; Wallace et al, 1990; Koslow et al, 1994; Barrentine et al 1994; Kawashima et al, 1994). This statistical procedure may have seen several
studies disregard results because of stringent significance levels and small power.
In addition to the SPANOVA and repeated measure ANOVA, statistical power and
effect size (r| = eta squared, also known as R ) were examined. Speed and Anderson (2000) recommend the use and interpretation of effect size and power to support the significance levels provided by the parametric tests. The use of statistical power and effect size coupled with the p < .1 significance level will provide information on the degree of separation between the groups, the effect, and recommendations for further analysis. Cohen (1988) conventions were used to assess rj2 (small >.01, medium >.06, large >.14) and power (small >.3, medium >.5 and large >.8).
SPSS software (version 10) does not incorporate a post-hoc test for the SPANOVA.