University of South Carolina
Scholar Commons
Theses and Dissertations
2017
Characterization Of Subgrade Resilient Modulus
For MEPDG And The Effects On Pavement
Rutting
Md Mostaqur Rahman
University of South Carolina
Follow this and additional works at:https://scholarcommons.sc.edu/etd Part of theCivil Engineering Commons
This Open Access Dissertation is brought to you by Scholar Commons. It has been accepted for inclusion in Theses and Dissertations by an authorized
administrator of Scholar Commons. For more information, please [email protected].
Recommended Citation
C
HARACTERIZATION OFS
UBGRADER
ESILIENTM
ODULUS FORMEPDG
AND THEE
FFECTS ONP
AVEMENTR
UTTINGby
Md Mostaqur Rahman
Bachelor of Science
Bangladesh University of Engineering and Technology, 2009
Master of Science University of New Mexico, 2012
Submitted in Partial Fulfillment of the Requirements
For the Degree of Doctor of Philosophy in
Civil Engineering
College of Engineering and Computing
University of South Carolina
2017
Accepted by:
Sarah Gassman, Major Professor
Charles Pierce, Committee Member
Inthuorn Sasanakul, Committee Member
Andrew Johnson, Committee Member
ii
iii
DEDICATION
To my beloved parents: Mr. Md Bazlar Rahman & Mrs. Masuda Rahman, and
grandparents: Late Solaiman Ali & Late Morium Nesa, Late Mokbul Ali & Mrs. Sahanara
iv
ACKNOWLEDGEMENTS
I wish to express my deepest gratitude and appreciation to my advisor and chair of
my dissertation committee, Dr. Sarah Gassman, for her guidance and encouragement for
this study and for her time and support throughout my Ph.D. career.
I would like to thank the members of my dissertation committee, Dr. Charles Pierce,
Dr. Inthuorn Sasanakul, and Dr. Andrew Johnson for their valuable recommendations
pertaining to this study and assistance to my professional development.
I also acknowledge to the Office of Materials and Research, South Carolina
Department of Transportation (SCDOT) for the funding to pursue this research. I specially
would like to thank Mr. Jay Thompson, Mr. Luke Gibson, Mr. Mike Lockman, and Mr.
Chad Rawls for their assistance in field data and sample collections.
Cooperation and encouragement from my lab mates are highly appreciated. I would
like to express gratitude to Dr. Emad Gheibi for assistance with the soil index tests for this
study. Special thank goes to Dr. Mike Hasek, Mr. Ryan Starcher, Mr. William Villamil,
Mr. Muwafaq Awad, and Mr. Md Majbah Uddin for their sincere effort and help in
v
ABSTRACT
In 2008, the American Association of State Highway and Transportation Officials
(AASHTO) released a modified pavement design method (i.e., the Mechanistic Empirical
Pavement Design Guide (MEPDG)) based on Long Term Pavement Performance (LTPP)
data from all over the United States. The MEPDG default design parameters developed
from the LTPP database are expected to be significantly different than those for South
Carolina material, traffic and weather conditions, thus the default design parameters may
not be accurate for South Carolina. Therefore, the new pavement design method should be
calibrated for South Carolina conditions by performing MEPDG local calibration.
Different input variables should be studied to run the pavement design program to
minimize the difference between the measured and predicted distresses of pavements.
Rutting is one of the most important asphalt pavement distresses because it is responsible
for both the functional and structural condition degradation of the flexible pavement. There
are limited studies on the effect of resilient modulus (𝑀𝑅) of subgrade on pavement rutting
in the MEPDG. Therefore, the purpose of this study was to characterize the subgrade 𝑀𝑅
and study the effects of subgrade 𝑀𝑅 on pavement rutting.
Firstly, pavement performance evaluation models were developed in this study
using data from primary and interstate highway systems in the state of South Carolina,
USA. Twenty pavement sections were selected from across the state and historical
pavement performance data for those sections was collected. A total of 9 models were
vi
pavements and 4 for Jointed Plain Concrete Pavements (JPCP). Five different performance
indicators were considered as response variables in the statistical analysis: Present
Serviceability Index (PSI), Pavement Distress Index (PDI), Pavement Quality Index (PQI),
International Roughness Index (IRI), and AC pavement rutting. Annual Average Daily
Traffic (AADT), Free Flow Speed (FFS), precipitation, temperature, and soil type (soil
Type A from Blue Ridge and Piedmont Region, and soil Type B from Coastal Plain and
Sediment Region) were considered as predictor variables. Results showed that Type A soil
produced statistically higher PDI, PQI (p < 0.01), and rutting (p < 0.001) compared to Type
B soil on AC pavements; whereas, Type A soil produced statistically higher IRI and lower
PSI (p < 0.001) compared to Type B soil on JPCP pavements. Using the developed models,
local transportation agencies could estimate future corrective actions, such as maintenance
and rehabilitation, as well as future pavement performances.
Next, resilient modulus (𝑀𝑅) of subgrade soils for different geographic regions in
South Carolina was characterized in this study. Shelby tube samples of subgrade soils were
collected from existing pavements in different regions: SC-93 in Pickens county (Upstate
Area), US-521 in Georgetown county (Coastal Plain), and US-321 in Orangeburg county
(Coastal Plain, near the fall line). Statistical analysis was performed to develop 𝑀𝑅
estimation models for undisturbed soils using soil index properties. A correlation between
laboratory measured 𝑀𝑅 with the modulus from Falling Weight Deflectometer tests was
also developed. Finally, the effects of 𝑀𝑅 on subgrade rutting were studied using MEPDG.
Results showed that the developed models offer higher reliability than the universal
Long-Term Pavement Performance models in estimating the resilient modulus of undisturbed
vii
Pavement rutting depends largely on subgrade soil stiffness, which is a function of
the in-situ moisture content and soil index properties. The subgrade soil moisture content
may vary from the specified condition due to variations in the compaction procedure during
construction and fluctuations in the ground water table from seasonal changes. The resilient
modulus (MR) is used to define the subgrade soil stiffness, and is one of the most important
material inputs for the Mechanistic-Empirical (M-E) pavement design method. In this
study, California Bearing Ratio (CBR) tests and laboratory MR tests were performed on
remolded samples of soils collected from different regions in South Carolina. The samples
were prepared at moisture contents above and below the optimum moisture content (wopt).
Correlations between the results from the two tests were developed as a function of
moisture content and statistical models were developed to correlate generalized
constitutive MR model parameters with soil index properties. Furthermore, pavement
rutting was studied using the resilient modulus determined for the subgrade soils
compacted at woptand ±2%wopt. Statistical analysis showed that a slight change in moisture
content during compaction has a significant effect on pavement rutting. The peak value of
both CBR and MR was found on the dry side of optimum and at a dry density less than the
maximum. It is also found that the subgrade soil moisture condition has a significant
influence on subgrade rutting if graded aggregate base is used. However, if a higher
strength base layer is used (i.e., cement stabilized base or asphalt treated aggregate base),
viii
PREFACE
This Ph.D. dissertation is organized in the following order. The first chapter
presents the background and objectives of the research. All subsequent chapters are
prepared in a format to facilitate the writing and submission of journal papers. The paper
related to Chapter 2 has been accepted to the KSCE Journal of Civil Engineering. The
paper related to Chapter 3 has been accepted to the International Journal of Geotechnical
Engineering. The paper related to Chapter 4 is submitted to Transportation Research
Record: Journal of Transportation Research Board. Chapter 5 presents the conclusions and
recommendations of this study.
This dissertation is primarily based on research supported by the SCDOT and the
Federal Highway Administration (FHWA) under contract SPR 708: Calibration of the
AASHTO Pavement Design Guide to South Carolina Conditions – Phase I. The opinions,
findings and conclusions expressed herein are those of the authors and not necessarily those
ix
TABLE OF CONTENTS
DEDICATION ... iii
ACKNOWLEDGEMENTS ... iv
ABSTRACT ...v
PREFACE ... viii
LIST OF FIGURES ... xii
LIST OF TABLES ...xv
CHAPTER 1INTRODUCTION ...1
1.1PROBLEM STATEMENT ...1
1.2BACKGROUND ...3
1.3OBJECTIVES ...9
1.4DISSERTATION OUTLINE ...11
CHAPTER 2PAVEMENT PERFORMANCE EVALUATION MODELS FOR SOUTH CAROLINA ...17
2.1GENERAL ...18
2.2INTRODUCTION ...19
2.3LITERATURE REVIEW ...21
2.4OBJECTIVE OF STUDY ...25
2.5PAVEMENT SECTIONS,DATA AND VARIABLES ...25
2.6METHODOLOGY ...30
2.7RESULTS ...33
x
2.9FUTURE STUDIES ...42
CHAPTER 3EFFECT OF RESILIENT MODULUS OF UNDISTURBED SUBGRADE SOILS ON PAVEMENT RUTTING ...58
3.1GENERAL ...59
3.2INTRODUCTION...59
3.3BACKGROUND ...64
3.4RESEARCH OBJECTIVES ...70
3.5METHODOLOGY ...71
3.6RESULTS AND ANALYSIS ...76
3.7CORRELATION OF MODEL PARAMETERS WITH SOIL INDEX PROPERTIES ...80
3.8CORRELATION OF RESILIENT MODULUS WITH FWDMODULUS...83
3.9EFFECTS OF RESILIENT MODULUS OF SOIL ON SUBGRADE RUTTING ...86
3.10CONCLUSION ...88
CHAPTER 4EFFECT OF SUBGRADE SOIL MOISTURE CONTENT ON RESILIENT MODULUS AND PAVEMENT RUTTING ...127
4.1GENERAL ...128
4.2INTRODUCTION...129
4.3BACKGROUND ...133
4.4RESEARCH OBJECTIVES ...137
4.5METHODOLOGY ...138
4.6RESULTS AND ANALYSIS ...140
4.7CORRELATION OF RESILIENT MODULUS WITH CBRVALUES ...144
4.8CORRELATION OF MODEL PARAMETERS WITH SOIL INDEX PROPERTIES ...146
xi
4.10CONCLUSIONS ...150
CHAPTER 5CONCLUSIONS ...167
5.1SUMMARY ...167
5.2CONCLUSIONS ...169
5.3OVERALL CONCLUSIONS ...174
5.4RECOMMENDATIONS ...175
REFERENCES ...177
APPENDIX A–RESILIENT MODULUS VERSUS CYCLIC STRESS (UNDISTURBED) ...188
APPENDIX B–RESILIENT MODULUS VERSUS CYCLIC STRESS (REMOLDED) ...198
xii
LIST OF FIGURES
Figure 1.1 MEPDG Local Calibration Process with Concept Map ...12
Figure 1.2 Effects of Material Inputs on MEPDG by Orobio and Zaniewski (2011) ...13
Figure 1.3 Variations in Moisture Content with Fluctuations in Ground Water Table (after Chu et al., 1972) ...14
Figure 1.4 Backcalculated Moduli for US 321 of Fairfield (after Baus and Johnson, 2011) ...15
Figure 2.1 Selected Pavement Sections ...44
Figure 2.2 Estimated and Measured Performance Indicators for AC Pavements...46
Figure 2.3 Estimated and Measured Performance Indicators for JPCP Pavements ...47
Figure 3.1 Shapes and Duration of Repeated Load ...90
Figure 3.2 Schematic of Soil Specimen in Triaxial Chamber (AASHTO T 307) ...91
Figure 3.3 Stress Strain Behavior on Resilient Modulus Tests ...92
Figure 3.4 Effects of Degree of Saturation on Resilient Modulus (Drumm et al., 1997) ..93
Figure 3.5 Effects of Dry Density on Resilient Modulus (Seed et al., 1962) ...94
Figure 3.6 Effects of Deviator Stress and Confining Pressure on MR (Ng et al., 2015) ....95
Figure 3.7 Selected Sections for Pavement Coring ...96
Figure 3.8 FWD Testing and Bore-Hole Locations for (a) Orangeburg, (b) Georgetown, (c) Pickens ...98
Figure 3.9 Plan and Profile View of Subgrade Sampling ...99
xiii
Figure 3.11 Particle Size Distributions for (a) Orangeburg, (b) Georgetown, (c)
Pickens…. ...101
Figure 3.12 Resilient Modulus Test Results ...102
Figure 3.13 Effects of Moisture Content and Dry Unit Weight on MR ...103
Figure 3.14 Effects of Moisture Content for Each Site ...104
Figure 3.15 Effects of Moisture Content on MR (All Sites Combined) ...104
Figure 3.16 Effects of Degree of Saturation on MR (All Sites Combined) ...106
Figure 3.17 Effects of Unit Weight on MR (All Sites Combined) ...107
Figure 3.18 Predicted versus Measured Resilient Modulus...108
Figure 3.19 Falling Weight Deflectometer (FWD) Testing Equipment ...109
Figure 3.20 Modulus Probability Chart ...111
Figure 3.21 FWD Modulus versus Laboratory Resilient Modulus...112
Figure 3.22 Effects of Resilient Modulus on Subgrade Rutting ...113
Figure 4.1 Selected Pavement Sections ...152
Figure 4.2 Field Sample Collection and Laboratory Testing ...153
Figure 4.3 Relationship Between Density and Moisture Content...154
Figure 4.4 CBR Test Results ...155
Figure 4.5 Resilient Modulus Test Results ...156
Figure 4.6 Effects of a) Moisture Content and b) Dry Unit Weight on Resilient Modulus….. ...157
Figure 4.7 Resilient Modulus with CBR ...158
Figure 4.8 Resilient Modulus and CBR Correlation ...159
xiv
Figure 4.10 Comparison of Different Models...161
xv
LIST OF TABLES
Table 1.1 FWD Test Site Data by Baus and Johnson (1992) ...16
Table 2.1 Selected Pavement Sections...48
Table 2.2 Descriptive Statistics of the Numerical Variables in the Evaluation Models ....49
Table 2.3 Summary of Precipitation and Temperature Data for Years 2005 to 2014 ...50
Table 2.4 Correlations for PSI and Predictor Variables, and VIF (AC Pavements) ...51
Table 2.5 Effects of Predictor Variables on PSI ...52
Table 2.6 Effects of Predictor Variables on PDI ...53
Table 2.7 Effects of Predictor Variables on PQI ...54
Table 2.8 Effects of Predictor Variables on IRI ...55
Table 2.9 Effects of Predictor Variables on Rutting ...56
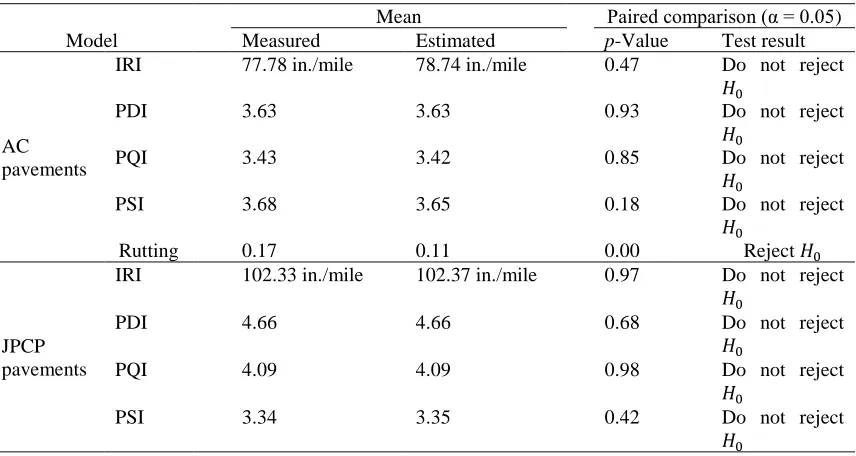
Table 2.10 Paired Comparison between Measured and Estimated Distress Indicators ...57
Table 3.1 Testing Sequence for Subgrade Soils (AASHTO T 307) ...114
Table 3.2 Summary of Sample Collection ...115
Table 3.3 Properties of Investigated Soils ...116
Table 3.4 Sample Description and Summary Test Results ...117
Table 3.5 Variation of Soil Type Along Section ...120
Table 3.6 Model Parameter ...123
Table 3.7 Developed Constitutive Models of Coefficients for South Carolina ...126
Table 4.1 Properties of Investigated Soils ...163
xvi
Table 4.3 Developed Constitutive Models of Coefficients for South Carolina ...165
1
CHAPTER
1
INTRODUCTION
1.1 PROBLEM STATEMENT
Resilient and permanent deformation occurs with time in different pavement layers
due to repeated traffic load application on pavement materials in different weather
conditions (Behzadi and Yandell, 1996). Rutting is the pavement surface depression in the
wheel paths and is caused by the permanent deformation of the pavement layers or
subgrade layers. It originates from the lateral movement of pavement material due to
cumulative traffic loading. Rutting is categorized as a structural distress that affects both
the riding quality and pavement structural health. Therefore, rutting within the pavement
layers is considered to be a major failure mode in flexible pavement that can cause
structural failure of the pavement (Shahin, 2005). Traffic conditions (Zaghloul et al., 2006;
Jadoun and Kim, 2012), climate conditions (Zaghloul et al., 2006; Johanneck and
Kazanovich, 2010; Zapata et al., 2007) and the pavement and subgrade materials (Singh et
al., 2011; Saxena et al., 2010; Xu et al., 2013; Hossain et al., 2011; Wu and Yang, 2012;
Graves and Mahboub, 2006) all have a significant influence on the structural life of a
pavement.
The Mechanistic Empirical Pavement Design Guide (MEPDG) is the latest
pavement design method that was developed using data from the Strategic Highway
Research Program (SHRP) Long-Term Pavement Performance (LTPP) study (AASHTO,
2
(Guide for Design of Pavement Structures, AASHTO, 1993) and the MEPDG are that the
MEPDG predicts multiple performance indicators and it provides a direct tie between
materials, structural design, construction, climate, traffic, and pavement management
systems. This is a change from an empirical based method to a mechanistic based method.
MEPDG is recently being adopted throughout the United States (U.S.) for pavement design
because of its ability to account for the mechanistic behavior of in-situ materials, new
materials and changing load types (Souliman et al., 2010). Local calibration of MEPDG is
required because MEPDG is developed using national data that does not necessarily
represent the material and climate conditions for each state, such as those in South
Carolina. Currently state departments of transportation in the U.S. (e.g. Texas (Banerjee
et al., 2009), New Mexico (Tarefder and Rodriguez-Ruiz, 2013), and North Carolina
(Jadoun and Kim, 2012)) are performing local calibrations of the MEPDG.
Previous studies have shown different pavement layer characteristics (i.e. asphalt
concrete dynamic modulus, coefficient of thermal expansion of Portland cement concrete
layer, resilient modulus of unbound base and subgrade layer) are the key input parameters
of pavement design and performance evaluation (El-Badawy, 2012; Hossain et al., 2011;
Khazanovich et al., 2006; and Saxena et al., 2010; Singh et al., 2013; Xu et al., 2013).
These pavement layer characteristics are required to run different transfer models in
MEPDG. Transfer models are used to predict pavement deformation (i.e., rutting) of
different structural layers. Wu and Yang (2012) evaluated MEPDG flexible pavement
design using pavement management system data for Louisiana. A special optimization
approach was introduced to determine a set of preliminary local calibration factors for the
3
the local calibration of MEPDG rutting models for flexible pavements. They proposed a
set of percentage contributions to the total rutting from different pavement layers based on
previous empirical studies and computation observations. One particular study by Orobio
and Zaniewski (2011) examined each of the pavement material characteristics and
determined the sampling based sensitivity analysis of the MEPDG applied to material
input. They found that the Resilient Modulus (𝑀𝑅) of subgrade had the largest effect on
the rutting predicted from MEPDG. Baus and Stires (2010) also performed a sensitivity
analysis and reported similar findings regarding material inputs. Their study suggested
subgrade 𝑀𝑅 had a significant influence on pavement roughness measured as International
Roughness Index (IRI), total rutting, alligator cracking and longitudinal cracking for
pavements in several South Carolina counties. Therefore, they recommended a
comprehensive subgrade investigation to determine 𝑀𝑅 for South Carolina.
1.2 BACKGROUND
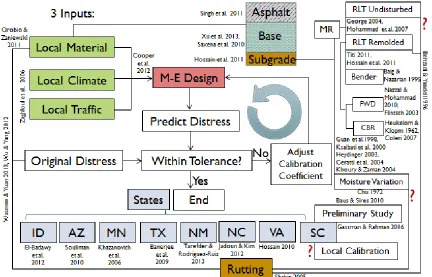
The research framework for this study is shown in Figure 1.1 in the form of a
concept map. Three different types of inputs should be considered to perform the design in
MEPDG: local material, local climate and local traffic. MEPDG compares the output or
the predicted distress with the original distress to minimize the residual error and to
determine the calibration factors. These calibration factors are adjustments applied to the
coefficients and/or exponents of the transfer function or the distress prediction equations
to eliminate bias between the predicted and measured pavement distress (AASHTO, 2008).
Two calibration factors are used in the MEPDG: global and local calibration factors.
A typical asphalt pavement structure has three layers: asphalt layer, base layer and
4
concrete dynamic modulus, coefficient of thermal expansion of Portland cement concrete
layer, resilient modulus of unbound base and subgrade layer) that influence MEPDG local
calibration. Cooper et al. (2012) emphasized the parametric evaluation of design input
parameters (i.e. traffic level, hot-mix asphalt or HMA thickness, asphalt concrete dynamic
modulus, base course thickness and subgrade type) on MEPDG predicted performance. A
sensitivity analysis was conducted to identify the input parameters with the greatest effects
on the predicted pavement performance from the MEPDG. Results showed that traffic level
and the HMA thickness are the two main influential input parameters for pavement rutting.
Another study considered the environmental and traffic impacts on MEPDG (Zaghloul et
al., 2006). The potential impacts of the accuracy of the Enhanced Integrated Climate
Model (EICM) predictions on MEPDG-predicted damage and hence on expected pavement
service life was investigated.
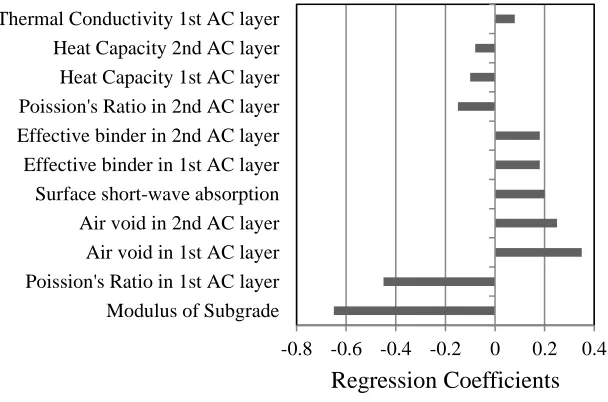
Orobio and Zaniewski (2011) examined each of the pavement material
characteristics and determined the sampling based sensitivity analysis of the MEPDG
applied to material input. They studied 30 parameters for pavement structures that
contained asphalt concrete layers of 2 in., 3 in. and 10 in. at the top of one 3 in. asphalt
treated base layer and the subgrade. Figure 1.2 shows the effects of the 11 material inputs
that showed significant effects on pavement rutting. The bar indicates the regression
coefficients for different material properties. Five of the 11 significant parameters have
negative regression coefficients, and the other six significant parameters showed positive
relations. A positive regression coefficient indicates that MEPDG rutting increases with
5
parameter increases, pavement rutting decreases. The study found that 𝑀𝑅 of subgrade had
the largest effect on the rutting predicted from MEPDG.
Simulation of the base layer material resilient modulus effects on MEPDG was
studied by Xu et al. (2013). In performing the sensitivity analysis in MEPDG software,
pavement rutting and fatigue cracking were considered. Monte-Carlo simulation was
performed in the sensitivity analysis. Results showed that the relationship between the layer
design thickness and 𝑀𝑅 varies from almost linear to nonlinear, which is highly dependent
on the pavement structure and material properties. Characterization and performance
modeling of a cement stabilized base layer in MEPDG was performed by Saxena et al.
(2010) in another study. The current characterization of cement stabilized materials
(CSMs) was evaluated and issues with CSM modeling and characterization in the MEPDG
were discussed.
Behzadi and Yandell (1996) studied the effect of subgrade 𝑀𝑅 on pavement
performance in terms of rutting. In that study, a preliminary step in the prediction of rutting
and cracking in a number of accelerated loading facility trials were presented. The residual
and resilient properties of a silty clay subgrade material were measured using a repeated
load triaxial testing machine. A constitutive equation was developed to predict the amount
of plastic strain after any number of load repetitions at any specific stress level. Both the
elastic and permanent parameters were measured for accurate prediction of rutting and
cracking. In another literature, a model to predict the subgrade resilient modulus for
MEPDG was developed by Khazanovich et al. (2006). They used two standard test
methods for laboratory testing: NCHRP Project I-28 or Harmonized Test Methods for
6
AASHTO T 307 for determining the 𝑀𝑅 of soil. Sensitivity analysis was then performed
with MEPDG to evaluate the resilient modulus for Minnesota subgrade. The resilient
modulus tests were performed on fabricated samples of the unbound material and subgrade
in both of these studies.
Effects of additives such as lime, fly ash, and cement kiln dust on subgrade resilient
modulus have been studied by Hossain et al. (2012). Resilient modulus data for stabilized
subgrade from 139 samples from four types (i.e., Carnasaw, Port, Kingfisher, and Vernon
series) of soils from Oklahoma were evaluated. Different stress based regression models
were evaluated using statistical software. A significant increase in 𝑀𝑅 values was observed
for the three selected additives. The extent of increase in the 𝑀𝑅 value depends on the type
of soil, and type and amount of additive.
The resilient modulus of subgrade soils has also been found through correlation to
other in situ and laboratory tests. Falling weight deflectometer (FWD) has been used to
determine the in-situ modulus (e.g., Nazzal and Mohammad, 2010; Flintsch et al., 2003;
and Ksaibati et al., 2000. The dynamic cone penetrometer test was used to evaluate base
and subgrade layers by Chen et al. (2001). Determination of subgrade 𝑀𝑅 using bender
elements in the laboratory was shown in a study by Baig and Nazarian (1995). AASHTO
design guide also proposed a correlation between California Bearing Ratio (CBR) and
resilient modulus for fine-grained soils (Heukelom and Klomp, 1962). However, the
studies conducted on the estimation of resilient modulus from CBR test results showed that
the reliability of prediction models are not statistically satisfactory which is due to the
7
Pavement material characteristics for different pavement layers are prone to change
with different temperature and moisture content; therefore, several studies have been
performed to determine the seasonal variation of the subgrade MR (Ceratti et al., 2004;
Khoury and Zaman, 2004; Heydinger, 2003; and Guan et al., 1998). Evaluation of MEPDG
seasonal adjustment factors for the moduli of unbound layer has been shown in a study
(Nassiri and Bayat, 2013). It was found that the FWD back calculated subgrade moduli in
different seasons, excluding the freezing season, fits the MEPDG-predicted subgrade
moduli at depth 910 mm with a R-squared of 80 percent.
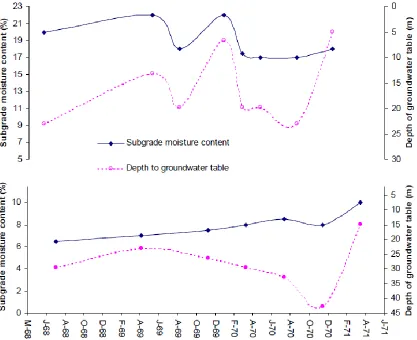
In South Carolina, some limited data on the seasonal variation of subgrade strength
was obtained by Chu (1972). In that study, field tests were performed to examine subgrade
moisture variations under existing pavements in South Carolina. Field studies indicate that
the finer the soil, the greater the difference between the equilibrium and optimum moisture
content. Through their field work, they observed that moisture contents varied with season,
soil type, and location in the pavement system and the height of the water table influenced
subgrade moisture content. They found a strong correlation between subgrade moisture
content and high groundwater table for pavement systems in South Carolina as shown in
Figure 1.3. The study recommended a complete moisture variation study below South
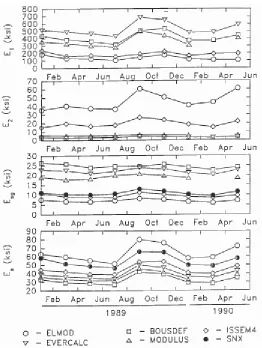
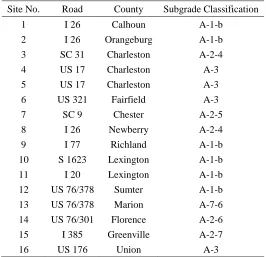
Carolina pavements in connection with pavement performance and design. Baus and
Johnson (1992) performed bi-monthly FWD testing to develop a database of FWD
deflection basins. That study included the establishment of 16 pavement test sections
located throughout South Carolina. Table 1.1 shows the list of site location and soil type
of 16 pavement test sections. Figure 1.4 shows the backcalculated moduli using drop
8
in computed layer moduli (E1 and E2 in Figure 1.4 represent the Young’s modulus of the
asphalt-bound material as the surface layer and the unbound or cement modified material
as the second layer, respectively) for different back-calculation programs; however, there
was little seasonal variation of the subgrade soil moduli (Esg in Figure 1.4 represents
Young’s modulus of subgrade materials as the infinite elastic half-space). A significant
variation in overall pavement structure stiffness was also observed (Ee in Figure 1.4).
Similar results were observed for the other test sections in South Carolina.
Ceratti et al. (2004) performed both laboratory tests and in situ tests to determine
the seasonal variation of subgrade soil MR in Southern Brazil. Laboratory testing was
carried out to establish the relationship between water content and soil suction. The MR
was found for soil specimens submitted to drying, wetting, or wetting-after-drying paths.
Jet-filled tensiometers were used to determine soil suction in different pavement test
sections. A traffic simulator was also used in this study to measure the deflection. A relation
between MR, moisture variation and soil suction for subgrade soils was developed by
Khoury and Zaman (2004). Heydinger (2003) evaluated the seasonal variation of subgrade
soil for Ohio as part of LTPP instrumentation project seasonal monitoring program (SMP).
There have been limited studies to characterize the resilient modulus of subgrade
soils (Hossain, 2008; Titi et al., 2006; George, 2004; Mohammad et al., 2007; Behzadi and
Yandell, 1996) and only a single study focused on the effect of subgrade 𝑀𝑅 on the
pavement permanent deformation or rutting (Behzadi and Yandell, 1996). In the studies
by Hossain (2008) and Titi et al., (2006) remolded samples (which do not necessarily
represent actual field conditions) were used. For the studies by George (2004) and
9
tests; however, the 𝑀𝑅 results were not related to the MEPDG rutting model. Therefore, a
comprehensive research program is necessary to study the effect of in-situ or undisturbed
subgrade 𝑀𝑅 on pavement performance and rutting. The behavior of subgrade soil in
different temperature and climate regions with different moisture variations also requires
study.
Using the available literature on MEPDG local calibration with material inputs,
research gaps that need to be filled were identified for the local calibration process. These
findings were then used to develop a research question aimed to understand the relationship
between subgrade strength and pavement performance in MEPDG. The developed research
questions are: How is pavement rutting influenced by the 𝑀𝑅 of subgrade soils in South
Carolina? What are the effects of moisture variation of subgrade resilient modulus on
pavement rutting?
1.3 OBJECTIVES
The primary objectives of this research are to:
▪ Characterize the resilient modulus (𝑀𝑅) of subgrade soil from different
climate regions of South Carolina.
▪ Study the effect of subgrade resilient modulus on pavement rutting using
the Mechanistic Empirical Pavement Design Guide (MEPDG).
To meet these objectives, the following tasks were performed:
Task 1. Development of pavement performance evaluation models to
investigate the effect of different variables (traffic, climate, soil type) on
different distress indicators (Present Serviceability Index (PSI), Pavement
10
Roughness Index (IRI), and pavement rutting) for South Carolina
pavements. Pavement performance for Asphalt Concrete (AC) and Portland
Cement Concrete (PCC) pavements are compared for two unbound
materials: soil Type A from the Blue Ridge and Piedmont Region, and soil
Type B from Coastal Plain and Sediment Region.
Task 2. Determining the subgrade 𝑀𝑅 using high quality soil samples
collected from different regions of South Carolina by conducting laboratory
𝑀𝑅 tests with appropriate test sequences. The effect of cyclic stress,
confining stress and the moisture content on subgrade soil is addressed.
Model parameters for the bulk stress model and the generalized constitutive
resilient modulus model are established for South Carolina soils to use in
MEPDG. Constitutive models are developed between soil index properties
and the resilient modulus model parameters for undisturbed soils. FWD
model is developed relating laboratory measured 𝑀𝑅 with FWD modulus.
The developed models (constitutive model and FWD model) are compared
to the LTPP models for estimating 𝑀𝑅 of South Carolina soils and the effect
of 𝑀𝑅 obtained from different models on pavement subgrade rutting is
studied using MEPDG.
Task 3. California Bearing Ratio (CBR) tests for subgrade soils of different
regions in South Carolina are evaluated at different moisture contents.
Correlations are made between the laboratory remolded 𝑀𝑅 values with
11
moisture variation of subgrade resilient modulus (𝑀𝑅) on pavement rutting
is studied for different moisture content.
1.4 DISSERTATION OUTLINE
Following the problem statement, background and objectives that have been
presented in Chapter 1, the next four chapters are organized based on each of the three
tasks and the conclusion. Each of next three chapters has an introduction, literature review,
objectives, methodology, and result section. Chapter 2 presents the results from Task 1 to
develop pavement performance evaluation models. Effects of different traffic, climate and
material inputs on pavement performance are discussed. Chapter 3 presents the results from
the field and laboratory study conducted to characterize the subgrade resilient modulus for
Task 2. Different 𝑀𝑅 models are discussed and the effect of cyclic stress, deviator stress
and moisture content on 𝑀𝑅 is also presented. Chapter 4 is based on Task 3 where the 𝑀𝑅
found from laboratory testing in Task 2 is compared to CBR test results. The effect of
moisture variation of subgrade 𝑀𝑅 on pavement rutting models from Task 3 will be also
presented in Chapter 4. Chapter 5 will summarize the findings and culminates with
12
13
Figure 1.2 Effects of Material Inputs on MEPDG by Orobio and Zaniewski (2011) -0.8 -0.6 -0.4 -0.2 0 0.2 0.4
Modulus of Subgrade Poission's Ratio in 1st AC layer Air void in 1st AC layer Air void in 2nd AC layer Surface short-wave absorption Effective binder in 1st AC layer Effective binder in 2nd AC layer Poission's Ratio in 2nd AC layer Heat Capacity 1st AC layer Heat Capacity 2nd AC layer Thermal Conductivity 1st AC layer
14
15
ELMOD (ELMOD, 1985), BOUSDEF (Zhou et al., 1990), ISSEM4 (ISSEM4, 1987), EVERCALC (EVERCALC, 1990), MODULUS (Scullion et al., 1990). SNX (Baus and Johnson, 1992).
E1 = Young’s modulus of asphalt-bound material layer or surface layer,
E2 = Young’s modulus of unbound or cement modified material layer or second layer,
Esg = Young’s modulus of the subgrade or the infinite elastic half-space,
Ee = overall pavement structure stiffness.
16
Table 1.1 FWD Test Site Data by Baus and Johnson (1992)
Site No. Road County Subgrade Classification
1 I 26 Calhoun A-1-b
2 I 26 Orangeburg A-1-b
3 SC 31 Charleston A-2-4
4 US 17 Charleston A-3
5 US 17 Charleston A-3
6 US 321 Fairfield A-3
7 SC 9 Chester A-2-5
8 I 26 Newberry A-2-4
9 I 77 Richland A-1-b
10 S 1623 Lexington A-1-b
11 I 20 Lexington A-1-b
12 US 76/378 Sumter A-1-b
13 US 76/378 Marion A-7-6
14 US 76/301 Florence A-2-6
15 I 385 Greenville A-2-7
17
CHAPTER 2
PAVEMENT PERFORMANCE EVALUATION MODELS FOR
SOUTH CAROLINA
1________________________
1Adapted from Rahman, M. M., M. M., Uddin, and S. L. Gassman. Accepted by
KSCE Journal of Civil Engineering. Reprinted here with permission of
18
2.1 GENERAL
This chapter develops pavement performance evaluation models using data from
primary and interstate highway systems in the state of South Carolina, USA. Twenty
pavement sections are selected from across the state, and historical pavement performance
data of those sections are collected. A total of 9 models were developed based on regression
techniques, which include 5 for Asphalt Concrete (AC) pavements and 4 for Jointed Plain
Concrete Pavements (JPCP). Five different performance indicators are considered as
response variables in the statistical analysis: Present Serviceability Index (PSI), Pavement
Distress Index (PDI), Pavement Quality Index (PQI), International Roughness Index (IRI),
and AC pavement rutting. Annual Average Daily Traffic (AADT), Free Flow Speed (FFS),
precipitation, temperature, and soil type (soil Type A from Blue Ridge and Piedmont
Region, and soil Type B from Coastal Plain and Sediment Region) are considered as
predictor variables. Results showed that AADT, FFS, and precipitation have statistically
significant effects on PSI and IRI for both JPCP and AC pavements. Temperature showed
significant effect on PDI, PQI (p < 0.01), and rutting (p < 0.05) for AC pavements.
Considering soil type, Type A soil produced statistically higher PDI, PQI (p < 0.01), and
rutting (p < 0.001) compared to Type B soil on AC pavements; whereas, Type A soil
produced statistically higher IRI and lower PSI (p < 0.001) compared to Type B soil on
JPCP pavements. Using the developed models, local transportation agencies could estimate
future corrective actions, such as maintenance and rehabilitation, as well as future
19
2.2 INTRODUCTION
The South Carolina Department of Transportation (SCDOT) is currently
conducting the first phase of research on Mechanistic-Empirical Pavement Design Guide
(MEPDG) local calibration for the state of South Carolina, USA. The purpose of this
research is to identify sources of data within SCDOT for calibration and to identify
in-service pavement sections suitable for calibration studies. Selection of the hierarchical
input level for each input parameter is necessary for pavement sections. The new MEPDG
requires input data in four major categories: climate, traffic, materials, and pavement
performance. The biggest challenge to use the performance data from SCDOT’s specific
pavement management system is the incompatibility of the SCDOT pavement performance
data collection protocols with the new MEPDG distress identification protocol. Hence,
there is a need for developing performance evaluation models for the South Carolina
pavements, by taking into account both local and MEPDG distress indices.
Pavement performance prediction is essential for rationally allocating resources at
the network level (Meegoda and Gao, 2014), including resources for future maintenance
and rehabilitation actions. Transportation agencies can save money by reducing the
pavement deterioration prediction error (Madanat, 1993). To determine the future
performance of pavements, the present condition of the pavement and the variables that
control the pavement deterioration must be known. Pavement condition in South Carolina
is assessed by network level pavement roughness and surface distress data annually
collected on the interstate and the primary highway systems by the SCDOT. Collected
20
longitudinal cracking, raveling and patching. These condition data are used to determine
different pavement performance indicators: Present Serviceability Index (PSI), Pavement
Distress Index (PDI), Pavement Quality Index (PQI), International Roughness Index (IRI),
and rutting. IRI and PSI are functions of roughness, PDI is a function of different distresses,
PQI is a function of both pavement serviceability and distresses, and rutting is the surface
depression under wheel path. Factors that affect pavement condition and performance
indicators can be categorized into three groups: factors related to traffic, factors related to
climate and factors related to material. The effect of these factors on pavement
deterioration and performance indicators varies as described in a few previous literatures
(Archilla and Madanat, 2001; Cooper et al., 2012; and Orobio and Zaniewski, 2011).
Truck traffic volume, climate (e.g., temperature, precipitation), and pavement
structural condition have been shown to contribute most significantly to the deterioration
of pavement (Meegoda and Gao, 2014). The magnitude and the number of wheel load
passes is the main contributor to deteriorate the pavement surface (Isa et al., 2005). Usually
medium truck loading is used to predict pavement deterioration in terms of annual average
daily traffic (AADT). In South Carolina, about 10,000 large freight trucks (typically,
weighing more than 10,000 pounds) traveled on the major interstates each day in 2007
(Uddin and Huynh, 2015). Moreover, South Carolina pavements are exposed to extreme
summer temperatures that average near 32 °C (90 °F) during the day and the precipitation
is primarily in the form of rainfall that averages about 127 cm/year (50 inch/year) (NCEI,
2015). With the change of temperature and moisture content, pavement material
characteristics for different pavement layers are prone to change (Nassiri and Bayat, 2013).
21
layer, base layer and subgrade layer) are sufficiently large to cause cracking of the
surfacing material, a pavement may be considered as failed (Seed et al., 1962). South
Carolina soils that serve as the subgrade layer can be divided into two regions separated by
the geological fall line: the Blue Ridge/Piedmont Region and the Coastal Plain/Sediment
Region. The soils in each region have different characteristics and thus are expected to
have different impacts on pavement condition and performance indices.
Prior to MEPDG local calibration, a statistical study is required to assess the
influence of various climatic, traffic and material inputs on pavement deterioration as
related to pavement roughness and pavement distress indicators. Thus, the purpose of this
study is to develop performance evaluation models using regression techniques for two of
the MEPDG performance indicators: International Roughness Index (IRI), and rutting; and
three of the SCDOT pavement performance indices: PSI, PDI and PQI. To achieve this,
five different design inputs are considered for the study: AADT, Free Flow Speed (FFS),
precipitation, temperature, and soil type. These inputs are selected based on their
importance on pavement performance and availability in the SCDOT database.
2.3 LITERATURE REVIEW
Pavement performance evaluation models have been developed for several states
in the USA. These include the pavement performance models that were developed for the
Delaware Department of Transportation (DelDOT) using the pavement inventory data of
their pavement management system (Mills et al., 2012). The variables they considered were
pavement age, geometry, functional class, type of overlay, pavement condition rating, and
the annual average volume of traffic. Simple and multiple regression analysis were used to
22
pavement were developed for Georgia using regression technique (Kim and Kim, 2006).
The researchers found that linear regression models are effective to forecast pavement
performance if Average Annual Daily Traffic (AADT) is considered as a predictor. Gulen
et al. (2001) developed regression models to predict the performance of pavements in
Indiana, where they considered pavement roughness as the response variable, and
pavement age and AADT as predictor variables. Performance models were also developed
using regression techniques for Minnesota pavements (Prozzi and Madanat, 2004). A
network level pavement performance model was developed using 20 years of historical
pavement condition data for approximately 19,000 highway sections maintained by the
New York State Department of Transportation (NYSDOT) (DeLisle et al., 2003). In a
study by the Michigan Department of Transportation (MDOT), pavement distress data was
used to assess the impact of construction (smoothness, early completion of construction,
and nuclear density) on pavement performance (Chang et al., 2001). Pavement
performance model was also developed using Pavement Condition Rating for North
Carolina Department of Transportation (NCDOT) (Chan et al., 1997); and an overall
distress index, a structural index with roughness index for North Dakota Department of
Transportation (NDDOT) (Johnson and Cation, 1992).
In addition to aforementioned studies in the USA, some other countries have
developed performance models for their respective pavement systems: Malaysia (Isa et al.,
2005), Portugal (Ferreira et al., 2010), Canada (Hong and Wang, 2003), and New Zealand
(Henning et al., 2004). Isa et al. (2005) used regression techniques to develop pavement
performance models for federal roads of Malaysia. Ferreira et al. (2010) tested two
23
through the use of the strategic evaluation tool (SET) based on deterministic
segment-linked optimization model and solved by a method developed using generic algorithm
method. A simple probabilistic approach was developed for Ontario pavement based on
nonhomogeneous continuous Markov chain by Hong and Wang (2003). In New Zealand,
data from 63 Long Term Pavement Performance (LTPP) sites was used to calibrate the
pavement deterioration models currently used on the state highway network (Henning et
al., 2004).
Different statistical and regression techniques have been used to develop pavement
evaluation models and to study the effects of different factors on pavement performance.
Thyagarajan et al. (2010) studied the critical input parameters of MEPDG to investigate
the effect of variability in key input parameters. The influence of project specific input
uncertainties were evaluated on predicted pavement performance and distresses. They
found Tornado plots and extreme tail analysis are useful statistical tools that can assist
design engineers to identify the relative importance of input parameters and the effect of
their variability on design reliability. Salama et al. (2006) investigated the effect of
different axle and truck types on flexible pavement damage. Condition evaluation models
were developed for Distress Index (DI), Ride Quality Index, and rutting. A relative
comparison of different variables was carried out using simple, multiple and stepwise
regression technique. An auto regression approach for predicting pavement DI was
developed, in other study, with limited data (Ahmed et al., 2010). Gulen et al. (2001) also
used regression techniques to develop improved performance prediction models. IRI was
used as a response variable, while the age of the pavement and the current AADT were
24
statistically strong models. Xu et al. (2014) used linear regression and artificial neural
networks to predict the deterioration of Wheel Path Cracking (WPC) over a one year
period. The extent and severity of WPC along with age and AADT were used as input
variables in the study. An empirical comparison of nine representative statistical pavement
performance models was conducted by Chu and Durango-Cohen (2008) using
serviceability data from the AASHTO road test. The purpose of the study was to understand
the effect of different statistical assumptions and estimation techniques on the models
predictive capabilities. Rahman and Tarefder used system dynamic approaches to develop
functional and structural condition based pavement evaluation model (2015). Both
functional and structural condition of the pavement are equally important from an
engineering perspective (Tarefder and Rahman, 2016). Good correlation between
functional and structural condition index was observed for New Mexico pavements.
Recently, Gupta et al. (2012) performed a critical review of the literature related to flexible
pavement performance models. The paper presented a detailed review of various pavement
performance models to examine the roles of factors related to pavement materials,
environmental conditions, and type of traffic and volume of traffic. They concluded from
other literatures that age and traffic are the most important variables to predicting pavement
distress. Moreover, climate factors affect the structural properties of the pavements which
are responsible for the deterioration of the pavements. Since these factors are uncertain in
nature and vary from place to place, they considered them as important in analyzing the
performance of pavement.
A minimum of 20 pavement test sections was recommended by Baus and Stires
25
were selected from 15 counties in South Carolina to serve as a representative sample—14
Asphalt Concrete (AC) sections of average length 5.3 miles and 6 Portland Cement
Concrete (PCC) pavement sections of average length 5.8 miles. In the state of South
Carolina, the mostly used PCC pavement type is Jointed Plain Concrete Pavement (JPCP)
and all the 6 selected PCC sections are JPCP. None of the selected pavement sections are
Continuously Reinforced Concrete Pavement or Jointed Reinforced Concrete Pavement.
2.4 OBJECTIVES OF STUDY
The objectives of this study are to:
1. Develop performance evaluation models for AC pavements and JPCP using
multiple regression techniques for different distress indicators: PSI, PDI, PQI, IRI,
and rutting.
2. Investigate the effect of different variables (AADT, FFS, precipitation,
temperature, and soil type) on AC and JPCP pavement performances.
3. Compare AC and JPCP pavement performance for two unbound materials: soil type
A from the Blue Ridge and Piedmont Region, and soil type B from Coastal Plain
and Sediment Region
2.5 PAVEMENT SECTIONS, DATA AND VARIABLES
2.5.1 Pavement Sections Selections
Table 2.1 lists the selected pavement sections with their location, pavement type,
surface course type and thickness, base course type and thickness, pavement length, and
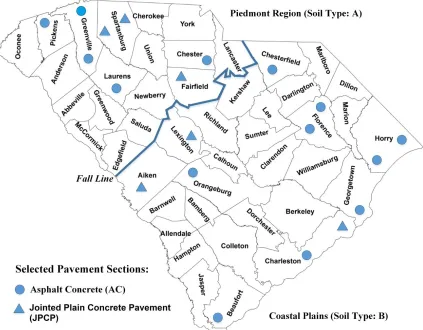
date of construction. Figure 2.1 shows the location of the selected pavement sections. To
26
1. The pavement sections are primary or interstate routes located in Coastal Plain and
Piedmont Regions in South Carolina.
2. Both flexible and rigid pavements with typical layer configuration and material
selection, including traditional and new materials, are included.
3. Different service times for different types of pavements are included.
4. Priority is given to the initially selected sections with historical data, including
climate, materials, traffic, and performance data.
5. Selected sections are not overlaid or rehabilitated, and are suitable for MEPDG
local calibration.
2.5.2 Performance Data
Historic performance data for the selected pavement sections were collected using
the pavement viewer of SCDOT’s Integrated Transportation Management System (ITMS).
Available performance data for the past 10 years were collected and summarized. The data
included five main performance measures: (1) PSI, (2) PDI, (3) PQI, (4) IRI, and (5)
rutting. A total of 160 data points, representing each performance indicator, were collected
for the 20 pavement sections. The number of samples collected for the AC pavements was
103, and that of the JPCP pavements was 57. Descriptive statistics of the numerical
variables are presented in Table 2.2. The performance indicators are described next, along
with their value ranges.
2.5.2.1 Present Serviceability Index (PSI)
PSI represents the riding quality of the pavement and is calculated from the mean
IRI. SCDOT uses the following equation developed by Paterson (1986) for estimating PSI.
27
where IRI is in inch/ mile and PSI is a dimensionless index ranging from 0 to 5; 5 represents
perfect condition and 0 represents failed condition. In the SCDOT pavement management
system, a newly constructed pavement is assigned a PSI value of 4.5.
2.5.2.2 Pavement Distress Index (PDI)
PDI describes the observed surface distresses for PCC pavements and observed
surface distress with mean rut depth for AC pavements. For PCC pavements observed
surface distress includes: punchouts, spalling, pumping, patching, transverse cracking,
longitudinal cracking, faulting, and surface deterioration. For AC pavements observed
surface distress includes: raveling, fatigue cracking, patching, transverse cracking, and
longitudinal cracking. To determine PDI, SCDOT uses the following equation (PMS,
1990).
𝑃𝐷𝐼 = 5.0 − 𝐴𝐷𝑉 (2.2)
where ADV is the adjusted distress value. Description of the ADV can be found in different
literatures (e.g., Wang, 2002). Newly constructed pavements are assumed to be distress
free, meaning that the ADV is initially zero. Therefore, those pavements are assigned a
PDI of 5.0. PDI ranges from 0 to 5, where 5 represents perfect condition and 0 represents
failed condition. PDI is a dimensionless index similar to PSI.
2.5.2.3 Pavement Quality Index (PQI)
PQI is the combination of PSI and PDI, which represents the overall condition of
the pavement. SCDOT determines PQI using following equation (PMS, 1990).
𝑃𝑄𝐼 = 1.158 + 0.138×𝑃𝑆𝐼×𝑃𝐷𝐼 (2.3)
where PQI is a dimensionless index and ranges from 0 to 5. In the SCDOT pavement
28 2.5.2.4 International Roughness Index (IRI)
IRI is an index for roughness measurement obtained by road meters installed on
vehicles or trailers. In South Carolina, IRI values are derived from wheel path profiles
obtained using non-contacting inertial profilers. Typically, data readings are taken
continuously and data from each 0.10 mile intervals are reported (Baus and Hong, 2004).
IRI values less than 170 inch/mile are acceptable and any IRI value less than 95 inch/mile
indicates good roughness condition of the pavement (FHWA, 2004; Shahin, 2005).
2.5.2.5 Rutting
Rutting is a longitudinal surface depression in the wheel path resulting from plastic
or permanent deformation in each pavement layer. It is the primary load related distress in
flexible pavement. SCDOT measures rutting using a three-point automated profiler. The
unit used for rut depths is inch where less than 0.5 inches rut depth is considered as less
severe (Shahin, 2005).
2.5.3 Predictor Variables
In this study, effects of the following five predictor variables are investigated: (1) Annual
Average Daily Traffic (AADT), (2) Free flow speed (FFS), (3) Precipitation, (4)
Temperature, and (5) Soil type. Variables (1) to (4) are numerical, and variable (5) is
categorical.
2.5.3.1 Annual Average Daily Traffic (AADT)
AADT is the average daily traffic on a roadway section for all days of the week
during a period of one year, expressed in vehicle per day (veh/d). The number of repeated
traffic is solely responsible for the load related pavement distresses. AADT data were
29 2.5.3.2 Free Flow Speed (FFS)
FSS affects the pavement roughness and surface friction. The following equations
(Dowling, 1997) were used to calculate the FFS of the pavement sections.
FFS = (0.88 ∗ Link Speed Limit + 14); for speed limit > 50 mph (2.4)
FFS = (0.79 ∗ Link Speed Limit + 12); for speed limit ≤ 50 mph (2.5)
2.5.3.3 Precipitation
Moisture content is an environmentally driven variable that can affect the pavement
layer properties, such as degradation of material quality, loss of bond between layers and
softening of the subgrade layer (ARA, 2004). Hence, precipitation could affect the
pavement performances. The mean annual precipitations of the pavement sections were
taken from their corresponding counties, found from the National Climate Data Center
database (NCEI, 2015), for the years 2005 to 2014.
2.5.3.4 Temperature
Temperature is another environmental factor, which affect pavement performance.
For the selected pavements sections, temperature information was collected for their
respective counties from the National Climate Data Center database (NCEI, 2015).
Specifically, yearly mean temperature data were collected for the years 2005 to 2014. The
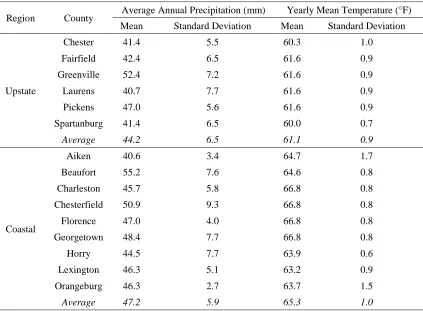
summary of the precipitation and temperature data for different selected counties are shown
in Table 2.3. Table 2.3 indicates that coastal region has both higher average annual
precipitation and higher mean annual temperature than upstate region for the period of
30 2.5.3.5 Soil Type
Subgrade soil strength for the selected pavement sections is currently not available;
therefore, different soil types have been chosen as an alternative. Two types of soils are
selected: Type A and Type B. South Carolina soils can be divided into two regions
separated by the geological fall line as shown in Figure 2.1: (i) Upstate Area or Blue Ridge
and Piedmont Region (Type A), and (ii) Coastal Plain and Sediment Region (Type B)
(SCDOT, 2010).
Type A soils are described as micaceous clayey silts and micaceous sandy silts,
clays, and silty soils in partially drained condition; Type B soils include fine sand that is
difficult to compact. In terms of AASHTO classifications, Type B soils are primarily A-1
to A-4 and Type A soils are predominately A-5 or higher (Pierce et al., 2011). The
AASHTO system classifies soils into eight groups: A-1 through A-8 where A-1 to A-3 are
granular soils, A-4 to A-7 are fine grained soils, and A-8 represents organic soils
(AASHTO, 2008).
2.6 METHODOLOGY
To formulate pavement performance evaluation models, multiple linear regression
analysis was conducted. Specifically, using multiple linear regression analysis, for
performance measures/indicators, two separate models were formed for each performance
indicator. The first model describes the effects of predictor variables on the indicators if
the pavement is AC, and the second model describes the effects if the pavement is JPCP.
The results of the models will be compared with each other and the best model will be
suggested for the performance evaluation. A brief description on multiple linear regression
31
2.6.1 Multiple Linear Regression
A linear regression model that contains more than one predictor/independent
variable is called a multiple linear regression model. It takes into account the effect of all
specified predictor/independent variables at the same time. Suppose the response variable
𝑌 is quantitative and at least one predictor variable 𝑋𝑖 is quantitative, then the multiple
linear regression models have the following form.
𝑌 = 𝛽0+ 𝛽1𝑋1+ 𝛽2𝑋2+ ⋯ + 𝛽𝑖𝑋𝑖 (2.6)
where 𝑌 = response variable (e.g., IRI, rutting, PDI, PQI, and PSI); 𝛽0= intercept;
𝛽𝑖= coefficients; and 𝑋𝑖 = predictor variables (e.g., 𝑙𝑜𝑔10𝐴𝐴𝐷𝑇, Temperature,
Precipitation, FFS, and Soil Type). The intercept 𝛽0 defines the value of 𝑌 when all 𝑋𝑖’s
are 0. The regression coefficient 𝛽𝑘 represents the change in the mean response
corresponding to a unit change in 𝑋𝑘 when all other 𝑋𝑖’s are held constant, 𝑘 ∈ 𝑖.
2.6.1.1 Assumptions
Multiple linear regression analysis makes several key assumptions. The principal
assumptions (Keith, 2015) are described here.
1. Dependent and independent variables are linearly related through regression
coefficients. An appropriate transformation of the variable must be incorporated in
the model if there is non-linearity.
2. Each observation should be drawn independently from the population. This means
that the errors for each observation are independent from those of others.
3. There must be equal variance of errors across all levels of the independent
32
4. The errors are normally distributed. This assumption is only vital in case of small
samples.
5. There is little or no multicollinearity in the data. Multicollinearity occurs when
several independent variables correlate at high levels with one another.
2.6.1.2Standard Regression Coefficients
To compare the relative importance of different predictor variables, standardized
coefficients values are often utilized. Standardized coefficients are determined by
converting all variables into Z scores, which in turn, convert the distribution mean to zero
and standard deviation to one. The standardized multiple linear regression is specified as
the following.
𝑌′= 𝛽
1′𝑋1′+ 𝛽2′𝑋2′ + ⋯ + 𝛽𝑖′𝑋𝑖′ (2.7)
𝑌′= 𝑍
𝑦 =𝑌̅−𝑌𝜎
𝑦 (2.8)
𝑋𝑖′= 𝑍 𝑥𝑖 =
𝑋̅𝑖−𝑋𝑖
𝜎𝑥𝑖 (2.9)
where 𝑌′ = standardized response variable; 𝛽𝑖′ = standardized coefficients; 𝑋𝑖′=
standardized predictor variables; 𝑌̅ = average value of response variable; 𝜎𝑦= standard
deviation of response variable; 𝑋̅𝑖= average value of predictor variables; and 𝜎𝑥𝑖= standard
deviation of predictor variables.
2.6.1 Analysis
The statistical analysis was started with a bivariate analysis to examine the Pearson
intercorrelation among a distress indicator (e.g., PSI, IRI, PDI, and rutting) and the
33
the predictor variables. To do this, a variance inflation factor (VIF) was introduced. VIF
measures how much the variance of a coefficient is increased due to multicollinearity, and
a VIF ≥ 10 indicates a serious multicollinearity problem (Neter and Wasserman, 1996).
Next, a multiple regression analysis was conducted to predict the values of response
variable based on the value of predictor variables. Then, unstandardized and standardized
coefficients for each predictor variables were analyzed to determine precisely the level of
change in the response variable accounted for by a change in the predictor variable. The
overall 𝑅2 and adjusted 𝑅2of the regression model were calculated to assess the percentage
of the variance in the distress indicator that was explained by the predictor variables. The
aforementioned procedure was followed for each distress indicator and both pavement
types. The procedure was repeated 9 times. All analyses were performed in IBM SPSS
Statistics software (v 12).
2.7 RESULTS
Results of the Pearson intercorrelation analysis of the PSI with the predictor
variables, in case of AC pavements, are presented in Table 2.4. The correlation between
PSI and predictor variables are found as low to large, with the Pearson correlation values
(r) ranging from 0.05 to 0.58. FFS is the strongest related predictor of PSI (r = 0.58, p <
0.01). The table also shows that some of the predictor variables have strong correlations
with each other. For instance, AADT is strongly correlated with Precipitation (r = 0.39, p
< 0.01) and with Temperature (r = -0.62, p < 0.01). In contrast, the correlation between
FFS and Temperature, and Soil type and Precipitation are found as low. Lastly, VIF values
of predictors suggest that there is no serious multicollinearity problem in the data. Similar
34
with the predictor variables. For the sake of brevity, those outputs are not presented here.
However, all of the correlation and VIF values are within acceptable range (VIF < 10).
Performance evaluation models for PSI, PDI, PQI, IRI, and rutting are reported in
Table 2.5 through Table 2.9, respectively. Except rutting, each performance indicator has
two different models: one for AC pavements and another one for JPCP. The rutting model
is only developed for AC pavements, because PCC pavements do not show rut in the wheel
path. Each model shows different statistical results from the analyses; which include
unstandardized regression coefficients (β), standardized regression coefficients (β′),
coefficient of determination (𝑅2), and overall model significance (F-test). In the analysis,
soil type B is considered as the reference soil type. Nine evaluation models were fitted; and
each model was found overall statistically highly significant after the F-test, except for the
PDI model for AC pavements (p < 0.01) and rutting model for AC pavements (p < 0.01).
The effects of different independent variables on PSI for AC pavements and JPCP
are shown in Table 2.5. In the PSI model for AC pavements, FFS, AADT and precipitation
were found to have statistically significant effects on PSI. FFS showed positive effects on
PSI, β = 0.021; p < 0.001. In contrast, AADT poses negative effects on PSI, β = -0.151; p
< 0.01. Precipitation also showed negative effects on PSI, β = 0.006; p < 0.05. FFS showed
higher absolute standardized regression coefficient (β′ = 0.684) than AADT (β′ = -0.301)
or precipitation (β′ = -0.211). This indicates that FFS has more importance to explain PSI
of AC pavements than AADT or precipitation. The model was overall statistically
significant, F (5, 94) = 14.913; p < 0.001, and the model explained 44.2% of total variation