HIGHLIGHTED ARTICLE
| INVESTIGATION
Comparison of Genotypic and Phenotypic Correlations:
Cheverud
’
s Conjecture in Humans
Sebastian M. Sodini,* Kathryn E. Kemper,* Naomi R. Wray,*,†and Maciej Trzaskowski*,1 *Institute for Molecular Bioscience and†Queensland Brain Institute, The University of Queensland, St Lucia, Brisbane 4072, Australia ORCID IDs: 0000-0001-7421-3357 (N.R.W.); 0000-0001-8559-6525 (M.T.)
ABSTRACTAccurate estimation of genetic correlation requires large sample sizes and access to genetically informative data, which are not always available. Accordingly, phenotypic correlations are often assumed to reflect genotypic correlations in evolutionary biology. Cheverud’s conjecture asserts that the use of phenotypic correlations as proxies for genetic correlations is appropriate. Empirical evidence of the conjecture has been found across plant and animal species, with results suggesting that there is indeed a robust relationship between the two. Here, we investigate the conjecture in human populations, an analysis made possible by recent developments in availability of human genomic data and computing resources. A sample of 108,035 British European individuals from the UK Biobank was split equally into discovery and replication datasets. Seventeen traits were selected based on sample size, distribution, and heritability. Genetic correlations were calculated using linkage disequilibrium score regression applied to the genome-wide association summary statistics of pairs of traits, and compared within and across datasets. Strong and significant correlations were found for the between-dataset comparison, suggesting that the genetic correlations from one independent sample were able to predict the phenotypic correlations from another independent sample within the same population. Designating the selected traits as morphological or nonmorphological indicated little difference in correlation. The results of this study support the existence of a relationship between genetic and phenotypic correlations in humans. This finding is of specific interest in anthropological studies, which use measured phenotypic correlations to make inferences about the genetics of ancient human populations.
KEYWORDSgenetic correlation; genetic proxy; linkage disequilibrium score regression; morphological nonmorphological traits; UK Biobank
G
ENETIC correlations are a measure of genetic factors shared between two traits. When two traits are highly genetically correlated, the genes that contribute to the traits are usually co-inherited (Lynch and Walsh 1998). While tra-ditionally used in animal breeding (Lynch and Walsh 1998), in a broader research context, genetic correlations contribute to understanding the development and pathways of traits, population-level gene flow, and the co-occurrences of traits (Via and Hawthorne 2005). For this reason, genetic correla-tions play an important role in evolutionary biology, andestimates of genetic correlations are also used in theoretical modeling of human populations.
Genetic correlations (rg) are calculated from the additive
genetic variance and covariance between traits, as shown for traits X and Y,
rg¼covgðX;YÞ=
ffiffiffiffiffiffiffiffiffiffiffiffiffiffi VgXVgY
p
;or for standardized traits where the phenotypic variances are one, rg¼covgðX;YÞ=
ffiffiffiffiffiffiffiffiffiffiffi h2
Xh2Y
p
; whereh2
Xand whereh2Y are the heritability estimates of the
two traits andVgX andVgY are the variances of the traits.
Traditionally, genetic correlations are calculated from pedigree data using statistical methods to partition phenotypic (co)variance into genetic variance and genetic covariance (Henderson 1986). More recent methods make use of ge-nome-wide single nucleotide polymorphism (SNP) data and the very small coefficients of relationship between very large numbers of unrelated individuals to calculate these parame-ters (Lee et al. 2012). Since only common variants are in-cluded in the calculations, this approach assumes that the genetic correlation is the same across the allelic frequency Copyright © 2018 by the Genetics Society of America
doi:https://doi.org/10.1534/genetics.117.300630
Manuscript received December 13, 2017; accepted for publication April 2, 2018; published Early Online May 8, 2018.
Available freely online through the author-supported open access option.
Supplemental material available at Figshare: https://doi.org/10.25386/genetics. 6213968.
spectrum. Accepting this caveat as reasonable, the approach has an advantage over the traditional methods, as unrelated individuals are less likely to have had exposure to similar environmental effects, reducing confounding from shared environment. Additionally, as genotyping becomes cheaper, genome-wide SNP data are becoming more readily and widely available than pedigree data. Moreover, unbiased es-timates of genetic correlations are achievable with minimal computing resources from analysis of summary statistics from genome-wide association studies (GWAS) via the linkage dis-equilibrium score (LD score) regression method (Bulik-Sullivanet al.2015a; Niet al.2017).
The sampling variance of a genetic correlation estimate depends on, and is larger than, the sampling variances of the concurrently estimated heritabilities (Robertson 1959; Visscheret al.2014). Hence, large sample sizes are needed to estimate genetic correlations with accuracy. James Che-verud proposed in 1988 that phenotypic correlations (rp) could
be used as a proxy for genetic correlations (Cheverud 1988). While there has been criticism of the conjecture, most notably by Williset al.(1991), subsequent studies in various organisms have provided much empirical evidence and the-ory supporting the conclusion. Roff (1996) considered a variety of traits from previously published datasets. This in-vestigation showed that the relationship between the two correlations was most concordant in morphological traits, as opposed to behavioral or life history traits. In addition, while the average absolute disparity (Dabs= |rp2rg|; Williset al.
1991) between the correlations was relatively high (0.24– 0.46), this difference could be attributed to the sampling error ofrg. Kruuket al.(2008) repeated the analysis of Roff’s
1996 article with more recent data with an increased sample size, reaching similar conclusions.
The suitability of using phenotypic correlations as a proxy for genetic ones in various traits has been discussed by Hadfieldet al.(2007), concluding that while the conjecture may be true in traits with high heritability, particularly those related to growth, there are still exceptions and the conjec-ture most likely does not apply to all traits generally. Since phenotypic correlations depend both on the correlation of additive genetic and on the correlation of environmental ef-fects (with the term environmental representing any efef-fects that are not additive genetic), differences between pheno-typic and genetic correlations must be explained by the re-lationship between genetic and environmental effects. Cheverud (1984) suggests that most environmental effects often act in the same direction and through the same path-ways as genetic effects, which leads to a similarity between phenotypic and genetic correlations. Hadfieldet al.(2007), on the other hand, suggested that certain traits have environ-mental effects that act in the opposite direction to the genetic effects, which could reflect the conclusion of Roff (1996), who found lower correlation for life history and behavioral traits than morphological ones.
Despite the possible deficiencies of the conjecture when applied to nonmorphological traits, behavioral researchers
often assume that correlations between behaviors can give insight into the genetics behind the behavior. To test this assumption, Dochtermann (2011) tested the relationship be-tween published behavioral genetic and phenotypic correla-tions from animal studies. The author found that while the correlation between the phenotypic and genetic correlations was high (r= 0.86), the mean absolute difference between traits was also high (0.27), suggesting that phenotypic cor-relations were not a good predictor of genetic corcor-relations between behavioral traits. Dochtermann found that while not a good predictor, the phenotypic correlation is able to reliably provide information on the direction of the genetic effect for behavioral research, still allowing to make certain genetic conclusions based on phenotypic data.
To date, studies investigating the existence of Cheverud’s conjecture in specific populations have looked at morpholog-ical traits in insects (Roff 1995; Reusch and Blanckenhorn 1998), tamarins (Ackermann and Cheverud 2002), and plants (Waitt and Levin 1998), with results corroborating thefindings of Cheverud and Roff. While the conjecture has not been investigated in humans, it has been applied in hu-man modeling. As genetic data are not directly accessible in many ancient human populations, phenotypic traits have been used to make conclusions regarding genetic information (Relethford and Blangero 1990; Weaveret al.2007).
While the proportionality of phenotypic and genetic cor-relations has been assumed to be true in human populations, there has yet to be a study to investigate the conjecture in the context of humans. This study aims to fill the gap in un-derstanding how the conjecture applies in human popula-tions. Moreover, it aims to show whether human data differs from the results seen in animal and plant studies. Here,first we investigate the relationship between phenotypic and genetic correlations across 17 traits. We then investigate the relation-ship by considering two general types of traits: morphological traits and other (nonmorphological) traits. It was hypothe-sized that, similar to other species, genetic and phenotypic correlations are concordant in human traits, with a strong relationship particularly in morphological traits. Historically, the study of genetic correlations in humans has been limited by availability of data. This study uses genetic and phenotypic data, drawn from thefirst phase of the UK Biobank—a large sample of unrelated individuals (Sudlow et al.2015). This wealth of data allows a new look at Cheverud’s conjecture in the context of humans.
Methods
we selected Hapmap3 SNPs, with minor allele frequency.0.01, a Hardy–Weinberg equilibrium testP-value.1.0E26, and imputation info-score.0.3. The total sample was randomly split into two sets (n= 54,017 andn= 54,018), with no evidence for differences in demographic variables (Supple-mental Material, Supplementary Table 1). This allowed us to estimate genetic and phenotypic correlations within in each set, and also allowed estimation of genetic correlations between the two independent sets.
Traits with .10,000 observations in each dataset were selected for analysis. Selection of these traits included inspecting the distribution, and traits with drastically non-normal distributions were excluded. Key covariates and ex-clusion variables were identified for all traits. Exex-clusions were handled on a trait-by-trait basis. For example, subjects were excluded from analysis for spirometry traits if they had smoked within the last hour (see Table S2). The effects of sex, age, age2, and testing center were regressed out of the data using a linear model. Traits relating to the cardiovascular system had the effect of blood pressure medication regressed out (medication use was taken as a binary variable). Genet-ically derived principal components were also used as cova-riates, but only when calculating genetic correlations and not phenotypic ones. This was done to emulate a situation where genetic information is not available, which is where Cheverud’s conjecture is relevant. Finally, the residuals were trans-formed with a rank normal transformation (Van der Waerden transformation; Lehmann 1975).
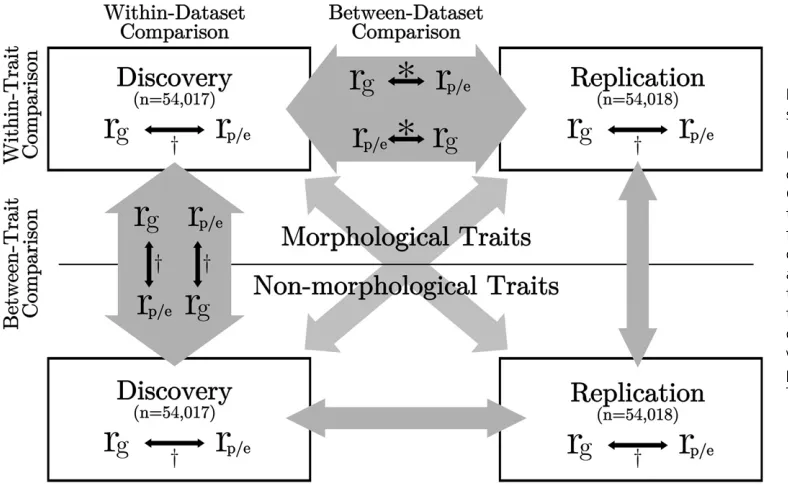
Phenotypic correlations were estimated as Pearson corre-lations between each pair of traits, within both discovery and replication datasets (Figure 1). A GWAS analysis was per-formed using PLINK 1.9 (Chang et al.2015) for each trait in discovery and replication samples separately, using a linear association model. The proportion of variance attribut-able to genome-wide SNPs (SNP-heritability) and the genetic
correlation attributable to genome-wide SNPs was estimated from the GWAS summary statistics using an LD-score regres-sion analysis as implemented by Bulik-Sullivanet al.(2015b) in the LDSC software package, using LD-scores estimated from the full data set. Briefly, genetic variances (or covari-ances) are estimated as a function of regressions of the square (or product) of association analysis z-statistics of SNPs for traits (or pairs of traits) on their LD scores, where an LD score is the sum of LDr2made by the SNP with all other SNPs. The method assumes that traits have a polygenic genetic archi-tecture. LD score estimates of genetic correlations agree well with those based on mixed model analysis of full individual-level genotype data (e.g., genetic restricted maximum likeli-hood (GREML) in genome-wide complex trait analysis (GCTA); Yanget al.2010; Leeet al.2012), but are achieved at a small fraction of computing resources, albeit with higher SE (Bulik-Sullivanet al.2015a; Niet al.2017). Traits with estimated SNP-heritability ,0.05 were removed, as the estimates of genetic correlation are unstable for traits with low SNP-heritability. Seventeen traits were used in the final analysis (Table 1), which were characterized as either morphological (n= 10) or nonmorphological (n= 7), thereby generating 45 pairwise correlations within the morphological traits, 21 between non-morphological traits and 70 correlations between-traits for each dataset. Genetic correlations were also estimated be-tween all pairs of traits bebe-tween the two datasets.
Pearson correlation coefficient, linear regression, and ab-solute disparity (Willis et al. 1991), were calculated for within-trait, between-trait, and all traits (combined) in both within-dataset and between-dataset comparisons (see Figure 1). The difference of the slope from the unity line was assessed by comparing the least squares linear regression to a linear model with a slope of one. Significance of the slope being different from one was set atP,0.003125, with Bonferroni correction for 16 tests.
Figure 1 Schematic diagram of statistical analyses performed. 108,035 British European individ-uals were evenly divided into dis-covery and replication datasets. Genetic and phenotypic correla-tions were calculated within group for 17 traits. Black arrows show the comparisons performed. Empty gray arrows indicate comparisons similar to the equivalent gray arrow (i.e., the within-replication, between-trait comparison is the same as the within-discovery, between-trait com-parison).*Figure 3, Table 2, andy
Comparisons of the environmental correlations (re)
and genetic correlations were also performed, where
re¼ rp2rG
ffiffiffiffiffiffiffiffiffiffi h2
1h 2 2
q ffiffiffiffiffiffiffiffiffiffiffiffiffiffiffiffiffiffiffiffiffiffiffiffiffiffiffiffiffiffiffiffiffiffi ð12h2
1Þð12h 2 2Þ
q
(Supplementary
Text 1). Similar analyses were performed as with the pheno-typic correlation, but using the environmental correlation in its place. The results of the analysis are shown in Supplemen-tary Figure 1 and SupplemenSupplemen-tary Table 3.
Finally, in sensitivity analyses to assess the similarity of the structure of the matrices, various matrix similarity tests were applied, as discussed by Roffet al.(2012). It is suggested that a variety of these tests should be used, as it is possible that they are not all sensitive to the same differences between matrices. The random skewers,T-test andT2-test, and mod-ified Mantel test were applied to compare phenotypic and genetic correlations. The random skewers method investi-gates whether two matrices respond similarly to selection (Cheverud and Marroig 2007), theT-test andT2-test consider the equality by examining the sum of the absolute difference or squared difference between matrix elements, and the mod-ified Mantel test looks at the correlation between the matrix elements. Results for each of the tests are shown in Supple-mentary Table 4.
Given the sample sizes available, phenotypic correlations were estimated with high accuracy. There is no current liter-ature on the expected SE or power from LD score regression; however, it can be compared to those expected from the linear mixed model maximum likelihood method (GREML), which estimates SNP-heritabilities and genetic correlations from GWAS genotype data (Visscheret al.2014). Empirical com-parisons have shown that the error associated with using LD score regression is50% larger than that of GREML (Niet al.
2017). Using the GCTA-GREML power calculator developed by Visscheret al.(2014), the trait with the smallest sample size (heel bone density,n= 31,254/31,174) has a power of “0.99”to detect the heritability cutoff of 0.05, with a SE of 0.0101. The pair of traits with lowest sample size (heel bone density and forced vital capacity) had a power of 0.98, and a SE of 0.0219 to detect the genetic correlation of20.089, as estimated by LDSC. In comparison, the observed SE from
LDSC was 0.051, a little more than double that predicted for bivariate GREML, although still relatively low. Hence, we conclude that the UK Biobank Pilot data are well powered for the analyses conducted.
Data availability
The authors state that all data necessary for confirming the conclusions presented in the manuscript are represented fully within the manuscript. Supplemental material available at Figshare:https://doi.org/10.25386/genetics.6213968.
Results
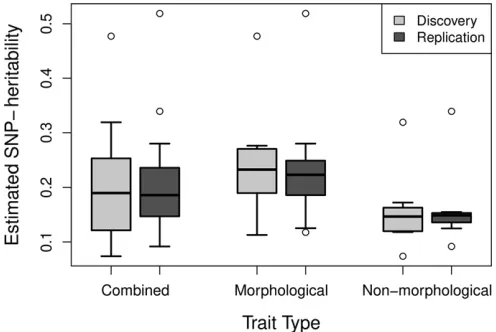
Across all traits the estimated SNP-heritabilities ranged from 0.073 to 0.52, with a mean of 0.20 (Figure 2). The SE of the heritability estimates reflected the sample sizes and ranged from 0.009 to 0.042. Morphological traits had a higher aver-age estimated SNP-heritability (0.23) than nonmorphologi-cal traits (0.16), but the difference was not significant (P= 0.22). The Pearson correlation coefficients between the phe-notypic and genetic correlations for the combined compari-son of all 17 traits werer= 0.97 andr= 0.96 for each of the between-dataset comparisons (Table 2). The least squares linear regression coefficient was significantly different from the unity line when considering all traits combined; however, it was not significant when considering only morphological or nonmorphological traits (Table 2). The mean difference be-tween correlations was 0.06 in both cases, calculated using the method described by Willis et al.(1991) and described earlier (Dabs = |rp 2rg|). This difference was not
signifi-cantly different from 0 for both discovery and replication datasets. The maximum difference between two correlations was 0.24 and the minimum was 0.0004. On average, the magnitude of genetic correlations was 0.04 higher than phe-notypic ones.
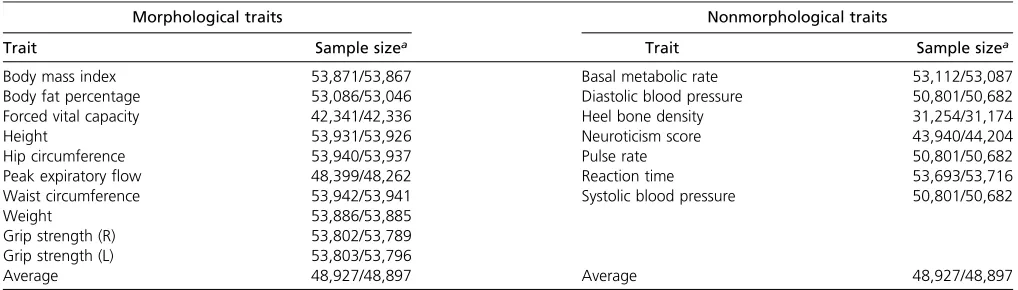
Comparison between morphological and nonmorpholog-ical traits showed some general differences between the two types of traits. Both types of traits had strong positive corre-lations across both datasets (betweenr= 0.92 andr= 0.97, Table 2). However, the distribution of correlations was dif-ferent between the two groups: morphological traits were Table 1 Final list of traits used in study with corresponding sample size for both discovery and replication samples
Morphological traits Nonmorphological traits
Trait Sample sizea Trait Sample sizea
Body mass index 53,871/53,867 Basal metabolic rate 53,112/53,087
Body fat percentage 53,086/53,046 Diastolic blood pressure 50,801/50,682
Forced vital capacity 42,341/42,336 Heel bone density 31,254/31,174
Height 53,931/53,926 Neuroticism score 43,940/44,204
Hip circumference 53,940/53,937 Pulse rate 50,801/50,682
Peak expiratoryflow 48,399/48,262 Reaction time 53,693/53,716
Waist circumference 53,942/53,941 Systolic blood pressure 50,801/50,682
Weight 53,886/53,885
Grip strength (R) 53,802/53,789
Grip strength (L) 53,803/53,796
Average 48,927/48,897 Average 48,927/48,897
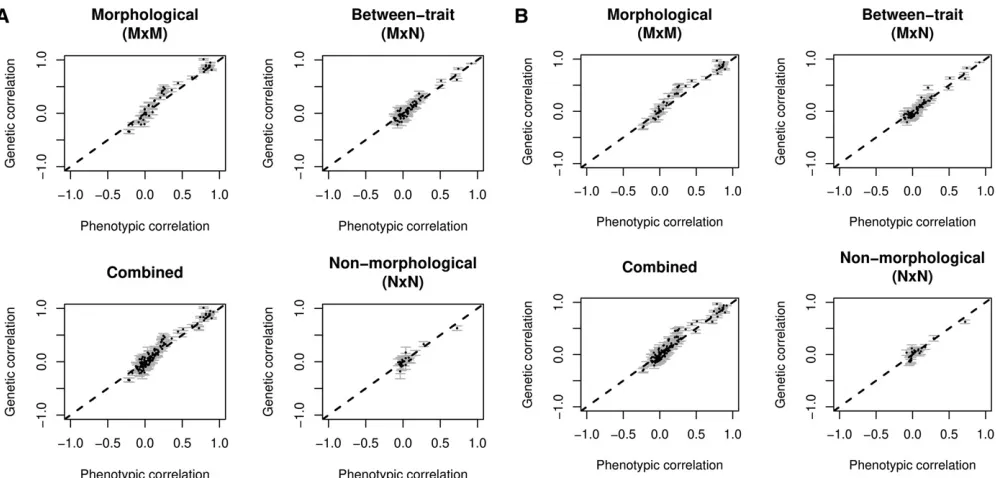
normally distributed with a range of genetic and phenotypic correlations (between 0 and 1) while distribution of the non-morphological trait correlations was right-hand skewed with a mean closer to 0 (Figure 3). In both sets of traits, however, least squares linear regression was not significantly different from the unity line. The mean absolute disparity between correlations ranged between 0.05 and 0.09 (Table 2). Very similar results to those above were seen in within-dataset analysis (Table 3). None of the parameters changed appre-ciably, and any differences were lost when rounding values. Repeating the same analysis with environmental correla-tion showed a similar result, albeit with slightly lower levels of correlation (r= 0.90–0.96), and slightly higher mean
abso-lute disparity (0.06–0.11). Of note, nonmorphological com-parisons were lower than the morphological comparison for the within-trait correlation in the discovery dataset. Full re-sults can be found in Supplementary Table 3.
Comparison between the phenotypic and genetic correla-tions using the random skewers method hadP-values of 1.0 for all comparisons, giving no evidence to reject the null hypothesis (Supplementary Table 4). Both theT-test andT2-test comparisons showed no overall difference between the
off-diagonal elements of the matrices, and the modified Mantel test had aP-value of 1.0, supporting the null hy-pothesis of correlation between the matrix elements (Roffet al.
2012). Plots of difference in correlationvs.mean heritability and mean sample size, as well as SEvs.mean heritability and mean sample size can be found in Supplementary Figure 2.
Discussion
The aim of this study was to investigate the relationship between genetic and phenotypic correlations in humans using data from large samples of unrelated individuals (i.e., very distantly related) from the UK Biobank. Based on reports from other species, we hypothesized a strong correlation between genetic and phenotypic correlations but with a stronger correlation between morphological than non-morphological traits. Our analyses confirmed these hypoth-eses, but it is notable that the phenotypic and genetic correlations between nonmorphological traits, while often different from zero, were smaller than those between mor-phological traits. High Pearson correlation coefficients were seen across both of the between-dataset comparisons (0.92– 0.97), as well as in within-dataset correlations (0.93–0.97) (Table 2 and Table 3). Thesefindings indicate that the results are reproducible in independent samples, and more practi-cally, that overall the phenotypic correlations from one group are good predictors of genetic correlations in an independent sample of the same ethnicity. The mean absolute disparity between the combined phenotypic and genetic correlations was not significantly different from zero in both between-dataset comparisons (Table 2), as well as in within-between-dataset comparisons (Table 3). These values support the conclusion of Roff (1996) and Kruuket al.(2008), who suggested that their reported differences (0.24–0.46 and 0.245, respec-tively) are a reflection of sampling error of rg. The mean
absolute disparity in our study is much lower, reflecting the larger sample sizes lowering the sampling error ofrg.
Addi-tionally, application of the random skewers, T-test,T2-test, and modified Mantel test methods (Cheverud and Marroig 2007; Roffet al.2012) indicated similar structure between the covariance matrices (Supplementary Table 4). In conclu-sion, these results confirm the prior assumptions used in anthropometric studies. Just as is true in other species, Figure 2 Boxplots of the distribution of estimated SNP-heritabilities for all
traits (combined, 17 traits), morphological traits (10 traits), and nonmor-phological traits (seven traits). Quantitative traits were selected from the UK Biobank and SNP-heritabilities estimated through LD score regression. Sample sizes used to calculate SNP-heritabilities range from 31,174 to 53,942 individuals.
Table 2 Summary statistics of least squares linear regression between-dataset phenotypic and genetic correlations for all traits (combined), morphological traits, and nonmorphological traits
Discovery genetic, replication phenotypic Discovery phenotypic, replication genetic
Trait r Slope Intercept AverageDabsa r Slope Intercept AverageDabsa
Morphological 0.97b(0.03) 1.08c 0.01 0.09 (0.04) 0.97b(0.03) 1.03 0.04 0.08 (0.04)
Nonmorphological 0.93b(0.06) 0.92 20.01 0.06 (0.07) 0.93b(0.06) 0.90 0.00 0.05 (0.06)
Morphological/nonmorphological 0.96b(0.03) 1.08 20.01 0.05 (0.05) 0.96b(0.03) 1.10 20.03 0.05 (0.05)
Combined 0.97b(0.02) 1.09c 20.01 0.06 (0.05) 0.97b(0.02) 1.07c 0.00 0.06 (0.05) Table headings indicate which correlations are being compared between the groups.
aAverage of absolute disparity.
phenotypic correlations are good proxies for genetic correla-tions in human traits.
Comparison between morphological and nonmorpholog-ical traits showed little difference between the two in terms of the relationship between phenotypic and genetic correlations, although there was a difference in the average magnitude of the correlations (mean magnitude of genetic correlations between morphological traits was 0.39 (SE = 0.04) and between nonmorphological traits was 0.11(SE = 0.07, dif-ferenceP= 531025). While the correlation coefficient of the morphological within-trait, between-dataset comparison (r= 0.97/0.97, Table 2) was higher than that of the non-morphological comparison (r= 0.93/0.92, Table 2), this was not a significant difference. Thisfinding was also true in the within-dataset comparisons. It is possible that this difference in correlation is driven by the difference in SNP-heritability (Figure 2), and thus accuracy of rg estimation. However,
while geometric mean heritability of the pair of traits and the SE ofrgis negatively correlated (Supplementary Figure
2), this is not true between the mean heritability and the difference between the phenotypic and genetic correlations (Supplementary Figure 2). This would suggest that the dif-ference in SNP-heritability between the traits does not play a major role in the differences between phenotypic and genetic correlations, and thus does not contribute to the differences between morphological and nonmorphological traits seen in this study. The between-trait, between-dataset comparison showed high correlation between the two types of traits (Fig-ure 3 and Table 2). It is worth noting that the strong overall
assumption of our approach is that the genetic correlations estimated from genome-wide SNP data are representative of the genetic correlations of variants across the allelic spec-trum, but this seems to be a reasonable assumption. For ex-ample, the genetic correlation estimate calculated in this paper between body mass index and body fat percent-age was 0.86, consistent with estimates from twin studies (Faithet al.1999). Another example is the correlation between systolic blood pressure and body mass index, which was 0.21 in this study, consistent with twin studies (Cuiet al.2002).
The biological mechanism for the expected difference be-tween types of traits discussed by Waitt and Levin (1998) is that of phenotypic plasticity—additive environmental effects on a trait. One of the criticisms of Cheverud’s conjecture by Willis et al.(1991) was that most of the data used in the original article came from laboratory grown animals, leading to an underestimation of the environmental effects, which would be found in nature. Cheverud (1984) suggested that environmental and genetic effects are governed by the same developmental constraints and thus should have similar pat-terns, decreasing the effect on the correlation between traits. Hadfieldet al.(2007), on the other hand, suggested that for certain groups of traits, the genetic and environmental effects act in opposing directions, decreasing correlation. In this study, rgand re were positively correlated (r= 0.90–0.96,
Supplementary Table 3), suggesting that the genetic and en-vironmental effects have similar correlational patterns. This provides support for Cheverud’s suggestion, and overcomes the “underestimation of environmental effects” argument posed by Williset al.(1991), as the UK Biobank is a popula-tion-based community sample. However, in the case of non-morphological traits, it may also indicate that our sample of traits is not fully representative of the whole spectrum.
When calculating the genetic correlations, many covariates were used to best estimate the value ofrg, including
geneti-cally derived principal components. To simulate a scenario where no genetic information is available, phenotypic corre-lations did not include covariates that contained genetic in-formation. Instead, they were limited to covariates that would have been available without such information (age, age2, sex, and location). When these covariates were not accounted for, the mean absolute disparity ranged between 0.06 and 0.20 (Supplementary Table 5), higher than when
covariates are accounted for (Table 2 and Table 3). While the disparity without covariates is still quite low compared to prior literature, thisfinding indicates that environmental ef-fects do play a role in modulating the phenotypic correlation, as suggested by phenotypic plasticity. Thus, it is important to account for some of the major confounding effects when using phenotypic correlations to estimate genetic ones, although in some studies confounding factors may not be recorded.
The results of this study are of specific interest in anthro-pological studies where anthropometric measurements are used as a proxy for genetic information. The results presented show support for this approximation in human studies, al-though care should be taken when extrapolating the results of this study to other populations and environmental contexts, such as in ancient human populations subject to anthropo-logical studies. The evidence provided here is based on ob-servations in modern human populations, which may differ from earlier human populations. For example, large-scale famine and infections would have often affected earlier hu-man populations, but are less of an issue for modern Euro-peans. Despite this, it is often already assumed that the phenotypic and genetic variance-covariance matrices are pro-portional between modern humans and even Neanderthals (Weaveret al.2007). Another caveat is that the morphological traits used in this study differ from those used in anthropomet-ric studies. Nonetheless, the evidence from this study suggests that morphological traits do appear tofit Cheverud’s conjec-ture well, supporting its use in these kinds of traits.
In conclusion, this study investigated Cheverud’s conjec-ture in the context of human genetics. Correlations calculated using LD score regression utilizing data from the UK Biobank support the validity of the conjecture in human populations. This study provides the quantitative evidence to support the use of phenotypic correlations as a proxy for genetic correla-tions in studies where genetic information is not available.
Acknowledgments
We thank Katarina McGuigan for providing feedback on this work. This research has been conducted using the UK Biobank Resource under project 12514. We acknowledge funding from the National Health and Medical Research Table 3 Summary statistics of least squares linear regression of within-dataset phenotypic and genetic correlations for morphological traits, nonmorphological traits, between-trait and all traits (combined) in both the discovery and replication samples
Discovery Replication
Trait r Slope Intercept AverageDabsa r Slope Intercept AverageDabsa
Morphological 0.97b(0.03) 1.09c 0.01 0.09 (0.04) 0.97b(0.03) 1.03 0.04 0.08 (0.04)
Nonmorphological 0.93b(0.06) 0.92 20.01 0.05 (0.07) 0.92b(0.06) 0.89 0.00 0.05 (0.06)
Morphological/nonmorphological 0.96b(0.03) 1.07 20.01 0.05 (0.05) 0.96b(0.04) 1.10 20.03 0.06 (0.05) Combined 0.97b(0.02) 1.09c 20.01 0.06 (0.05) 0.96b(0.02) 1.07c 0.00 0.06 (0.05) Table headings indicate which correlations are being compared between the groups.
aAverage of absolute disparity.
Council (grants 1078901, 1087889, 1113400, 1103418) and the Australian Research Council (ARC) Discovery Proj-ect (DP160103860).
Literature Cited
Ackermann, R. R., and J. M. Cheverud, 2002 Discerning evolu-tionary processes in patterns of tamarin (genus saguinus) cra-niofacial variation. Am. J. Phys. Anthropol. 117: 260–271. https://doi.org/10.1002/ajpa.10038
Bulik-Sullivan, B., H. K. Finucane, V. Anttila, A. Gusev, F. R. Day et al., 2015a An atlas of genetic correlations across human diseases and traits. Nat. Genet. 47: 1236–1241. https://doi. org/10.1038/ng.3406
Bulik-Sullivan, B. K., P.-R. Loh, H. K. Finucane, S. Ripke, J. Yang et al., 2015b Ld score regression distinguishes confounding from polygenicity in genome-wide association studies. Nat. Genet. 47: 291–295.https://doi.org/10.1038/ng.3211 Chang, C. C., C. C. Chow, L. C. Tellier, S. Vattikuti, S. M. Purcell
et al., 2015 Second-generation plink: rising to the challenge of larger and richer datasets. Gigascience 4: 7.
Cheverud, J. M., 1984 Quantitative genetics and developmental constraints on evolution by selection. J. Theor. Biol. 110: 155– 171.https://doi.org/10.1016/S0022-5193(84)80050-8 Cheverud, J. M., 1988 A comparison of genetic and phenotypic
correlations. Evolution 42: 958–968.https://doi.org/10.1111/ j.1558-5646.1988.tb02514.x
Cheverud, J. M., and G. Marroig, 2007 Research article compar-ing covariance matrices: random skewers method compared to the common principal components model. Genet. Mol. Biol. 30: 461–469.https://doi.org/10.1590/S1415-47572007000300027 Cui, J., J. L. Hopper, and S. B. Harrap, 2002 Genes and family
environment explain correlations between blood pressure and body mass index. Hypertension 40: 7–12.https://doi.org/ 10.1161/01.HYP.0000022693.11752.E9
Dochtermann, N. A., 2011 Testing cheverud’s conjecture for be-havioral correlations and bebe-havioral syndromes. Evolution 65: 1814–1820.https://doi.org/10.1111/j.1558-5646.2011.01264.x Faith, M. S., A. Pietrobelli, C. Nuñez, M. Heo, S. B. Heymsfield et al., 1999 Evidence for independent genetic influences on fat mass and body mass index in a pediatric twin sample. Pedi-atrics 104: 61–67.https://doi.org/10.1542/peds.104.1.61 Hadfield, J. D., A. Nutall, D. Osorio, and I. P. F. Owens, 2007 Testing
the phenotypic gambit: phenotypic, genetic and environmental cor-relations of colour. J. Evol. Biol. 20: 549–557. https://doi.org/ 10.1111/j.1420-9101.2006.01262.x
Henderson, C. R., 1986 Recent developments in variance and co-variance estimation. J. Anim. Sci. 63: 208–216.https://doi.org/ 10.2527/jas1986.631208x
Kruuk, L. E. B., J. Slate, and A. J. Wilson, 2008 New answers for old questions: the evolutionary quantitative genetics of wild animal populations. Annu. Rev. Ecol. Evol. Syst. 39: 525–548. https://doi.org/10.1146/annurev.ecolsys.39.110707.173542 Lee, S. H., J. Yang, M. E. Goddard, P. M. Visscher, and N. R. Wray,
2012 Estimation of pleiotropy between complex diseases using single-nucleotide polymorphism-derived genomic relationships
and restricted maximum likelihood. Bioinformatics 28: 2540– 2542.https://doi.org/10.1093/bioinformatics/bts474
Lehmann, E. L., 1975 Nonparametrics: Statistical Methods Based on Ranks. Holden-Day, San Francisco.
Lynch, M., and B. Walsh, 1998 Genetics and Analysis of Quantita-tive Traits. Sinauer Associates, Sunderland, MA.
Ni, G., G. Moser Schizophrenia Working Group of the Psychiatric GenN. R. Wray, and S. H. Lee, 2017 Estimation of genetic correlation using linkage disequilibrium score regression and genomic restricted maximum likelihood. Am. J. Human Gen. Available at:https://doi.org/10.1016/j.ajhg.2018.03.021. Relethford, J. H., and J. Blangero, 1990 Detection of differential gene
flow from patterns of quantitative variation. Hum. Biol. 62: 5–25. Reusch, T., and W. U. Blanckenhorn, 1998 Quantitative genetics of the dungfly sepsis cynipsea: cheverud’s conjecture revisited. Heredity 81: 111–119.https://doi.org/10.1046/j.1365-2540.1998.00368.x Robertson, A., 1959 The sampling variance of the genetic
corre-lation coefficient. Biometrics 15: 469–485.https://doi.org/ 10.2307/2527750
Robinson, M. R., A. Kleinman, M. Graff, A. A. Vinkhuyzen, D. Couper et al., 2017 Genetic evidence of assortative mating in humans. Nat. Hum. Behav. 1: 0016.https://doi.org/10.1038/s41562-016-0016 Roff, D. A., 1995 The estimation of genetic correlations from
phe-notypic correlations - a test of cheveruds conjecture. Heredity 74: 481–490.https://doi.org/10.1038/hdy.1995.68
Roff, D. A., 1996 The evolution of genetic correlations: an analy-sis of patterns. Evolution 50: 1392–1403. https://doi.org/ 10.1111/j.1558-5646.1996.tb03913.x
Roff, D. A., J. M. Prokkola, I. Krams, and M. J. Rantala, 2012 There is more than one way to skin a g matrix. J. Evol. Biol. 25: 1113– 1126.https://doi.org/10.1111/j.1420-9101.2012.02500.x Sudlow, C., J. Gallacher, N. Allen, V. Beral, P. Burton et al.,
2015 Uk biobank: an open access resource for identifying the causes of a wide range of complex diseases of middle and old age. PLoS Med. 12: e1001779.
Via, S., and D. J. Hawthorne, 2005 Back to the future: genetic correlations, adaptation and speciation. Genetica 123: 147–156. https://doi.org/10.1007/s10709-004-2731-y
Visscher, P. M., G. Hemani, A. A. E. Vinkhuyzen, G.-B. Chen, S. H. Lee et al., 2014 Statistical power to detect genetic (co)variance of complex traits using snp data in unrelated samples. PLoS Genet. 10: e1004269.https://doi.org/10.1371/journal.pgen.1004269 Waitt, D. E., and D. A. Levin, 1998 Genetic and phenotypic
correla-tions in plants: a botanical test of cheverud’s conjecture. Heredity 80: 310–319.https://doi.org/10.1046/j.1365-2540.1998.00298.x Weaver, T. D., C. C. Roseman, and C. B. Stringer, 2007 Were neandertal and modern human cranial differences produced by natural selection or genetic drift? J. Hum. Evol. 53: 135– 145.https://doi.org/10.1016/j.jhevol.2007.03.001
Willis, J. H., J. A. Coyne, and M. Kirkpatrick, 1991 Can one predict the evolution of quantitative characters without genetics. Evolution 45: 441–444.https://doi.org/10.1111/j.1558-5646.1991.tb04418.x Yang, J., B. Benyamin, B. P. McEvoy, S. Gordon, A. K. Henderset al.,
2010 Common snps explain a large proportion of the heritability for human height. Nat. Genet. 42: 565–569.https://doi.org/ 10.1038/ng.608