Pushover Analysis on Non Linear Behavior of Rcc Frame
Appayagari Srinivas & Dr.Md.Subhan
1M.Tech (Structural Engineering) AVN Institute of engineering and technology.
2Professor & HOD (Civil engineering Department) AVN Institute of engineering and technology.
ABSTRACT:-To model the complex behavior of reinforced concrete analytically in its non-linear zone is difficult. This has led engineers in the past to rely heavily on empirical formulas which were derived from numerous experiments for the design of reinforced concrete structures. For structural design and assessment of reinforced concrete members, the non-linear analysis has become an important tool. The method can be used to study the behavior of reinforced concrete structures including force redistribution.
This analysis of the nonlinear response of RC structures to be carried out in as per ATC 40 or FEMA 273. It helps in the investigation of the behavior of the structure under different loading conditions, its load deflection behavior and the cracks pattern. In the present study, Pushover analysis on RCC frames using ETABS with and without vertical irregularity under the loading has been carried out. The intention is to investigate the relative importance of several factors in the non-linear analysis of RCC frame models and compare the results. This includes the variation in load
displacement graph i.e. Pushover curve,
Storeyshears, Inter storey drifts, Lateral displacements, Hinge properties, Performance point.
INTRODUCTION:-
Performance Based Seismic DesignSeismic hazard in the context of engineering design is generally defined as the predicted level of ground acceleration which would be exceeded with 10% probability at the site under consideration due to the occurrence of an earthquake anywhere in the region, in the next 50 years. A lot of complex scientific perception and analytical modeling is involved in seismic hazard estimation. A computational scheme involves the following steps: delineation of seismic source zones and their characterization, selection of an appropriate ground motion attenuation relation and a predictive model of seismic hazard. Although these steps are region specific, certain standardization of the approaches is highly essential so that reasonably comparable estimates of seismic hazard can be made worldwide, which
are consistent across the regional boundaries .As it is well known, earthquake catalogues and data bases make the first essential input for the delineation of seismic source zones and their characterization.Thus, preparation of a homogeneous catalogue for a region under consideration is an important task. The data from historic time to recent can broadly be divided into three temporal categories:
1. Since 1964, for which modern instrumentation based data are available 2. 1900-1963, the era of early instrumental
data, and
3. Pre 1900, consisting of pre-instrumental data,
Fig.1.1.Performance-Based Design Flow Diagram (ATC, 1997a
Purpose of Doing Pushover Analysis:-
The pushover is expected to provide information on many response characteristics
that cannot be obtained from an elastic static or dynamic analysis. The following are the examples of such response characteristics:
The realistic force demands on potentially brittle elements, such as axial force demands on columns, force demands on brace connections, moment demands on beam to column connections, shear force demands in reinforced concrete beams, etc.
Estimates of the deformations demands for elements that have to form in elastically in order to dissipate the energy imparted to the structure consequences of the strength deterioration of individual elements on behavior elements on behavior of structural system.
Identification of the critical regions in which the deformation demands are expected to be high and that have to become the focus through detailing. Identification of the strength
discontinuous in plan elevation that will lead to changes in the dynamic characteristics in elastic range.
Estimates of the inter story drifts that account for strength or stiffness discontinuities and that may be used to control the damages and to evaluate P-Delta effects.
Verification of the completeness and adequacy of load path, considering all
the elements of the structural systems, all the connections, and stiff non-structural elements of significant strength, and the foundation system. Different Hinge Properties in Pushover Analysis on Etabs:-
There are four types of hinge properties in ETABS. They are default hinge properties; user defined hinge properties and generated hinge properties. Only default hinge properties and user-defined hinge properties can be assigned to frame elements. When these hinge properties are assigned to a frame element, the program automatically creates a different generated hinge property for each and every hinge.
Default hinge properties cannot be modified. They also cannot be viewed because the default properties are section dependent. The default properties cannot be fully defined by the program until the section that they apply to is identified. Thus to see the effect of the default properties, the default property should be assigned to a frame element, and then the resulting generated hinge property should be viewed.
User-defined hinge properties can be either is based on default properties or they can be fully user-defined. When user-defined properties are based on default properties, the hinge properties cannot be viewed because, again, the default properties are section dependent. When user-defined properties are not based on default properties, then the properties can be viewed and modified.
The generated hinge properties are used in the analysis. They can be viewed, but they cannot be modified. Generated hinge properties have an automatic naming convention of LabelH#, where Label is the frame element label, H stands for hinge, and # represents the hinge number. The program starts with hinge number 1 and increments the hinge number by one for each consecutive hinge applied to the frame element. For example if a frame element label is F23, the generated hinge property name for the second hinge applied to the frame element is F23H2.
hinge properties are section dependent. Thus different frame section type in the model. This could be the main reason for the differentiation between defined properties (in this context, defined means both default and user-defined) and generated properties is that typically the hinge properties are section dependent. Thus different frame section type in the model. This could potentially mean that a very large number of hinge properties would need to be defined by the user.
In order to obtain performance points as well as the location of hinges in different stages, we can use the pushover curve. In this curve, the range AB being the elastic range, B to IO is the range of instant occupancy, IO to LS being the range of life safety and LS to CP being the range of collapse prevention.
Hingeproperties
PUSHOVER ANALYSIS
General:-Pushover Analysis option will allow
engineers to perform pushover analysis as per FEMA -356 and ATC-40. Pushover analysis is a static, nonlinear procedure using simplified nonlinear technique to estimate seismic structural deformations. It is an incremental static analysis used to determine the force-displacement relationship, or the capacity curve, for a structure or structural element. The analysis involves applying horizontal loads, in a prescribed pattern, to the structure incrementally, i.e. pushing the structure and plotting the total applied shear force and associated lateral displacement at each increment, until the structure or collapse condition. (sermin, 2005).
Pushover analysis is a technique by which a computer model of the building is subjected to a lateral load of a certain shape (i.e., inverted triangular or uniform). The intensity of the lateral
load is slowly increased and the sequence of cracks, yielding, plastic hinge formation, and failure of various structural components is recorded. Pushover analysis can provide a significant insight into the weak links in seismic performance of a structure. A series of iterations are usually required during which, the structural deficiencies observed in one iteration, are rectified and followed by another. This iterative analysis and design process continues until the design satisfies pre-established performance criteria. The performance criteria for pushover analysis are generally established as the desired state of the building given roof-top or spectral displacement amplitude.
Static Nonlinear Analysis technique, also known as sequential yield analysis, or simply “pushover” analysis has gained significant popularity during the past few years. It is the one of the three analysis techniques recommended by FEMA-273/274 and a main component of the Spectrum Capacity Analysis method (ATC-40). Proper application can provide valuable insights into the expected performance of structural systems and components. Misuse can lead to an erroneous understanding of the performance characteristics. Unfortunately, many in order to obtain useful results from such analysis. (Zou. et. al. 2005).
Methods of Analysis
For seismic performance evaluation, a structural analysis of the mathematical model of the structure is required to determine force and displacement demands in various components of the structure. Several analysis methods, both elastic and inelastic, are available to predict the seismic performance of the structures. (sermin, 2005).
Elastic Methods of Analysis
response spectrum by a structural system dependent force reduction factor, "R". In this approach, it is assumed that the actual strength of structure is higher than the design strength and the structure is able to dissipate energy through yielding. In code dynamic procedure, force demands on various components are determined by an elastic dynamic analysis. The dynamic analysis may be either a response spectrum analysis or an elastic time history analysis. Sufficient number of modes must be considered to have a mass participation of at least 90% for response spectrum analysis. Any effects of higher modes are automatically included in time history analysis. In demand/capacity ratio (DCR) procedure, the force actions are compared to corresponding capacities as demand/capacity ratios. Demands for DCR calculations must include gravity effects.
Inelastic Methods of Analysis:-
Structures suffer significant inelastic deformation under a strong earthquake and dynamic characteristics of the structure change with time so investigating the performance of a structure requires inelastic analytical procedures accounting for these features. Inelastic analytical procedures help to understand the actual behavior of structures by identifying failure modes and the potential for progressive collapse. Inelastic analysis procedure basically includes inelastic time history analysis and inelastic static analysis which is also known as pushover analysis.
Methods to Perform Non Linear Analysis: Available simplified nonlinear analysis methods, referred to as nonlinear static analysis procedures, include:
1. The capacity spectrum method (CSM) that uses the intersection of the capacity (pushover) curve and a reduced response spectrum to estimate maximum displacement
2. The displacement coefficient method (e.g., FEMA-273 (ATC1996) that uses pushover analysis and a modified version of the equal displacement approximation to estimate maximum displacement.
3. The secant method (e.g., City of Los Angeles, Division 95(COLA 1995») that uses a Substitute structure and secant stiffness’s.
Step by step procedure to determine Capacity:
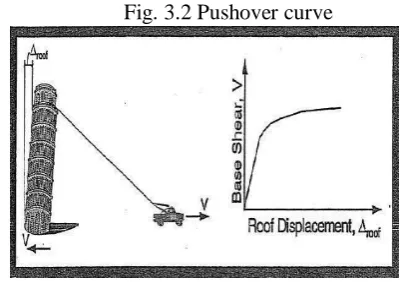
Structure capacity is represented by a pushover curve. The most convenient way to plot the force-displacement curve is by tracking the base shear and the roof displacement. Some nonlinear computer programs (e.g.DRAIN-2DX (Powell et. al. 1992)) are able to perform a pushover analysis directly, with no iteration required. The step by step method below does not apply if such programs are used. When a linear computer program (e.g., ETABS (CSI1995), SAP90 (CSI 1992), RlSA (RlSA 1993) is used, the following procedure can be used to construct a pushover curve.
Simply apply a single concentrated horizontal force at the top of the structure. (Would generally only apply to a one-story building.
Apply lateral forces to each story in proportion to the standard code procedure without the concentrated F, at the top (i.e. F= [wxhx/Lwxhx]V).
Apply lateral forces in proportion to the product ofstory masses and first mode shape of the elastic model of the structure(i.e.,F,= [wxlf>x/Lwxt/Jx]V). The capacity curve is generally constructed to represent the first mode response of the structure based on the assumption that the fundamental mode of vibration is the predominant response of the structure. This is generally valid for buildings with fundamental periods of vibration up to about one second.
Same as Level 3 until first yielding, for each increment beyond yielding, adjust the forces to be consistent with the changing deflected shape.
Adjust the lateral force level so that some (or group of. elements) is stressed to within 10 percent of its member strength.
Record the base shear and the roof displacement.
Revise the model using zero (or very small) stiffness for the yielding elements.
Apply a new increment of lateral load to the revised structure such that another element (or group of elements) yields.
Add the increment of lateral load and the corresponding increment of roof displacement to the previous totals to give the accumulated values of base shear and roof displacement.
Repeat steps 7, 8 and 9 until the structure reaches an ultimate limit, such as: instability from P-delta effects; distortions considerably beyond the desired performance level; an element (or group of elements) reaching a lateral deformation level at which loss of gravity load carrying capacity occurs.
Explicitly model global strength degradation..If the incremental loading was stopped in step10 as a result of reaching a lateral deformation level at which all or a significant portion of an element's (or group of elements) load can no longer be resisted, that is, its strength has degraded, then the stiffness of that element(s) is' reduced, or eliminated. A new capacity curve is then created, starting with step 3 of this step-by-step process. Create as many additional pushover curves as necessary to adequately define the overall loss of strength.
Fig. 3.2 Pushover curve
Conceptual Development of the Capacity Spectrum Method:
Conversion of the Capacity Curve to the Capacity Spectrum:
To use the capacity spectrum method it is necessary to convert the capacity curve, which is in terms of base shear and roof displacement to what is called a capacity spectrum, which is are presentation of the capacity curve in Acceleration-Displacement Response Spectra (ADRS) format (i.e., Saversus Sa). The required equations to make the transformation are:
Where:
PFl= modal participation factor for the first natural mode.
Wi /g = mass assigned to level i. ϕ = amplitude of mode 1 at level i.
N=level N, the level which is the uppermost in the main portion of the structure.
W = building dead weight plus likely live loads. Sa = spectral acceleration.
Sd = spectral displacement (Sa and the associated Sdmake up points on the capacity spectrum).
Droof =roof displacement (V and the Droof
associated make up points on the capacity curve). Limitations of Pushover Analysis
Although pushover analysis has advantages over elastic analysis procedures, underlying assumptions, the accuracy of pushover predictions and limitations of current pushover procedures must be identified. The estimate of target displacement, selection of lateral load patterns and identification of failure mechanisms due to higher modes of vibration are important issues that affect the accuracy of pushover results.
Target displacement is the global displacement expected in a design earthquake. The roof displacement at mass centre of the structure is used as target displacement. The accurate estimation of target displacement associated with specific performance objective affect the accuracy of seismic demand predictions of pushover analysis.
However, in pushover analysis, generally an invariant lateral load pattern is used that the distribution of inertia forces is assumed to be constant during earthquake and the deformed configuration of structure under the action of invariant lateral load pattern is expected to be similar to that experienced in design earthquake. As the response of structure, thus the capacity curve is very sensitive to the choice of lateral load distribution, selection of lateral load pattern is more critical than the accurate estimation of target displacement.
The lateral load patterns used in pushover analysis are proportional to product of story mass and displacement associated with a shape vector at the story under consideration. Commonly used lateral force patterns are uniform, elastic first mode, "code" distributions and a single concentrated horizontal force at the top of structure. Multi-modal load pattern
derived from Square Root of Sum of Squares (SRSS) story shears is also used to consider at least elastic higher mode effects for long period structures.
These loading patterns usually favour certain deformation modes that are triggered by the load pattern and miss others that are initiated and propagated by the ground motion and inelastic dynamic response characteristics of the structure. Moreover, invariant lateral load patterns could not predict potential failure modes due to middle or upper story mechanisms caused by higher mode effects. Invariant load patterns can provide adequate predictions if the structural response is not severely affected by higher modes and the structure has only a single load yielding mechanism that can be captured by an invariant load pattern.
FEMA-273 recommends utilising at least two fixed load patterns that form upper and lower bounds for inertia force distributions to predict likely variations on overall structural behavior and local demands. The first pattern should be uniform load distribution and the other should be "code" profile or multi-modal load pattern. The 'Code' lateral load pattern is allowed if more than 75% of the total mass participates in the fundamental load. The invariant load patterns cannot account for the redistribution of inertia forces due to progressive yielding and resulting changes in dynamic properties of the structure. Also, fixed load patterns have limited capability to predict higher mode effects in post-elastic range. These limitations have led many researchers to propose adaptive load patterns which consider the changes in inertia forces with the level of inelasticity. The underlying approach of this technique is to redistribute the lateral load shape with the extent of inelastic deformations. Although some improved predictions have been obtained from adaptive load patterns, they make pushover analysis computationally demanding and conceptually complicated. The scale of improvement has been a subject of discussion that simple invariant load patterns are widely preferred at the expense of accuracy. Whether lateral loading is invariant or adaptive, it is applied to the structure statically that a static loading cannot represent inelastic dynamic response with a large degree of accuracy.
Three six storied structure are modeled using ETABS software. Model01 is a regular structure; Model02 & Model03 are irregular structures with vertical irregularities. The percentages of vertical irregularity for Mo del02 & Model03 are modeled as per codal provisions (IS: 1893-1(2002)) [47] table5. Table.01 Percentage Of Vertical Irregularity
SR.NO DESIGNATION
TYPE OF FRAME
PERCENTAGE OF
RREGULARITY
1 Model01 Regular - 2 Model02 Irregular 400% 3 Model03 Irregular 533% CONCLUSIONSAND RECOMMENDATIONS The main observations and conclusions drawn are summarized below:
1. The performance point of the regular structure i.e. Model01 shows high performance 1411.11kN when compared to Model 02 1294.984kN and Model 03 1253.385kNwhich have vertical irregularity.
2. The displacement of the regular structure Mole 01 is less when compared to Model 02 & Model 03.The regular frame shows the displacement of 0.098m but due to vertical irregularity it reduces to 0.100 m for 400% irregularity Model02 & 0.103m for 533% irregularity Model 03.
3. The change in percentage of vertical irregularity also cause change in storey shear as the regular frame shows the storey shear of 327.78 kN at the base, but due to change in vertical irregularity it reduces to 226.34 kN for 400% irregularity and 242.41kN for 533% irregularity.
From the above discussion, the seismic performance of the irregular building is reduces by 8-9% for 400% vertical irregularity and 11-12% for 533% vertical irregularity when compared to symmetric base model.
6.2 Recommendations
The literature review and analysis procedure utilized in this thesis has provided useful insight for future application of ETABS for analysis. It helps in comparing the results with regular and irregular structures.
6.3 Future ScopeIn the present study frame has been studied under monotonic loads. The frame can be studied under cyclic-loading to monitor
the variation in load-deflection curves at given time history.
References
[1]. ATC, NEHRP Guidelines for the Seismic Rehabilitation of Buildings, FEMA 273 Report, prepared by the Applied Technology Council for the Building Seismic Safety Council, published by the Federal Emergency Management Agency, Washington, D.C. 1997 a.
[2]. KonuralpGirgin And KutluDarilmaz (December 2007) Sesimic Response Of Infilled Framed Buildings Using Pushover Analysis. Department Of Civil Engineering, Istanbul, Turkey
VOLUME54, NUMBER5. 5
December2007
[3]. Chung- Yue Wang and Shaing-Yung Ho. Pushover Analysis for Structure Containing RCWalls. The 2nd International Conference on Urban Disaster Reduction, Taipei, Taiwan. November, 27-29, 2007.
[4]. Dhileep. M, Trivedi. A, Bose. P.R. Behavior of high frequency modal responses in non linear seismic analysis.International Journal of Civil and Structural Engineering. Volume 1, No. 4, 2011.
[5]. Oscar Möller, Ricardo O. Foschi, Laura M. Quiroz, Marcelo Rubinste in. Structural optimization for performance-based design in earthquake engineering: Applications of neural networks. Structural Safety 31, 490-499. (2009).
[6]. Moehle JP, Mahin SA. Observations on the behavior of reinforced concrete buildings during earthquakes. In: Ghosh SK, editor. Earthquake-resistant concrete structures— inelastic response and design. American Concrete Institute SP-127; 1991.
[7]. Kabeyasawa, T. "Ultimate-State Design of Wall-Frame Structures," Earthquake Resistance of Reinforced Concrete Structures; a Volume Honoring Hiroyuki Aoyama,
[9]. Whittaker A, Constantnou M, Tsopelas P. Displacement estimates for performance-based seismic design. J Structure Div, ASCE; 124 (8):905-912, (2007).