Two Level Diagnosis of Breast Cancer Using
Data Mining
Rajkamal kaur Grewal Babita Pandey
Department of computer application Department of computer applicationPhagwara, Punjab Phagwara, Punjab
Lovely Professional University Lovely Professional University
ABSTRACT
Breast Cancer is a dreadful disease. Mostly women affected with breast cancer disease. Mainly problem in medical science is to diagnosis of breast cancer at early stage. So the early detection of breast cancer is important for saving life. In this work, develop method for diagnosis of breast cancer at two levels.At the first level diagnosis is based Wisconsin Breast Cancer dataset (pathological test result) and classified into malignant and benign class. At the second level diagnosis based on pathological and physiological parameters of malignant breast cancer dataset and classified into five breast cancer disease as: Ductal Carcinoma in Situ(DCIS), Lobular Carcinoma in Situ(LCIS), Invasive Ductal Carcinoma(IDC), Invasive Lobular Carcinoma(ILC) and Mucinous Carcinoma(MC). In this paper evaluate the performance based on correct and incorrect element of data classification using J48 classification algorithm. The experiment result shows that classification accuracy, sensitivity and specificity of J48 is good.
Keywords
Breast cancer, J48 decision tree, WEKA, Classification, ROC Curve.
1.
INTRODUCTION
Cancer is a harmful type of diseases that causes the cells in a part of body start to grow out of control. The cancer's cell growth is different from normal cell growth and finally the cancer cell becomes a tumor.[7] Breast cancer is a tumor related disease. The initial detection of breast cancer is needed for saving life of people. But the early diagnosis needed accurate and reliable diagnosis technique that allow physician to distinguish malignant tumor from the benign tumor and distinguish the different malignant breast cancer type as: Ductal Carcinoma in Situ (DCIS), Lobular Carcinoma in Situ (LCIS), Invasive Ductal Carcinoma(IDC), Invasive Lobular Carcinoma(ILC) and Mucinous Carcinoma(MC)[15].
Data mining (DM) is known as knowledge discovery that extract and discover hidden features. The data mining have been widely used in prediction, mainly in medical diagnosis [5]. The Data mining function classified as classification, clustering, feature selection and associating mining [14]. In this work data classification function applied and calculate the performance of classifier algorithm with True positive rate, False positive rate that generated after applied the J48 algorithm on the breast cancer dataset.
A lot of work has been done for diagnosis of breast cancer but nobody has classified it at two levels.This paper presents the data mining (J48) classifier that applied on breast cancer dataset at two levels. At the first level diagnosis is based Wisconsin Breast Cancer dataset (pathological test result) and classified into malignant and benign class. At the second level
diagnosis based on pathological and physiological parameters of malignant breast cancer dataset (collect from hospital) and classified into five breast cancer disease as: Ductal Carcinoma in Situ(DCIS), Lobular Carcinoma in Situ(LCIS), Invasive Ductal Carcinoma(IDC), Invasive Lobular Carcinoma(ILC)[10] and Mucinous Carcinoma (MC).
The rest of this paper is organized as follow: section 2 describes two level diagnosis of breast cancer. Section 3 deals with experimental work and result. The conclusions are given in section 4.
2. TWO LEVEL DIAGNOSIS OF
BREAST CANCER
The diagnosis of breast cancer is done at two levels.
2.1 At the First level diagnosis
The J48 classifier is a Quinlan‟s C4.5 decision tree which is develop from a set of labeled training data and permit classification by decision tree or rules produced from them [6].
Table1: Detail of Dataset
Each attribute of the data can be used to make a decision by dividing the data into subsets and leaf nodes defining the final class. While creating tree, it ignores the missing values
and handle the continuous and discrete attributes [7]. At the first level, Wisconsin breast cancer(WBC) dataset
used that provided by the University of Wisconsin Hospital based on microscopic examination of breast masses with the fine needle aspirate tests[8]. The Wisconsin breast cancer(WBC) dataset consists of 699 patient records with nine parameters. The nine pathological parameters are: Clump Thickness (CT), Uniformity of cell size (CS), Uniformity of
Attributes
Data type
Cellularity Categorical(High, Medium, Low) Marginal
Adhesion
Categorical(High, Medium, Low)
Epithelial Cell Size
Categorical(High, Medium, Low)
Bare Nuclei Categorical(High, Medium, Low) Nucleoli Categorical(High, Medium, Low) Bland
Chromatin
Categorical(High, Medium, Low)
Mitoses Categorical(High, Medium, Low) Swelling Categorical(High, Medium, Low) Lump Categorical(High, Medium, Low) Nipple
Discharge
Categorical(High, Medium, Low)
cell shape(CShp), Marginal Adhesion(MA), Single Epithelial Cell Size(ECS), Bare Nuclei(BN), Bland Chromatin(BC), Normal Nuclei(NN), Mitosis(M)[3].The dataset of breast cancer disease divide into 241 malignant case and 458 benign case. At this level Data mining applied using J48 on the breast cancer dataset and classified data in malignant and benign class.
2.2 Second level diagnosis
After first level diagnosis the cases are classified as an malignant and benign. The malignant cases are pass to second level diagnosis for further classification as: Ductal carcinoma in situ (DCIS), Lobular carcinoma in situ(LCIS), Invasive Ductal Carcinoma(IDC), Invasive Lobular Carcinoma(ILC) and Mucinous Carcinoma(MC). J48 algorithm was applied at second level.
At the second level data consist of attributes such as:
pathological parameters and physiological parameters. Pathological test result taken from Wisconsin breast cancer dataset from UCI machine and the physiological parameter dataset collect from hospital. The pathological parameters are[2]classified as: Cellularity(C) which further categorized as: Cellularity Scanty(CS) and Cellularity High(CH); Marginal Adhesion(MA) which is further categorized as: Marginal Loose(ML) and Marginal Tight(MT); Epithelial Cell Size(ECS) which is further categorized as: Normal Epithelial cell size (EN), Moderately Epithelial cell size (EM) and Enlarged Epithelial cell size (EE); Bare Nuclei(BN) which is further categorized as: Nuclei Present (NP) and Nuclei Absence(NA); Nucleoli(N) which is further categorized as: Nucleoli Absence(NA), Nucleoli Inconspicuous(NI) and Nucleoli Prominent(NP); Bland Chromatin(BC) further categorized as: Chromatin Stippled(CS), Chromatin Coarse(CC); Mitoses(M) further categorized as: Mitoses Abnormal (MA), Mitoses Present(MP) and Mitoses Absence (MA).The Physiological parameter are classified as: Swelling (SW), Lump(L), Nipple Discharge(ND), Pain(P).[9] The detail of dataset shown in table1 and hierarchal relationship between the parameter and their sub parameter are shown in figure1.
Breast Cancer
Pathological Physiological
CS
C
CH MA ML SW
MT L
EN ND
ECS EM P
EE
EN NP
NA
NA
N NI
NP
BC CS
CC
MA
M MP
MA
Fig 1: Hierarchical correlation of Pathological test result and Physiological symptoms of Breast Cancer Disease
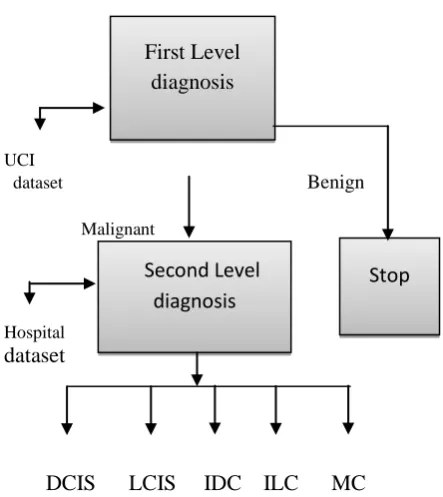
The diagnosis processes at first and second level are shown in Figure 2. In this process, firstly enter the dataset of Wisconsin‟s breast cancer in the first level and classify it into benign and malignant cases with J48 algorithm and further malignant breast cancer dataset passes again at second level and classified it into different five malignant breast cancer diseases.
[image:2.595.312.536.73.465.2]UCI
dataset Benign
Malignant
Hospital
dataset
[image:3.595.52.274.73.322.2]
DCIS LCIS IDC ILC MC
Fig 2: Process of diagnosis of breast cancer
3. EXPERIMENT WORK AND RESULT
The classification of breast cancer at first level in malignant or benign and at the second level in Ductal Carcinoma in Situ(DCIS), Lobular Carcinoma in Situ(LCIS), Invasive Ductal Carcinoma(IDC), Invasive Lobular Carcinoma(ILC) and Mucinous Carcinoma(MC) done using J48 algorithm of Weka(version3.6.4) tool.The pruned tree of first level diagnosis and the second level diagnosis shown in given figure3 and figure4 respectively. Some rules that generated by J48 pruned tree at second level as shown in figure4 as:
Rule1: If loose cohesive=medium; B nuclei=medium and swelling low then DCIS.
Rule2: If loose cohesive=medium; B nuclei=medium and swelling medium then DCIS
Rule3: If loose cohesive=medium; B nuclei=medium and swelling high then IDC.
Rule4: If loose cohesive=medium and B nuclei=low then DCIS.
Rule5: If loose cohesive=medium; B nuclei=high and lump high then ILC.
Rule6: If loose cohesive=medium; B nuclei=high and lump medium then LCIS.
Figure3: Pruned tree of J48 at first level
Figure4: Pruned tree of J48 at second level
Stop
First Level
diagnosis
The decision tree generated at first level and at the second level is shown in figure5 and figure6.In figure 6 the High is labeled as H, Low as L and Medium as M.
Figuer5: Decision tree of the first level diagnosis
Figure6: Decision tree of the second level diagnosis
Confusion matrix generated from Weka tool is shown in Table 2. The results are computed using True positive and
Some Standard terms those have been defined for the matrix like
:
True positive (TP): Number of positive sample correctly predicted. If the outcome from a prediction is positive and the actual value is also positive, then it is called true positive.
False positive (FP):- Number of negative sample incorrectly predicted as positive. If the actual value is negative then it is named false positive (FP).
False negative (FN):-Number of positive sample incorrectly predicted.
[image:5.595.323.568.86.312.2]True negative (TN):-Number of negative samples correctly predicted.
Table 2: Confusion Matrix
a b c d e Classified as
19 1 0 0 0 |a=DCIS
0 18 0 2 0 |b=LCIS
0 0 19 1 0 |c=IDC
0 1 2 16 1 |d=ILC
2 0 2 1 15 |e=MC
In the above confusion matrix, the true positive (TP) for the class a= ‟DCIS‟ is 19 and the false positive(FP) is 1,0,0,0 .The true positive(TP) for the class b= „LCIS‟ is 18, while the false positive(FP) for class b is 0,0,2,0.For the class c= „IDC‟ , the true positive(TP) value is 19 and the false positive(FP) value is 0,0,1,0.For the class d=‟ILC‟, the true positive(TP) value is 16 and the false positive(FP) value is 0,1,2,1. For the class e= ‟MC‟, true false value 15 and false value is 2,0,2,1.
The true positive rate calculated as:-
True Positive Rate(TRP) for class a = 19/(19 +1)= 19/20=0.95
False positive Rate (FPR) for Class a=2/(2+ 79)= 2/ 81 = 0.0246
True Positive Rate(TRP) for class b= 18/(18 +2) =18 / 20=0.9
False Positive Rate(FPR) for Class b= 2/(2+ 82)= 2/ 84=0.024
True Positive Rate(TRP) for class c=19/(19+1) =19 / 20=0.95
False positive Rate(FPR) for Class c=4/(4+ 79)= 4/ 83=0.05
True Positive Rate(TRP) for class d= 16/(16+4)=16/ 20=0.8
False Positive Rate(FPR) for Class d= 4/(4+84)=4/ 88=0.045
True Positive Rate(TRP) for class e= 15/(15+5)=15/ 20=0.75
[image:5.595.317.551.473.723.2]False positive Rate(FPR) for Class e=1/(1+84)=1/85 =0.012
Table 3: Calculation of TPR and FPR
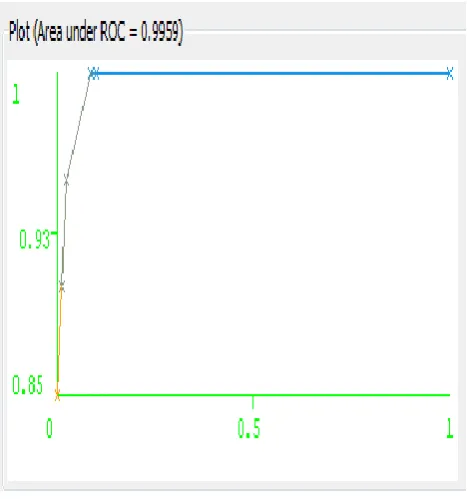
The receiver operating characteristic curve displays the relationship between true positives and false positives [6]. The ROC curve is a graphical plot which demonstrates of a classifier system. It is developed by plotting the fraction of true positive out of total actual positive rate and the fraction of false positive out of the total actual negative, at the threshold settings.[7] The Threshold curve of the five malignant diseases: Ductal Carcinoma in Situ(DCIS),Lobular Carcinoma in Situ(LCIS), Invasive Ductal Carcinoma(IDC), Invasive Lobular Carcinoma(ILC) and Mucinous Carcinoma(MC) are defined in given Figure 7,8,9,10 and 11 respectively. In this axis X defines the false positive rate, whereas its Y axis corresponds to the true positive rate.
Figure7: Threshold Curve of Ductal Carcinoma in Situ
Class True
positive
False positive
Sensitivity True positive
Specificity false positive
A 0.95 0.025 0.95 0.975
B 0.9 0.024 0.9 0.976
C 0.95 0.05 0.95 0.95
D 0.8 0.045 0.8 0.955
Figure8: Threshold Curve of Lobular Carcinoma in Situ
Figure9: Threshold Curve of Invasive Ductal Carcinoma
Figure10: Threshold Curve of Invasive Lobular Carcinoma
Figure11: Threshold Curve of Mucinous Carcinoma
4. CONCLUSION
In this work, breast cancer is diagnosed at two levels. At the first level diagnosis is based Wisconsin Breast Cancer dataset and classified into malignant and benign class. At the second level diagnosis based on pathological and physiological parameters of malignant breast cancer dataset that collected from hospital with the help of experts and classified into five breast cancer disease as: Ductal Carcinoma in Situ(DCIS), Lobular Carcinoma in Situ(LCIS), Invasive Ductal Carcinoma(IDC), Invasive Lobular Carcinoma(ILC) and Mucinous Carcinoma(MC).
of breast cancer dataset at two levels. The sensitivity for all malignant breast cancer diseases are lies between 94-100%. It was observed from the result that data mining can efficiently classify the breast cancer disease.The receiver operating characteristic (ROC) curve calculate the relationship between true positive and false positive with good efficiency. Therefore, the classification of two levels helpful for doctor and patients to diagnosis of breast cancer in early stage and saving the life of effected patient.
5. REFERENCES
[1] Qeethara Kadhim Ai-Shayea, “Artificial Neural Network in Medical Diagnosis”, International Journal of Computer Science, Issues Vol. 8, Issues 2, March 2011, pp 150-154.
[2] Nor Ashidi Mat Isa,Esugasini Subramaniam,Mohd Yusoff Mashor and Nor Hayati Othman, “Fine Needle Aspiration Cytology Evaluation for Classifying Breast Cancer Using Artificial Neural Network”, American Journal of Applied Science 4(12),2007,pp 999-1008.
[3] Vaibhav Narayan Chunekar and Hemant P.Ambulgekar, “Approach of Neural Network to Diagnosis Breast Cancer on Three Different Data Set”.Proc. of International Conference on Advances in Recent Technologies in Communication and Computing in 2009,pp 893-895.
[4] Babita Pandey and R.B Mishra, “Knowledge and Intelligent Computing System In Medicine”.Proc. of Computing in Biology and Medicine 2005, pp 215-230.
[5] Babita Pandey and R.B.Mishra, “Data Mining and CBR Integrated Method In Medicine: a review”.Proc. of International Journal of Medical Engineering and Informatics in 2010,pp 205-218. [6] Anshal Goyal and Ranji Mehta, “Performance
Comparison of Naïve Bayes and J48 Classification
Algorithms”.Proc. of International Journal of Applied Engineering Research,Vol.7,No.11(2012). [7] Tina R. Patil, Mrs. S.S. Sherekar, “Performance
Analysis of Naïve Bayes and J48 Classification Algorithm for Data Classification”.Proc. of International Journal of Computer Science and Application,Vol.6,No.2,Apr 2013,pp 256-261. [8] Breast Cancer Wisconsin Data, Available at-http:
//archive.ics.uci.edu/ml/machine-learning- database/breast-cancer-wiscosin/breast-cancer-wisconsin data.
[9] www.cancer.org/cancer/breastcancer/detailguides/br east-cancer-signs-symptoms.
[10] Amrita Ray Chaudhury ,K.K.lychettira, Rabjani lyer, Amrita Ray Chaudhury, “Diagnosis of Invasive Ductal Carcinoma Using Image Processing Techniques”.Proc. in Image Information Processing(ICIIP),2011 International Conference, pp 1-6.
[11] G.Ravi Kumar,G.A.Ramachandra and K.Nagamani, “An Efficient Prediction of Breast Cancer Data Using Data Mining Techniques”. Proc. in International Journal of Innovations in Engineering and Technology,2013,Vol.2, pp 139-144.
[12] Lauren Murray,Michael Reintgen and Kurt Akman et al., “Plwmorphic Lobular Carcinoma in Situ:Treatment Options for a New Pathologic Entity” ,Clinical Breast Cancer,2012,Vol.12, pp 76-79.
[13] Breast Cytology.Dr Appha Tsui Royal Mebourne Hospital 2008.
[14] Torill Squer, Department of Pathology,Oslo University Hospital.